
|
|||||
|
 | |
| |
| |
| |
| |
| |
|
Gene: PRPS1 |
Gene summary for PRPS1 |
| Gene information | Species | Human | Gene symbol | PRPS1 | Gene ID | 5631 |
| Gene name | phosphoribosyl pyrophosphate synthetase 1 | |
| Gene Alias | ARTS | |
| Cytomap | Xq22.3 | |
| Gene Type | protein-coding | GO ID | GO:0006015 | UniProtAcc | B7ZB02 |
Top |
Malignant transformation analysis |
| Identification of the aberrant gene expression in precancerous and cancerous lesions by comparing the gene expression of stem-like cells in diseased tissues with normal stem cells |
| Entrez ID | Symbol | Replicates | Species | Organ | Tissue | Adj P-value | Log2FC | Malignancy |
| 5631 | PRPS1 | LZE4T | Human | Esophagus | ESCC | 3.35e-06 | 2.39e-01 | 0.0811 |
| 5631 | PRPS1 | LZE7T | Human | Esophagus | ESCC | 2.28e-04 | 3.68e-01 | 0.0667 |
| 5631 | PRPS1 | LZE8T | Human | Esophagus | ESCC | 2.82e-04 | 1.09e-01 | 0.067 |
| 5631 | PRPS1 | LZE20T | Human | Esophagus | ESCC | 4.35e-05 | 7.35e-02 | 0.0662 |
| 5631 | PRPS1 | LZE24T | Human | Esophagus | ESCC | 6.40e-30 | 8.96e-01 | 0.0596 |
| 5631 | PRPS1 | LZE6T | Human | Esophagus | ESCC | 2.85e-06 | 3.80e-01 | 0.0845 |
| 5631 | PRPS1 | P1T-E | Human | Esophagus | ESCC | 8.70e-04 | 1.89e-01 | 0.0875 |
| 5631 | PRPS1 | P2T-E | Human | Esophagus | ESCC | 7.50e-24 | 5.05e-01 | 0.1177 |
| 5631 | PRPS1 | P4T-E | Human | Esophagus | ESCC | 1.98e-14 | 3.68e-01 | 0.1323 |
| 5631 | PRPS1 | P5T-E | Human | Esophagus | ESCC | 1.16e-14 | 2.27e-01 | 0.1327 |
| 5631 | PRPS1 | P8T-E | Human | Esophagus | ESCC | 8.09e-19 | 3.94e-01 | 0.0889 |
| 5631 | PRPS1 | P9T-E | Human | Esophagus | ESCC | 3.51e-13 | 3.23e-01 | 0.1131 |
| 5631 | PRPS1 | P10T-E | Human | Esophagus | ESCC | 1.11e-17 | 2.16e-01 | 0.116 |
| 5631 | PRPS1 | P11T-E | Human | Esophagus | ESCC | 2.69e-12 | 3.79e-01 | 0.1426 |
| 5631 | PRPS1 | P12T-E | Human | Esophagus | ESCC | 1.51e-14 | 1.81e-01 | 0.1122 |
| 5631 | PRPS1 | P15T-E | Human | Esophagus | ESCC | 1.19e-13 | 1.81e-01 | 0.1149 |
| 5631 | PRPS1 | P16T-E | Human | Esophagus | ESCC | 6.52e-22 | 1.63e-01 | 0.1153 |
| 5631 | PRPS1 | P17T-E | Human | Esophagus | ESCC | 1.97e-10 | 3.72e-01 | 0.1278 |
| 5631 | PRPS1 | P19T-E | Human | Esophagus | ESCC | 1.75e-08 | 3.95e-01 | 0.1662 |
| 5631 | PRPS1 | P20T-E | Human | Esophagus | ESCC | 1.63e-13 | 2.45e-01 | 0.1124 |
| Page: 1 2 3 4 5 |
| Tissue | Expression Dynamics | Abbreviation |
| Esophagus | 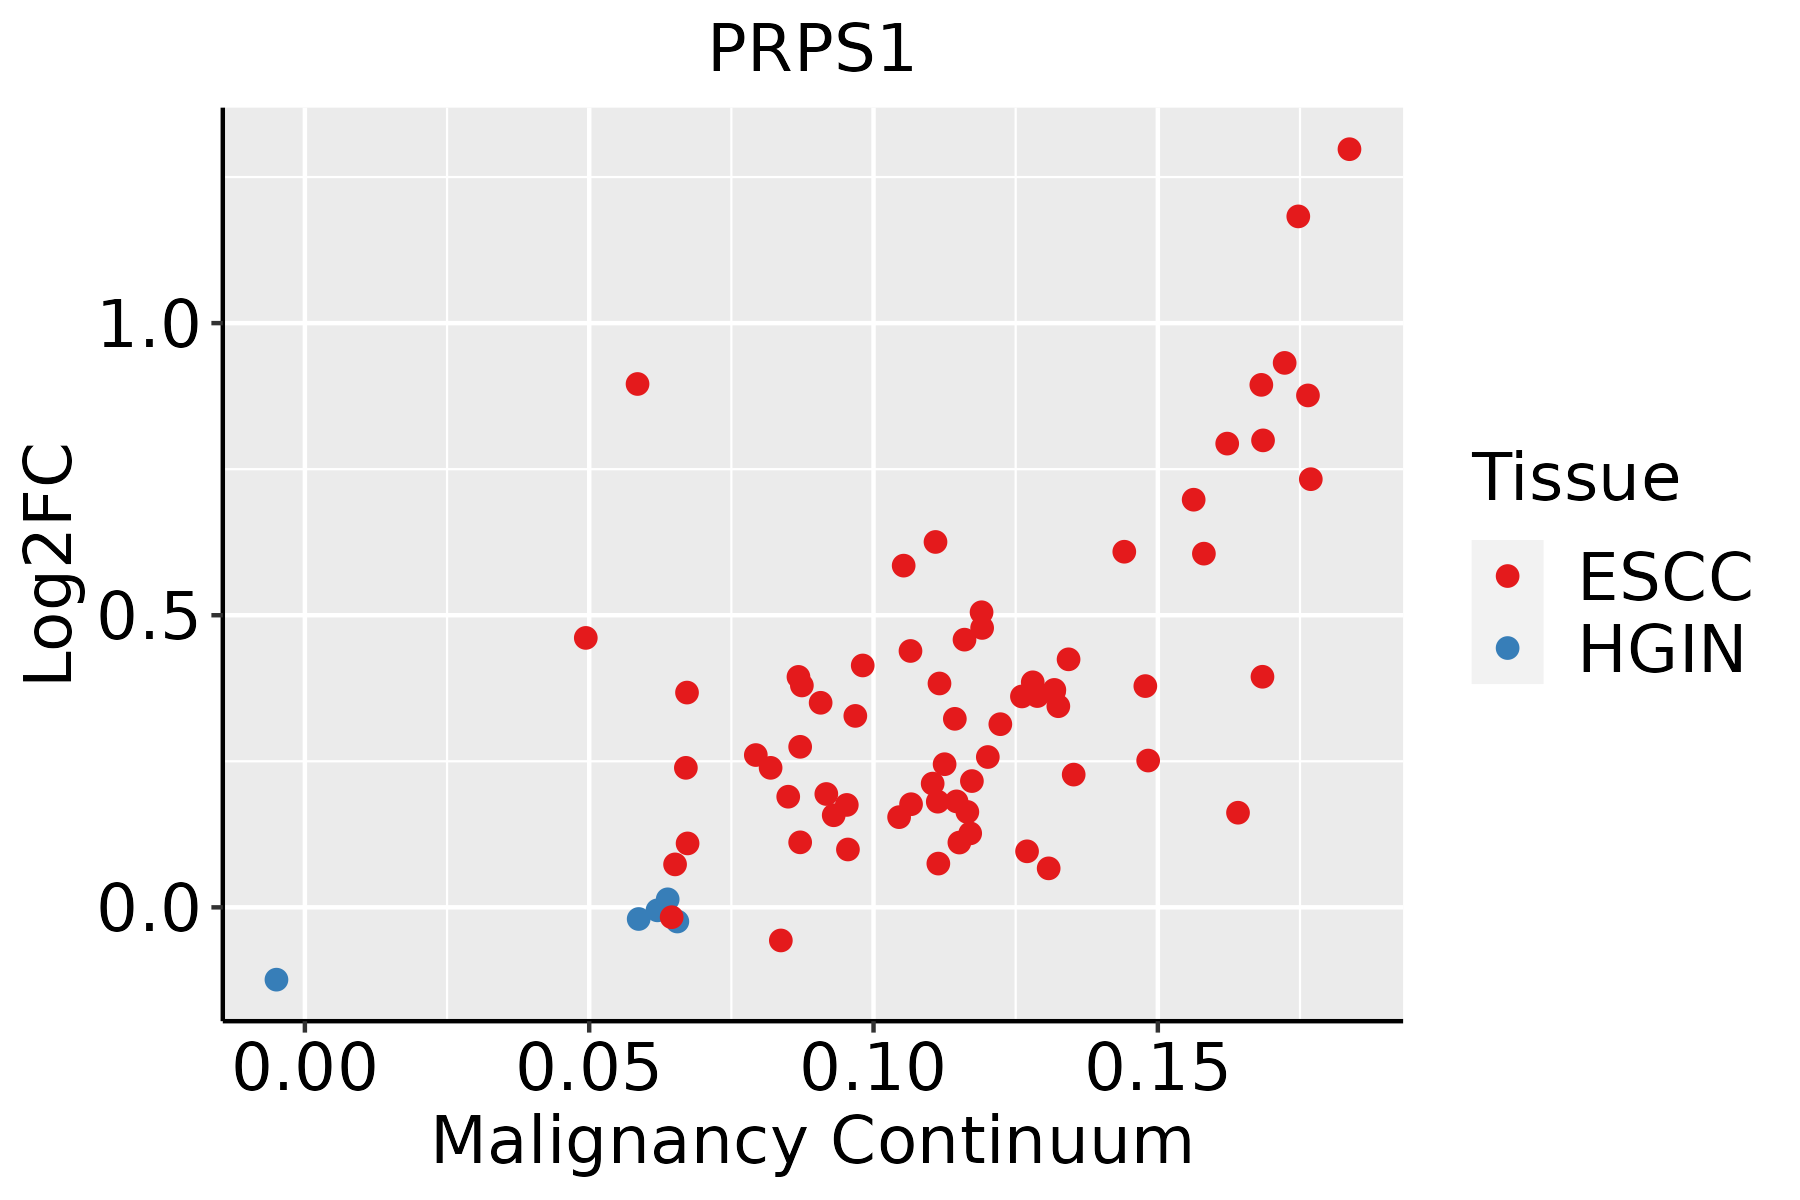 | ESCC: Esophageal squamous cell carcinoma |
| HGIN: High-grade intraepithelial neoplasias | ||
| LGIN: Low-grade intraepithelial neoplasias | ||
| Liver | 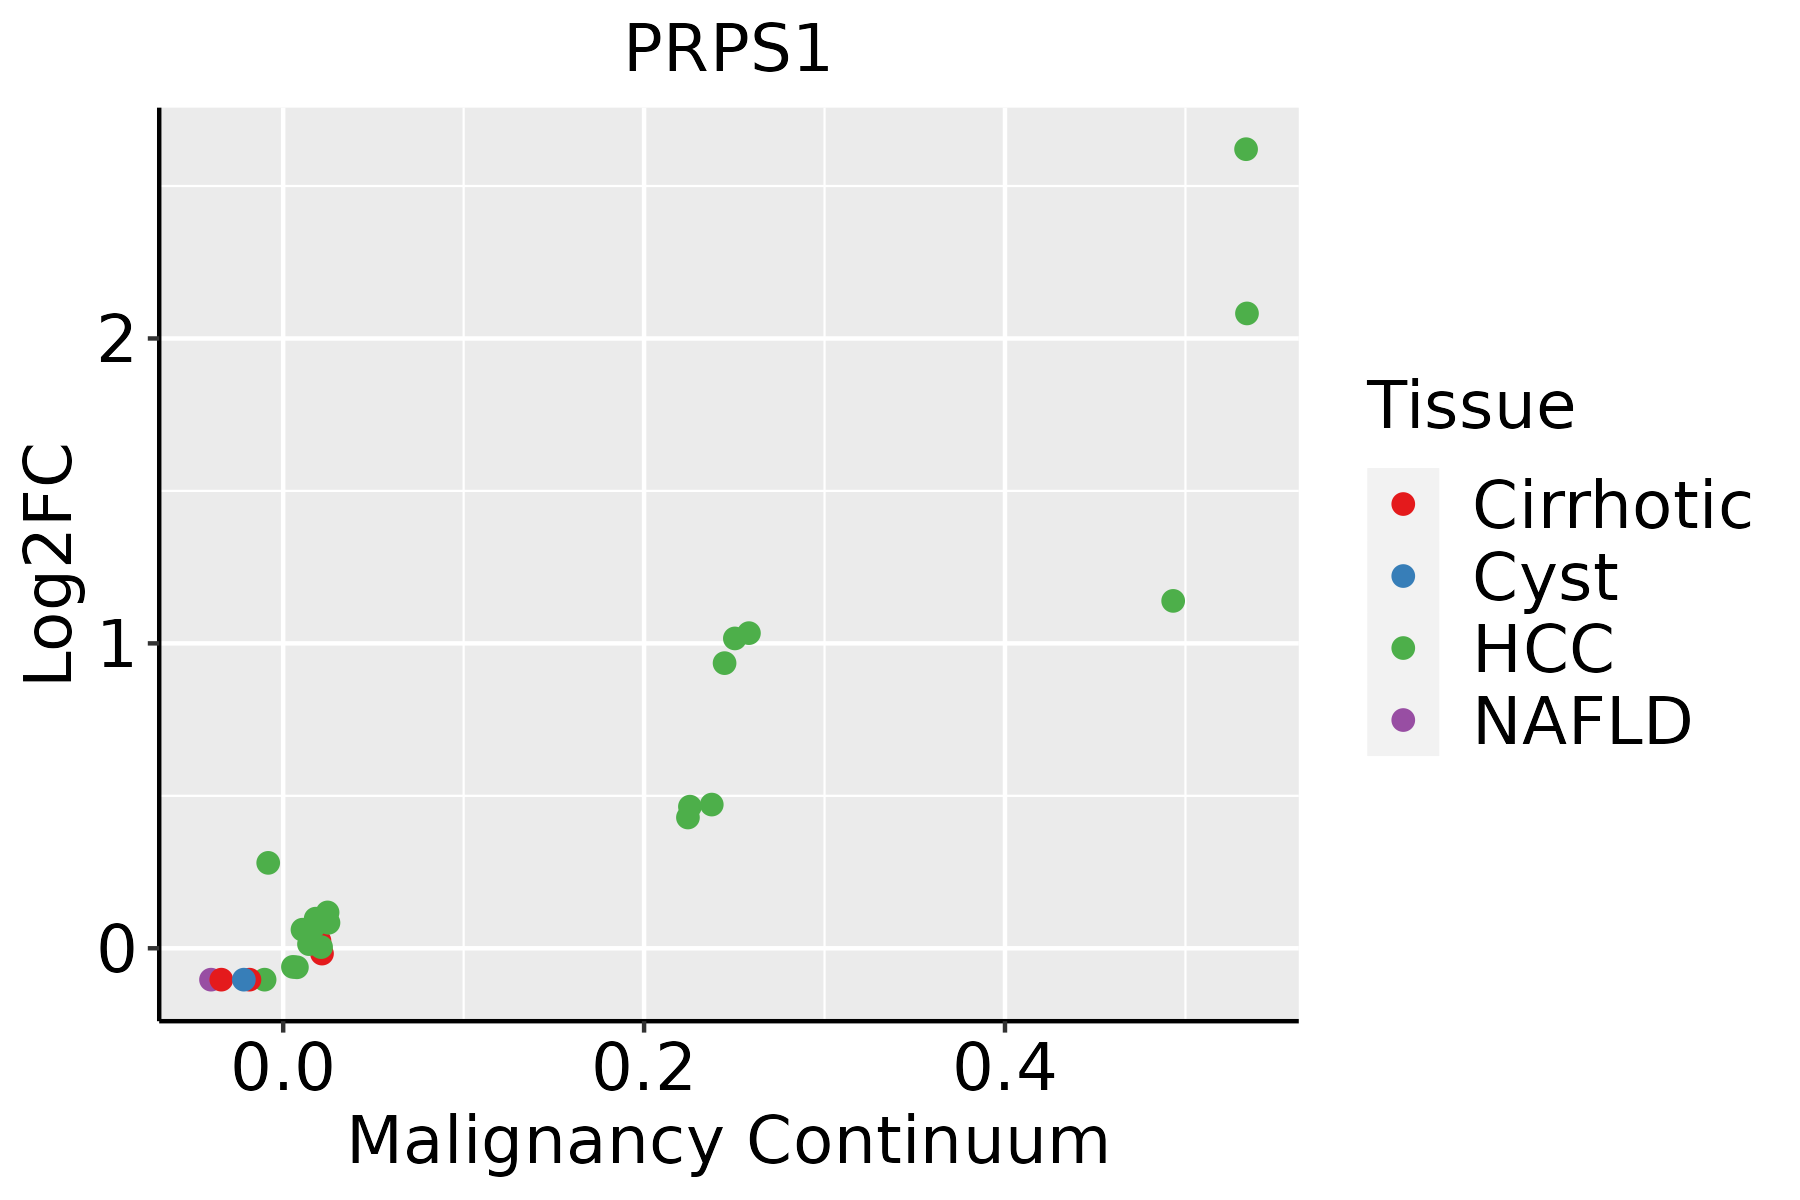 | HCC: Hepatocellular carcinoma |
| NAFLD: Non-alcoholic fatty liver disease | ||
| Oral Cavity | 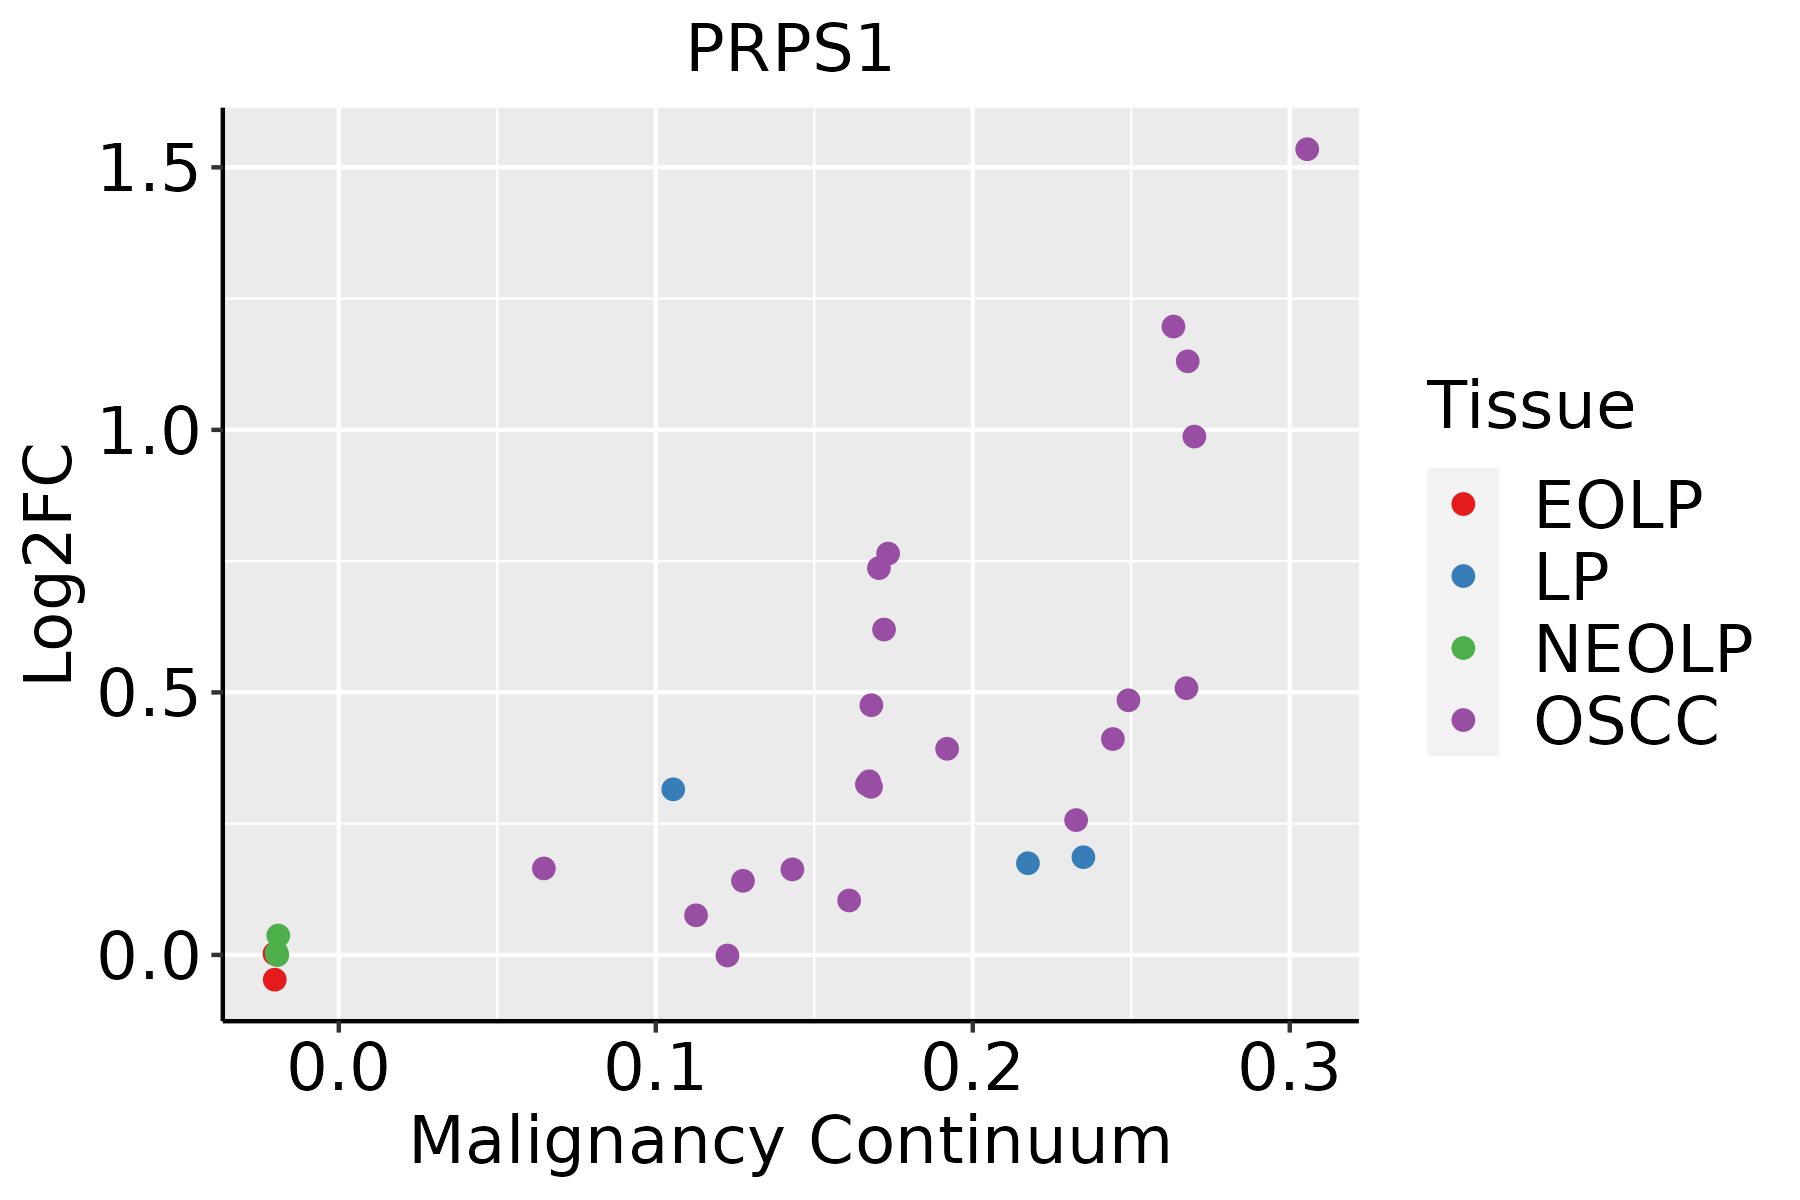 | EOLP: Erosive Oral lichen planus |
| LP: leukoplakia | ||
| NEOLP: Non-erosive oral lichen planus | ||
| OSCC: Oral squamous cell carcinoma |
| ∗log2FC in expression of this searched gene in stem-like cells from each diseased tissue sample relative to stem-like cells in normal samples in each tissue plotted against the malignancy continuum. Samples are colored based on if they are from different disease stage. |
Top |
Malignant transformation related pathway analysis |
| Find out the enriched GO biological processes and KEGG pathways involved in transition from healthy to precancer to cancer |
| Tissue | Disease Stage | Enriched GO biological Processes |
| Colorectum | AD |  |
| Colorectum | SER |  |
| Colorectum | MSS |  |
| Colorectum | MSI-H |  |
| Colorectum | FAP |  |
| ∗Top 15 enriched GO BP terms are showed in the bar plot of each disease state in each tissue. Each row represents a significant GO biological process which is colored according to the -log10(p.adjust). |
| Page: 1 2 3 4 5 6 7 8 9 |
| GO ID | Tissue | Disease Stage | Description | Gene Ratio | Bg Ratio | pvalue | p.adjust | Count |
| GO:0006753110 | Esophagus | ESCC | nucleoside phosphate metabolic process | 288/8552 | 497/18723 | 1.80e-08 | 3.50e-07 | 288 |
| GO:0019693111 | Esophagus | ESCC | ribose phosphate metabolic process | 234/8552 | 396/18723 | 4.24e-08 | 7.76e-07 | 234 |
| GO:0009117111 | Esophagus | ESCC | nucleotide metabolic process | 282/8552 | 489/18723 | 4.70e-08 | 8.50e-07 | 282 |
| GO:0072521111 | Esophagus | ESCC | purine-containing compound metabolic process | 238/8552 | 416/18723 | 1.20e-06 | 1.49e-05 | 238 |
| GO:0046390110 | Esophagus | ESCC | ribose phosphate biosynthetic process | 119/8552 | 190/18723 | 1.73e-06 | 2.06e-05 | 119 |
| GO:0006163111 | Esophagus | ESCC | purine nucleotide metabolic process | 226/8552 | 396/18723 | 2.81e-06 | 3.21e-05 | 226 |
| GO:000916516 | Esophagus | ESCC | nucleotide biosynthetic process | 150/8552 | 254/18723 | 1.12e-05 | 1.06e-04 | 150 |
| GO:190129316 | Esophagus | ESCC | nucleoside phosphate biosynthetic process | 151/8552 | 256/18723 | 1.15e-05 | 1.08e-04 | 151 |
| GO:007252217 | Esophagus | ESCC | purine-containing compound biosynthetic process | 120/8552 | 200/18723 | 3.02e-05 | 2.51e-04 | 120 |
| GO:000616417 | Esophagus | ESCC | purine nucleotide biosynthetic process | 113/8552 | 191/18723 | 1.16e-04 | 8.04e-04 | 113 |
| GO:19016574 | Esophagus | ESCC | glycosyl compound metabolic process | 57/8552 | 88/18723 | 2.32e-04 | 1.44e-03 | 57 |
| GO:00091133 | Esophagus | ESCC | purine nucleobase biosynthetic process | 10/8552 | 10/18723 | 3.94e-04 | 2.26e-03 | 10 |
| GO:00062203 | Esophagus | ESCC | pyrimidine nucleotide metabolic process | 35/8552 | 50/18723 | 4.33e-04 | 2.44e-03 | 35 |
| GO:00091234 | Esophagus | ESCC | nucleoside monophosphate metabolic process | 49/8552 | 76/18723 | 7.30e-04 | 3.80e-03 | 49 |
| GO:00725273 | Esophagus | ESCC | pyrimidine-containing compound metabolic process | 52/8552 | 82/18723 | 9.03e-04 | 4.61e-03 | 52 |
| GO:00091124 | Esophagus | ESCC | nucleobase metabolic process | 25/8552 | 34/18723 | 9.19e-04 | 4.68e-03 | 25 |
| GO:00461123 | Esophagus | ESCC | nucleobase biosynthetic process | 15/8552 | 18/18723 | 1.20e-03 | 5.88e-03 | 15 |
| GO:00091615 | Esophagus | ESCC | ribonucleoside monophosphate metabolic process | 38/8552 | 58/18723 | 1.81e-03 | 8.32e-03 | 38 |
| GO:00091243 | Esophagus | ESCC | nucleoside monophosphate biosynthetic process | 29/8552 | 42/18723 | 1.87e-03 | 8.46e-03 | 29 |
| GO:00461482 | Esophagus | ESCC | pigment biosynthetic process | 40/8552 | 62/18723 | 2.14e-03 | 9.54e-03 | 40 |
| Page: 1 2 3 4 |
| Pathway ID | Tissue | Disease Stage | Description | Gene Ratio | Bg Ratio | pvalue | p.adjust | qvalue | Count |
| hsa0120023 | Esophagus | ESCC | Carbon metabolism | 79/4205 | 115/8465 | 2.50e-05 | 1.21e-04 | 6.22e-05 | 79 |
| hsa0123023 | Esophagus | ESCC | Biosynthesis of amino acids | 49/4205 | 75/8465 | 4.35e-03 | 1.12e-02 | 5.74e-03 | 49 |
| hsa0120033 | Esophagus | ESCC | Carbon metabolism | 79/4205 | 115/8465 | 2.50e-05 | 1.21e-04 | 6.22e-05 | 79 |
| hsa0123033 | Esophagus | ESCC | Biosynthesis of amino acids | 49/4205 | 75/8465 | 4.35e-03 | 1.12e-02 | 5.74e-03 | 49 |
| hsa0120041 | Liver | HCC | Carbon metabolism | 89/4020 | 115/8465 | 3.92e-11 | 6.56e-10 | 3.65e-10 | 89 |
| hsa0123021 | Liver | HCC | Biosynthesis of amino acids | 53/4020 | 75/8465 | 3.79e-05 | 2.11e-04 | 1.18e-04 | 53 |
| hsa000302 | Liver | HCC | Pentose phosphate pathway | 21/4020 | 30/8465 | 1.06e-02 | 2.71e-02 | 1.51e-02 | 21 |
| hsa0120051 | Liver | HCC | Carbon metabolism | 89/4020 | 115/8465 | 3.92e-11 | 6.56e-10 | 3.65e-10 | 89 |
| hsa0123031 | Liver | HCC | Biosynthesis of amino acids | 53/4020 | 75/8465 | 3.79e-05 | 2.11e-04 | 1.18e-04 | 53 |
| hsa000303 | Liver | HCC | Pentose phosphate pathway | 21/4020 | 30/8465 | 1.06e-02 | 2.71e-02 | 1.51e-02 | 21 |
| hsa0120014 | Oral cavity | OSCC | Carbon metabolism | 74/3704 | 115/8465 | 6.10e-06 | 3.05e-05 | 1.55e-05 | 74 |
| hsa012305 | Oral cavity | OSCC | Biosynthesis of amino acids | 45/3704 | 75/8465 | 3.27e-03 | 8.23e-03 | 4.19e-03 | 45 |
| hsa0120015 | Oral cavity | OSCC | Carbon metabolism | 74/3704 | 115/8465 | 6.10e-06 | 3.05e-05 | 1.55e-05 | 74 |
| hsa0123012 | Oral cavity | OSCC | Biosynthesis of amino acids | 45/3704 | 75/8465 | 3.27e-03 | 8.23e-03 | 4.19e-03 | 45 |
| Page: 1 |
Top |
Cell-cell communication analysis |
| Identification of potential cell-cell interactions between two cell types and their ligand-receptor pairs for different disease states |
| Ligand | Receptor | LRpair | Pathway | Tissue | Disease Stage |
| Page: 1 |
Top |
Single-cell gene regulatory network inference analysis |
| Find out the significant the regulons (TFs) and the target genes of each regulon across cell types for different disease states |
| TF | Cell Type | Tissue | Disease Stage | Target Gene | RSS | Regulon Activity |
| ∗The dot plots of a searched regulon are shown for all cell subpopulations in each disease state of each tissue based on the regulon specific score inferred using pySCENIC and by calculating the average expression. |
| Page: 1 |
Top |
Somatic mutation of malignant transformation related genes |
| Annotation of somatic variants for genes involved in malignant transformation |
| Hugo Symbol | Variant Class | Variant Classification | dbSNP RS | HGVSc | HGVSp | HGVSp Short | SWISSPROT | BIOTYPE | SIFT | PolyPhen | Tumor Sample Barcode | Tissue | Histology | Sex | Age | Stage | Therapy Types | Drugs | Outcome |
| PRPS1 | insertion | In_Frame_Ins | novel | c.250_251insCCAGGCCCTCCCATATATTTTATTTTATTTTATTTTATTTTT | p.Arg84delinsProArgProSerHisIlePheTyrPheIleLeuPheTyrPheTrp | p.R84delinsPRPSHIFYFILFYFW | P60891 | protein_coding | TCGA-A2-A0D1-01 | Breast | breast invasive carcinoma | Female | >=65 | I/II | Chemotherapy | taxotere | SD | ||
| PRPS1 | insertion | In_Frame_Ins | novel | c.948_949insGATGAA | p.Val316_Pro317insAspGlu | p.V316_P317insDE | P60891 | protein_coding | TCGA-A7-A0CG-01 | Breast | breast invasive carcinoma | Female | >=65 | I/II | Unknown | Unknown | SD | ||
| PRPS1 | insertion | Nonsense_Mutation | novel | c.950_951insAAAGTCAGCGTTTTTTCTCAGTTAGCATTTTGACTC | p.Pro317_Leu318insLysSerAlaPhePheLeuSerTerHisPheAspSer | p.P317_L318insKSAFFLS*HFDS | P60891 | protein_coding | TCGA-A7-A0CG-01 | Breast | breast invasive carcinoma | Female | >=65 | I/II | Unknown | Unknown | SD | ||
| PRPS1 | insertion | Frame_Shift_Ins | novel | c.157_158insCC | p.Val53AlafsTer16 | p.V53Afs*16 | P60891 | protein_coding | TCGA-AO-A0JD-01 | Breast | breast invasive carcinoma | Female | <65 | III/IV | Chemotherapy | cyclophosphamide | SD | ||
| PRPS1 | insertion | Frame_Shift_Ins | novel | c.158_159insCCTGAGTAGCTGGGACTACAGGTACCTGCCACCACACTCAG | p.Tyr54LeufsTer28 | p.Y54Lfs*28 | P60891 | protein_coding | TCGA-AO-A0JD-01 | Breast | breast invasive carcinoma | Female | <65 | III/IV | Chemotherapy | cyclophosphamide | SD | ||
| PRPS1 | insertion | Nonsense_Mutation | novel | c.772_773insGCACCCAGCCCTGAGAATGGTTTTTTTAAAC | p.Ile258SerfsTer5 | p.I258Sfs*5 | P60891 | protein_coding | TCGA-BH-A0HX-01 | Breast | breast invasive carcinoma | Female | <65 | I/II | Chemotherapy | adrimycin | SD | ||
| PRPS1 | SNV | Missense_Mutation | c.725N>T | p.Thr242Ile | p.T242I | P60891 | protein_coding | tolerated(0.11) | benign(0.019) | TCGA-A6-6781-01 | Colorectum | colon adenocarcinoma | Male | <65 | III/IV | Chemotherapy | oxaliplatin | SD | |
| PRPS1 | SNV | Missense_Mutation | c.569N>A | p.Ala190Asp | p.A190D | P60891 | protein_coding | deleterious(0) | probably_damaging(0.991) | TCGA-AG-3726-01 | Colorectum | rectum adenocarcinoma | Female | <65 | I/II | Unknown | Unknown | SD | |
| PRPS1 | SNV | Missense_Mutation | novel | c.445N>A | p.Pro149Thr | p.P149T | P60891 | protein_coding | deleterious(0.01) | probably_damaging(1) | TCGA-F5-6814-01 | Colorectum | rectum adenocarcinoma | Male | <65 | I/II | Unknown | Unknown | SD |
| PRPS1 | SNV | Missense_Mutation | novel | c.939C>A | p.Phe313Leu | p.F313L | P60891 | protein_coding | deleterious(0.02) | probably_damaging(0.998) | TCGA-A5-A0G1-01 | Endometrium | uterine corpus endometrioid carcinoma | Female | >=65 | I/II | Unknown | Unknown | SD |
| Page: 1 2 3 4 5 6 |
Top |
Related drugs of malignant transformation related genes |
| Identification of chemicals and drugs interact with genes involved in malignant transfromation |
| (DGIdb 4.0) |
| Entrez ID | Symbol | Category | Interaction Types | Drug Claim Name | Drug Name | PMIDs |
| 5631 | PRPS1 | DRUG RESISTANCE, DRUGGABLE GENOME, KINASE, ENZYME | THIOGUANINE | THIOGUANINE | 25962120 | |
| 5631 | PRPS1 | DRUG RESISTANCE, DRUGGABLE GENOME, KINASE, ENZYME | LOMETREXOL | LOMETREXOL | 25962120 | |
| 5631 | PRPS1 | DRUG RESISTANCE, DRUGGABLE GENOME, KINASE, ENZYME | MERCAPTOPURINE | MERCAPTOPURINE | 25962120 |
| Page: 1 |

Copyright 2023-Present -The University of Texas Health Science Center at Houston |