
|
|||||
|
 | |
| |
| |
| |
| |
| |
|
Gene: PRPF8 |
Gene summary for PRPF8 |
| Gene information | Species | Human | Gene symbol | PRPF8 | Gene ID | 10594 |
| Gene name | pre-mRNA processing factor 8 | |
| Gene Alias | HPRP8 | |
| Cytomap | 17p13.3 | |
| Gene Type | protein-coding | GO ID | GO:0000244 | UniProtAcc | Q6P2Q9 |
Top |
Malignant transformation analysis |
| Identification of the aberrant gene expression in precancerous and cancerous lesions by comparing the gene expression of stem-like cells in diseased tissues with normal stem cells |
| Entrez ID | Symbol | Replicates | Species | Organ | Tissue | Adj P-value | Log2FC | Malignancy |
| 10594 | PRPF8 | HTA11_2487_2000001011 | Human | Colorectum | SER | 9.44e-04 | 3.30e-01 | -0.1808 |
| 10594 | PRPF8 | HTA11_1938_2000001011 | Human | Colorectum | AD | 2.34e-05 | 5.22e-01 | -0.0811 |
| 10594 | PRPF8 | HTA11_78_2000001011 | Human | Colorectum | AD | 8.58e-04 | 3.30e-01 | -0.1088 |
| 10594 | PRPF8 | HTA11_347_2000001011 | Human | Colorectum | AD | 3.58e-19 | 6.27e-01 | -0.1954 |
| 10594 | PRPF8 | HTA11_3361_2000001011 | Human | Colorectum | AD | 3.81e-05 | 5.08e-01 | -0.1207 |
| 10594 | PRPF8 | HTA11_696_2000001011 | Human | Colorectum | AD | 3.99e-16 | 6.92e-01 | -0.1464 |
| 10594 | PRPF8 | HTA11_866_2000001011 | Human | Colorectum | AD | 1.37e-12 | 4.81e-01 | -0.1001 |
| 10594 | PRPF8 | HTA11_1391_2000001011 | Human | Colorectum | AD | 2.39e-16 | 7.25e-01 | -0.059 |
| 10594 | PRPF8 | HTA11_546_2000001011 | Human | Colorectum | AD | 5.83e-05 | 5.07e-01 | -0.0842 |
| 10594 | PRPF8 | HTA11_866_3004761011 | Human | Colorectum | AD | 3.13e-13 | 5.52e-01 | 0.096 |
| 10594 | PRPF8 | HTA11_4255_2000001011 | Human | Colorectum | SER | 2.83e-05 | 5.84e-01 | 0.0446 |
| 10594 | PRPF8 | HTA11_8622_2000001021 | Human | Colorectum | SER | 1.75e-04 | 5.32e-01 | 0.0528 |
| 10594 | PRPF8 | HTA11_7663_2000001011 | Human | Colorectum | SER | 8.09e-04 | 6.96e-01 | 0.0131 |
| 10594 | PRPF8 | HTA11_10711_2000001011 | Human | Colorectum | AD | 4.67e-03 | 4.01e-01 | 0.0338 |
| 10594 | PRPF8 | HTA11_7696_3000711011 | Human | Colorectum | AD | 4.17e-18 | 6.46e-01 | 0.0674 |
| 10594 | PRPF8 | HTA11_6818_2000001021 | Human | Colorectum | AD | 2.48e-05 | 4.11e-01 | 0.0588 |
| 10594 | PRPF8 | HTA11_99999970781_79442 | Human | Colorectum | MSS | 1.31e-05 | 4.41e-01 | 0.294 |
| 10594 | PRPF8 | HTA11_99999965104_69814 | Human | Colorectum | MSS | 1.31e-02 | 3.00e-01 | 0.281 |
| 10594 | PRPF8 | HTA11_99999971662_82457 | Human | Colorectum | MSS | 4.88e-03 | 3.21e-01 | 0.3859 |
| 10594 | PRPF8 | HTA11_99999974143_84620 | Human | Colorectum | MSS | 7.48e-07 | 4.37e-01 | 0.3005 |
| Page: 1 2 3 4 5 6 7 8 |
| Tissue | Expression Dynamics | Abbreviation |
| Colorectum (GSE201348) |  | FAP: Familial adenomatous polyposis |
| CRC: Colorectal cancer | ||
| Colorectum (HTA11) | 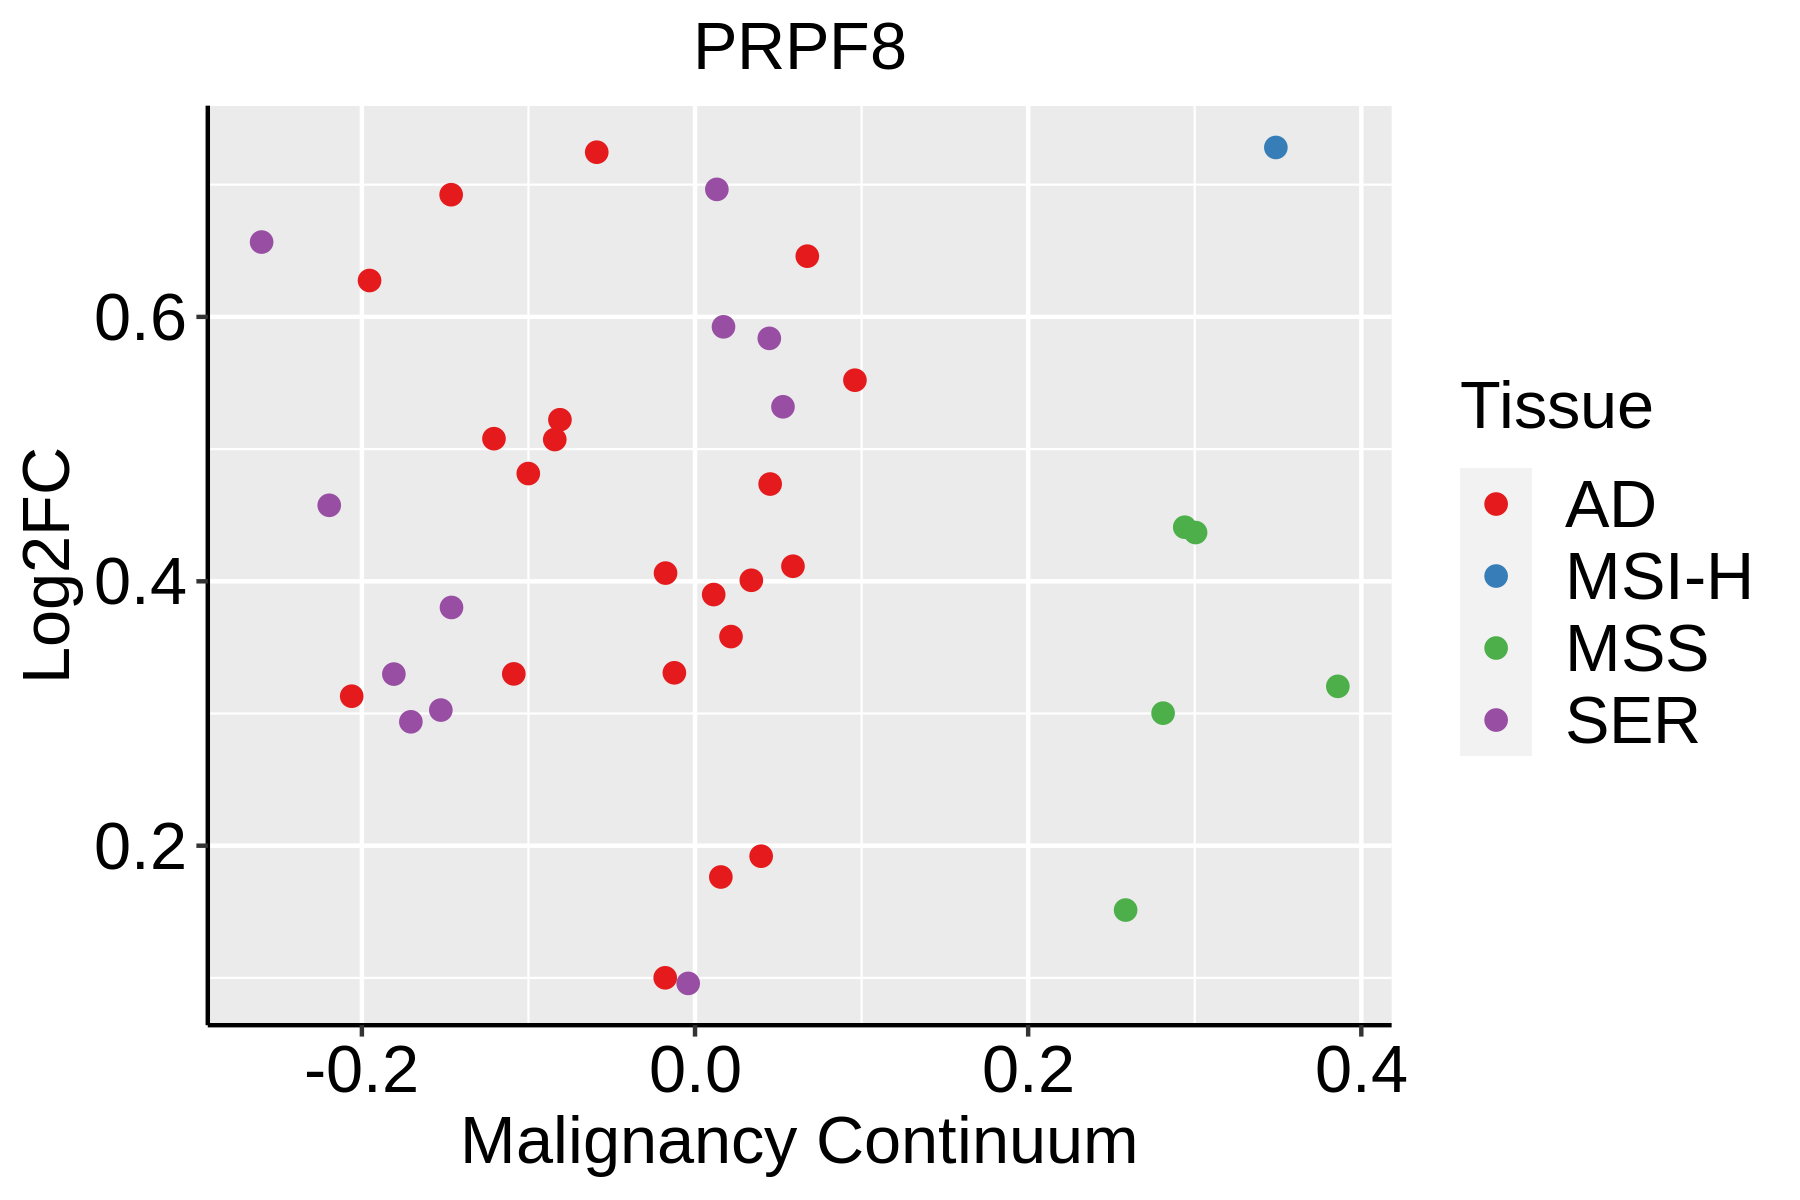 | AD: Adenomas |
| SER: Sessile serrated lesions | ||
| MSI-H: Microsatellite-high colorectal cancer | ||
| MSS: Microsatellite stable colorectal cancer | ||
| Esophagus |  | ESCC: Esophageal squamous cell carcinoma |
| HGIN: High-grade intraepithelial neoplasias | ||
| LGIN: Low-grade intraepithelial neoplasias | ||
| Liver | 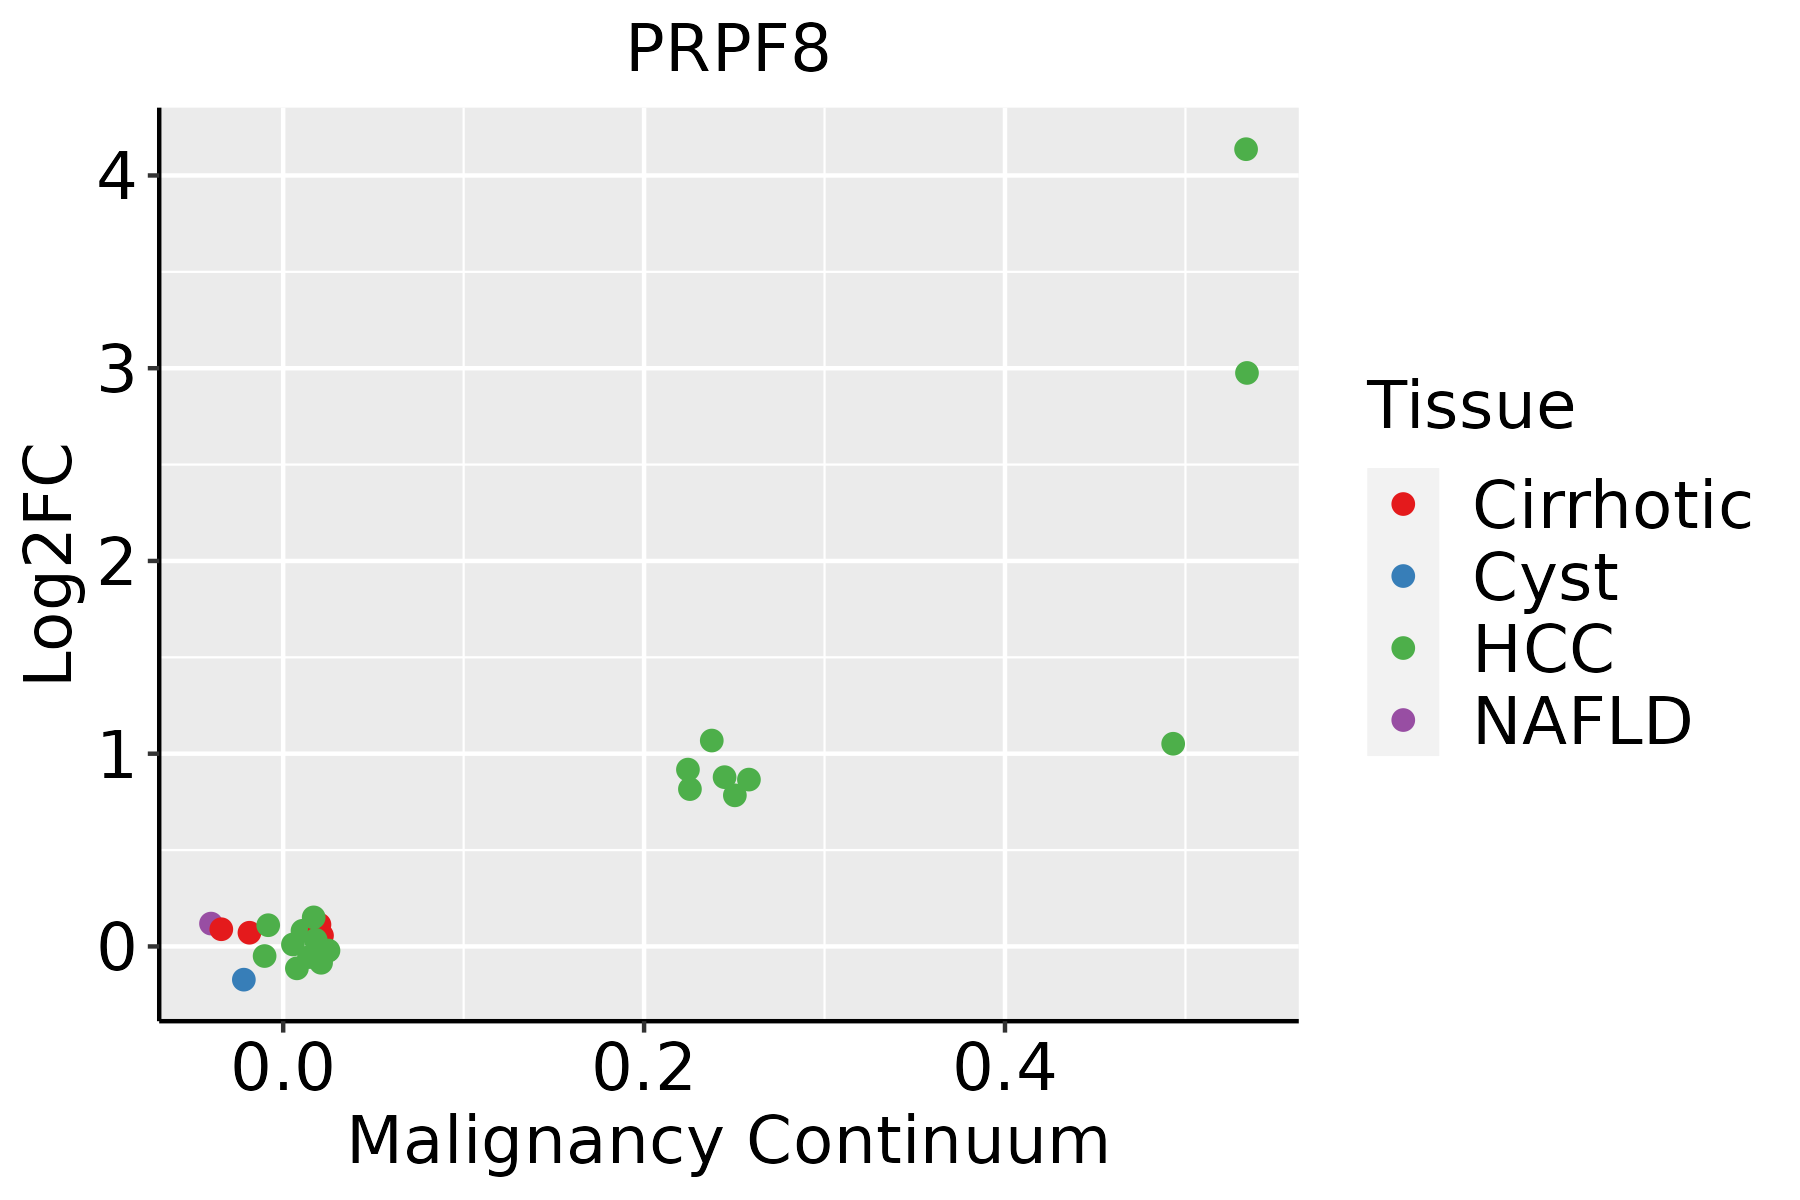 | HCC: Hepatocellular carcinoma |
| NAFLD: Non-alcoholic fatty liver disease | ||
| Oral Cavity |  | EOLP: Erosive Oral lichen planus |
| LP: leukoplakia | ||
| NEOLP: Non-erosive oral lichen planus | ||
| OSCC: Oral squamous cell carcinoma | ||
| Prostate |  | BPH: Benign Prostatic Hyperplasia |
| Skin | 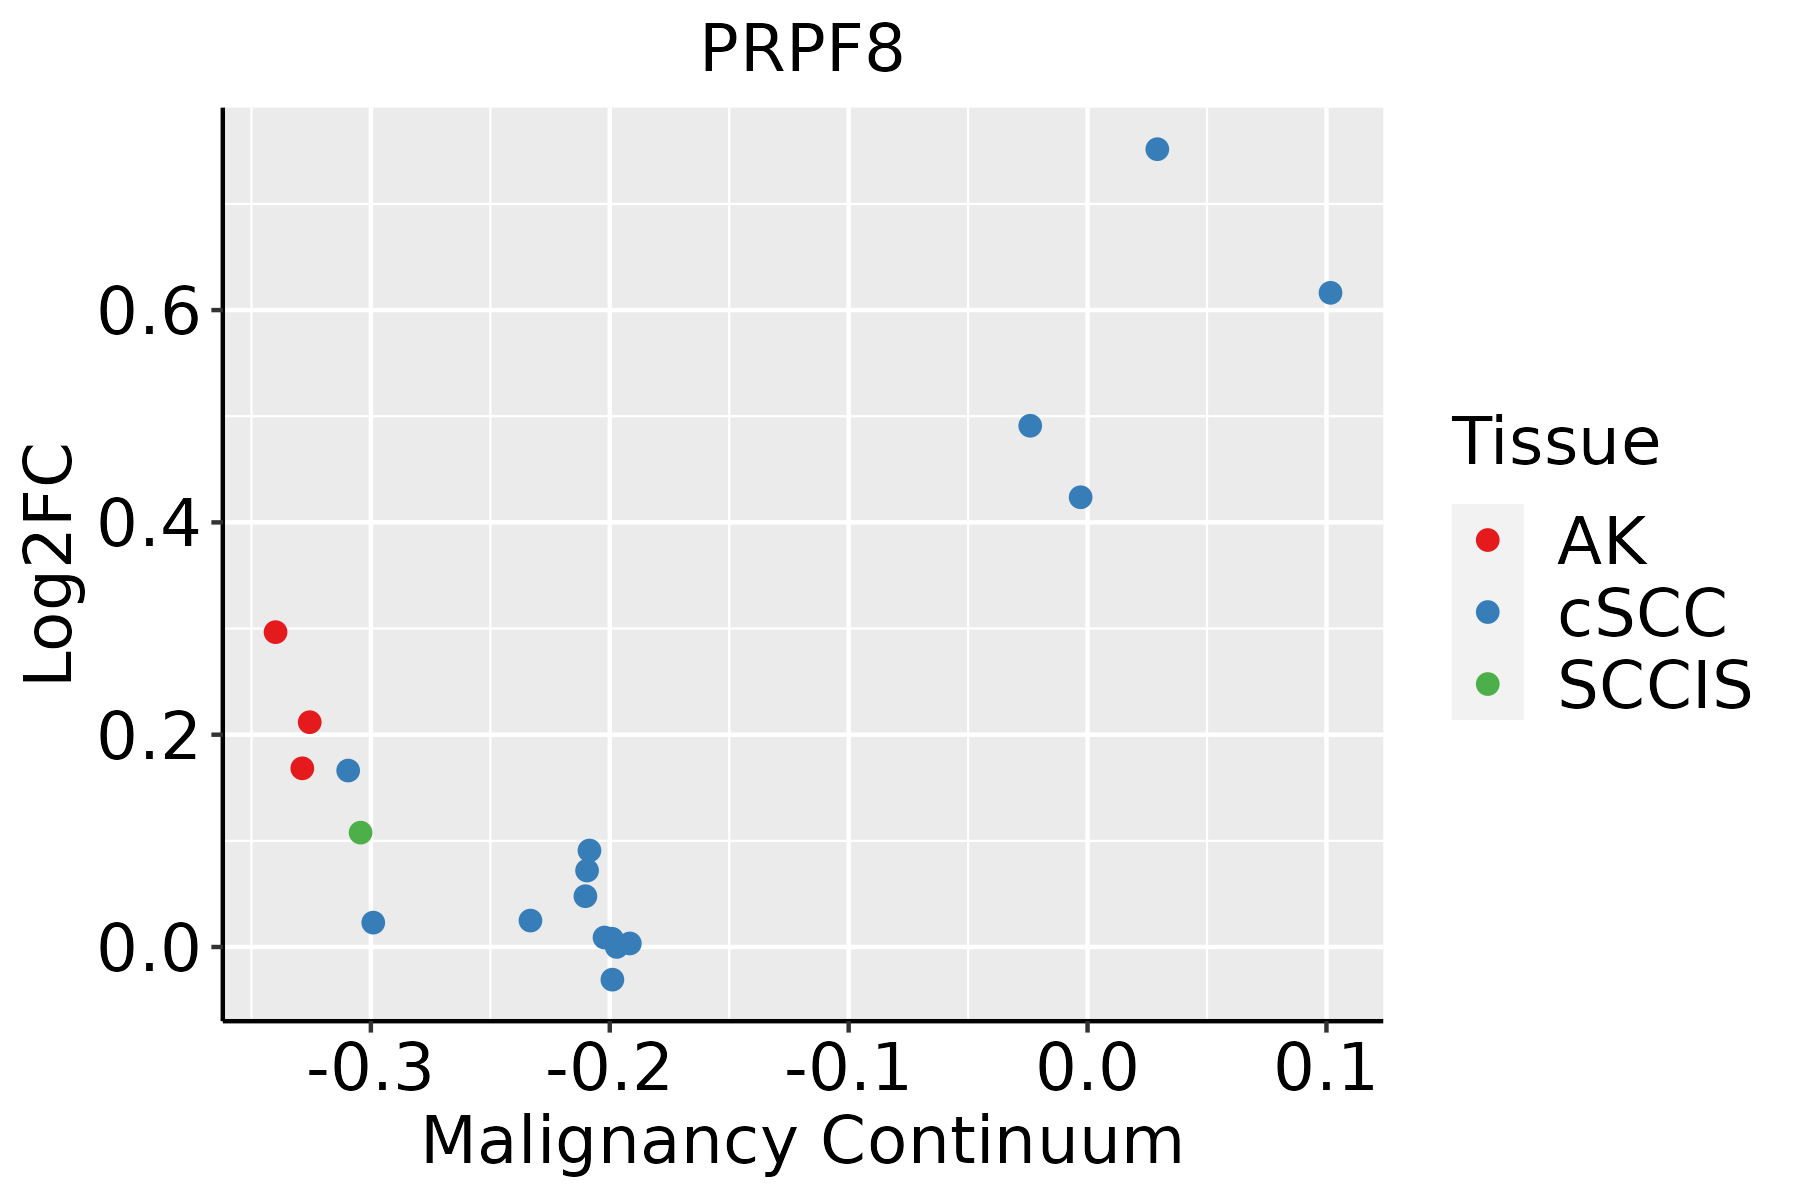 | AK: Actinic keratosis |
| cSCC: Cutaneous squamous cell carcinoma | ||
| SCCIS:squamous cell carcinoma in situ | ||
| Thyroid | 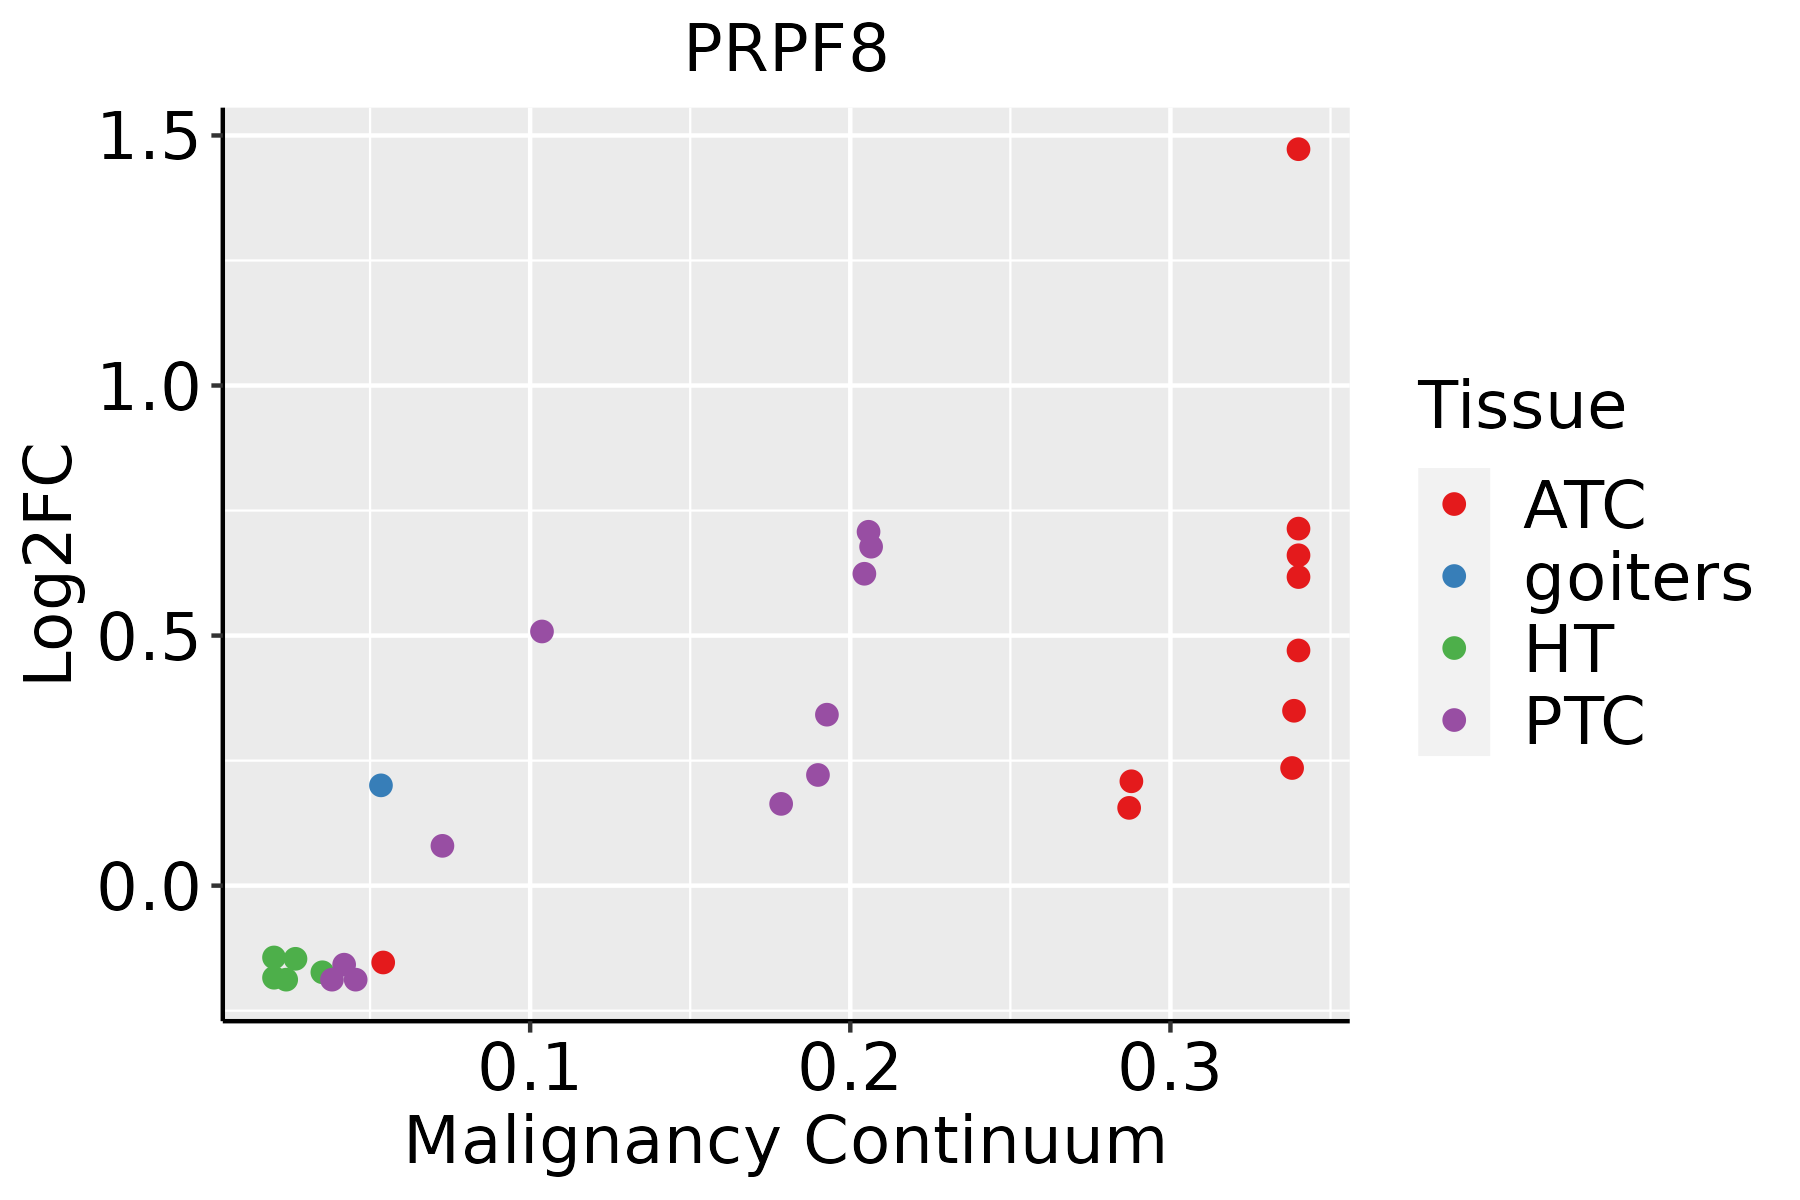 | ATC: Anaplastic thyroid cancer |
| HT: Hashimoto's thyroiditis | ||
| PTC: Papillary thyroid cancer |
| ∗log2FC in expression of this searched gene in stem-like cells from each diseased tissue sample relative to stem-like cells in normal samples in each tissue plotted against the malignancy continuum. Samples are colored based on if they are from different disease stage. |
Top |
Malignant transformation related pathway analysis |
| Find out the enriched GO biological processes and KEGG pathways involved in transition from healthy to precancer to cancer |
| Tissue | Disease Stage | Enriched GO biological Processes |
| Colorectum | AD |  |
| Colorectum | SER |  |
| Colorectum | MSS |  |
| Colorectum | MSI-H |  |
| Colorectum | FAP |  |
| ∗Top 15 enriched GO BP terms are showed in the bar plot of each disease state in each tissue. Each row represents a significant GO biological process which is colored according to the -log10(p.adjust). |
| Page: 1 2 3 4 5 6 7 8 9 |
| GO ID | Tissue | Disease Stage | Description | Gene Ratio | Bg Ratio | pvalue | p.adjust | Count |
| GO:0008380 | Colorectum | AD | RNA splicing | 169/3918 | 434/18723 | 3.59e-18 | 2.04e-15 | 169 |
| GO:0000377 | Colorectum | AD | RNA splicing, via transesterification reactions with bulged adenosine as nucleophile | 130/3918 | 320/18723 | 5.88e-16 | 2.16e-13 | 130 |
| GO:0000398 | Colorectum | AD | mRNA splicing, via spliceosome | 130/3918 | 320/18723 | 5.88e-16 | 2.16e-13 | 130 |
| GO:0000375 | Colorectum | AD | RNA splicing, via transesterification reactions | 131/3918 | 324/18723 | 7.11e-16 | 2.22e-13 | 131 |
| GO:0022618 | Colorectum | AD | ribonucleoprotein complex assembly | 92/3918 | 220/18723 | 1.49e-12 | 2.60e-10 | 92 |
| GO:0071826 | Colorectum | AD | ribonucleoprotein complex subunit organization | 94/3918 | 227/18723 | 1.70e-12 | 2.87e-10 | 94 |
| GO:0022613 | Colorectum | AD | ribonucleoprotein complex biogenesis | 151/3918 | 463/18723 | 1.96e-09 | 1.39e-07 | 151 |
| GO:00083801 | Colorectum | SER | RNA splicing | 123/2897 | 434/18723 | 3.84e-12 | 8.41e-10 | 123 |
| GO:00226181 | Colorectum | SER | ribonucleoprotein complex assembly | 69/2897 | 220/18723 | 2.25e-09 | 2.15e-07 | 69 |
| GO:00718261 | Colorectum | SER | ribonucleoprotein complex subunit organization | 70/2897 | 227/18723 | 3.83e-09 | 3.51e-07 | 70 |
| GO:00003751 | Colorectum | SER | RNA splicing, via transesterification reactions | 90/2897 | 324/18723 | 8.68e-09 | 7.50e-07 | 90 |
| GO:00003771 | Colorectum | SER | RNA splicing, via transesterification reactions with bulged adenosine as nucleophile | 89/2897 | 320/18723 | 9.82e-09 | 8.14e-07 | 89 |
| GO:00003981 | Colorectum | SER | mRNA splicing, via spliceosome | 89/2897 | 320/18723 | 9.82e-09 | 8.14e-07 | 89 |
| GO:00226131 | Colorectum | SER | ribonucleoprotein complex biogenesis | 112/2897 | 463/18723 | 5.01e-07 | 2.48e-05 | 112 |
| GO:00083802 | Colorectum | MSS | RNA splicing | 159/3467 | 434/18723 | 1.75e-19 | 1.22e-16 | 159 |
| GO:00003772 | Colorectum | MSS | RNA splicing, via transesterification reactions with bulged adenosine as nucleophile | 121/3467 | 320/18723 | 2.52e-16 | 8.27e-14 | 121 |
| GO:00003982 | Colorectum | MSS | mRNA splicing, via spliceosome | 121/3467 | 320/18723 | 2.52e-16 | 8.27e-14 | 121 |
| GO:00003752 | Colorectum | MSS | RNA splicing, via transesterification reactions | 122/3467 | 324/18723 | 2.75e-16 | 8.58e-14 | 122 |
| GO:00718262 | Colorectum | MSS | ribonucleoprotein complex subunit organization | 90/3467 | 227/18723 | 6.88e-14 | 1.78e-11 | 90 |
| GO:00226182 | Colorectum | MSS | ribonucleoprotein complex assembly | 88/3467 | 220/18723 | 7.12e-14 | 1.78e-11 | 88 |
| Page: 1 2 3 4 5 6 7 8 |
| Pathway ID | Tissue | Disease Stage | Description | Gene Ratio | Bg Ratio | pvalue | p.adjust | qvalue | Count |
| hsa03040 | Colorectum | AD | Spliceosome | 73/2092 | 217/8465 | 1.73e-03 | 9.68e-03 | 6.18e-03 | 73 |
| hsa030401 | Colorectum | AD | Spliceosome | 73/2092 | 217/8465 | 1.73e-03 | 9.68e-03 | 6.18e-03 | 73 |
| hsa030402 | Colorectum | MSS | Spliceosome | 66/1875 | 217/8465 | 2.58e-03 | 1.27e-02 | 7.81e-03 | 66 |
| hsa030403 | Colorectum | MSS | Spliceosome | 66/1875 | 217/8465 | 2.58e-03 | 1.27e-02 | 7.81e-03 | 66 |
| hsa0304027 | Esophagus | ESCC | Spliceosome | 128/4205 | 217/8465 | 3.31e-03 | 8.79e-03 | 4.50e-03 | 128 |
| hsa0304037 | Esophagus | ESCC | Spliceosome | 128/4205 | 217/8465 | 3.31e-03 | 8.79e-03 | 4.50e-03 | 128 |
| hsa030407 | Liver | Cirrhotic | Spliceosome | 102/2530 | 217/8465 | 5.69e-08 | 9.47e-07 | 5.84e-07 | 102 |
| hsa0304012 | Liver | Cirrhotic | Spliceosome | 102/2530 | 217/8465 | 5.69e-08 | 9.47e-07 | 5.84e-07 | 102 |
| hsa0304022 | Liver | HCC | Spliceosome | 122/4020 | 217/8465 | 5.55e-03 | 1.60e-02 | 8.91e-03 | 122 |
| hsa0304032 | Liver | HCC | Spliceosome | 122/4020 | 217/8465 | 5.55e-03 | 1.60e-02 | 8.91e-03 | 122 |
| hsa0304016 | Oral cavity | OSCC | Spliceosome | 123/3704 | 217/8465 | 7.21e-05 | 2.74e-04 | 1.40e-04 | 123 |
| hsa0304017 | Oral cavity | OSCC | Spliceosome | 123/3704 | 217/8465 | 7.21e-05 | 2.74e-04 | 1.40e-04 | 123 |
| hsa0304010 | Prostate | BPH | Spliceosome | 62/1718 | 217/8465 | 1.99e-03 | 7.92e-03 | 4.90e-03 | 62 |
| hsa0304015 | Prostate | BPH | Spliceosome | 62/1718 | 217/8465 | 1.99e-03 | 7.92e-03 | 4.90e-03 | 62 |
| hsa0304025 | Prostate | Tumor | Spliceosome | 66/1791 | 217/8465 | 7.53e-04 | 3.59e-03 | 2.23e-03 | 66 |
| hsa0304035 | Prostate | Tumor | Spliceosome | 66/1791 | 217/8465 | 7.53e-04 | 3.59e-03 | 2.23e-03 | 66 |
| Page: 1 |
Top |
Cell-cell communication analysis |
| Identification of potential cell-cell interactions between two cell types and their ligand-receptor pairs for different disease states |
| Ligand | Receptor | LRpair | Pathway | Tissue | Disease Stage |
| Page: 1 |
Top |
Single-cell gene regulatory network inference analysis |
| Find out the significant the regulons (TFs) and the target genes of each regulon across cell types for different disease states |
| TF | Cell Type | Tissue | Disease Stage | Target Gene | RSS | Regulon Activity |
| ∗The dot plots of a searched regulon are shown for all cell subpopulations in each disease state of each tissue based on the regulon specific score inferred using pySCENIC and by calculating the average expression. |
| Page: 1 |
Top |
Somatic mutation of malignant transformation related genes |
| Annotation of somatic variants for genes involved in malignant transformation |
| Hugo Symbol | Variant Class | Variant Classification | dbSNP RS | HGVSc | HGVSp | HGVSp Short | SWISSPROT | BIOTYPE | SIFT | PolyPhen | Tumor Sample Barcode | Tissue | Histology | Sex | Age | Stage | Therapy Types | Drugs | Outcome |
| PRPF8 | SNV | Missense_Mutation | novel | c.3631G>A | p.Asp1211Asn | p.D1211N | Q6P2Q9 | protein_coding | deleterious(0.03) | possibly_damaging(0.794) | TCGA-A8-A08C-01 | Breast | breast invasive carcinoma | Female | >=65 | I/II | Chemotherapy | 5-fluorouracil | CR |
| PRPF8 | SNV | Missense_Mutation | c.1877N>T | p.Gly626Val | p.G626V | Q6P2Q9 | protein_coding | deleterious(0) | probably_damaging(1) | TCGA-A8-A095-01 | Breast | breast invasive carcinoma | Female | <65 | I/II | Chemotherapy | 5-fluorouracil | CR | |
| PRPF8 | SNV | Missense_Mutation | c.4463N>T | p.Thr1488Ile | p.T1488I | Q6P2Q9 | protein_coding | deleterious(0) | probably_damaging(0.988) | TCGA-BH-A0GZ-01 | Breast | breast invasive carcinoma | Female | <65 | I/II | Hormone Therapy | arimidex | SD | |
| PRPF8 | SNV | Missense_Mutation | c.3017N>T | p.Ala1006Val | p.A1006V | Q6P2Q9 | protein_coding | tolerated(0.21) | probably_damaging(1) | TCGA-C8-A12T-01 | Breast | breast invasive carcinoma | Female | <65 | I/II | Unknown | Unknown | SD | |
| PRPF8 | SNV | Missense_Mutation | c.6008C>T | p.Thr2003Ile | p.T2003I | Q6P2Q9 | protein_coding | deleterious(0) | probably_damaging(0.999) | TCGA-C8-A132-01 | Breast | breast invasive carcinoma | Female | <65 | I/II | Unknown | Unknown | SD | |
| PRPF8 | SNV | Missense_Mutation | c.5425N>G | p.Ile1809Val | p.I1809V | Q6P2Q9 | protein_coding | tolerated(0.12) | probably_damaging(0.996) | TCGA-C8-A1HF-01 | Breast | breast invasive carcinoma | Female | <65 | I/II | Unknown | Unknown | SD | |
| PRPF8 | SNV | Missense_Mutation | c.4183N>C | p.Glu1395Gln | p.E1395Q | Q6P2Q9 | protein_coding | deleterious(0.02) | probably_damaging(0.911) | TCGA-C8-A1HM-01 | Breast | breast invasive carcinoma | Female | >=65 | I/II | Chemotherapy | doxorubicin | CR | |
| PRPF8 | SNV | Missense_Mutation | c.6517N>A | p.Glu2173Lys | p.E2173K | Q6P2Q9 | protein_coding | tolerated(0.07) | probably_damaging(0.994) | TCGA-D8-A1J8-01 | Breast | breast invasive carcinoma | Female | >=65 | I/II | Hormone Therapy | nolvadex | SD | |
| PRPF8 | SNV | Missense_Mutation | c.5360N>C | p.Arg1787Thr | p.R1787T | Q6P2Q9 | protein_coding | deleterious(0) | probably_damaging(1) | TCGA-GM-A2DO-01 | Breast | breast invasive carcinoma | Female | <65 | I/II | Hormone Therapy | tamoxiphen | CR | |
| PRPF8 | insertion | Nonsense_Mutation | novel | c.3084_3085insAAATAAATAAAAATAAAATGGAATGAAGCCCGGGGAGGGTG | p.Gly1029LysfsTer2 | p.G1029Kfs*2 | Q6P2Q9 | protein_coding | TCGA-A2-A0CM-01 | Breast | breast invasive carcinoma | Female | <65 | I/II | Chemotherapy | adriamycin | PD |
| Page: 1 2 3 4 5 6 7 8 9 10 11 12 13 14 15 16 17 18 19 20 21 22 |
Top |
Related drugs of malignant transformation related genes |
| Identification of chemicals and drugs interact with genes involved in malignant transfromation |
| (DGIdb 4.0) |
| Entrez ID | Symbol | Category | Interaction Types | Drug Claim Name | Drug Name | PMIDs |
| Page: 1 |

Copyright 2023-Present -The University of Texas Health Science Center at Houston |