
|
|||||
|
 | |
| |
| |
| |
| |
| |
|
Gene: PRPF6 |
Gene summary for PRPF6 |
| Gene information | Species | Human | Gene symbol | PRPF6 | Gene ID | 24148 |
| Gene name | pre-mRNA processing factor 6 | |
| Gene Alias | ANT-1 | |
| Cytomap | 20q13.33 | |
| Gene Type | protein-coding | GO ID | GO:0000244 | UniProtAcc | O94906 |
Top |
Malignant transformation analysis |
| Identification of the aberrant gene expression in precancerous and cancerous lesions by comparing the gene expression of stem-like cells in diseased tissues with normal stem cells |
| Entrez ID | Symbol | Replicates | Species | Organ | Tissue | Adj P-value | Log2FC | Malignancy |
| 24148 | PRPF6 | GSM4909293 | Human | Breast | IDC | 1.29e-04 | 2.43e-01 | 0.1581 |
| 24148 | PRPF6 | GSM4909296 | Human | Breast | IDC | 5.86e-03 | -1.07e-01 | 0.1524 |
| 24148 | PRPF6 | GSM4909297 | Human | Breast | IDC | 2.13e-03 | 4.84e-02 | 0.1517 |
| 24148 | PRPF6 | GSM4909298 | Human | Breast | IDC | 1.42e-06 | 2.97e-01 | 0.1551 |
| 24148 | PRPF6 | GSM4909301 | Human | Breast | IDC | 5.66e-12 | 4.27e-01 | 0.1577 |
| 24148 | PRPF6 | GSM4909311 | Human | Breast | IDC | 2.69e-09 | -6.38e-02 | 0.1534 |
| 24148 | PRPF6 | GSM4909317 | Human | Breast | IDC | 2.58e-36 | 7.50e-01 | 0.1355 |
| 24148 | PRPF6 | GSM4909318 | Human | Breast | IDC | 9.97e-10 | 7.05e-01 | 0.2031 |
| 24148 | PRPF6 | GSM4909319 | Human | Breast | IDC | 8.79e-20 | -3.51e-02 | 0.1563 |
| 24148 | PRPF6 | GSM4909320 | Human | Breast | IDC | 2.64e-08 | 2.62e-01 | 0.1575 |
| 24148 | PRPF6 | GSM4909321 | Human | Breast | IDC | 1.24e-05 | 6.96e-02 | 0.1559 |
| 24148 | PRPF6 | M1 | Human | Breast | IDC | 1.22e-06 | 3.42e-01 | 0.1577 |
| 24148 | PRPF6 | NCCBC14 | Human | Breast | DCIS | 1.97e-04 | 9.93e-02 | 0.2021 |
| 24148 | PRPF6 | NCCBC2 | Human | Breast | DCIS | 4.15e-10 | 5.37e-01 | 0.1554 |
| 24148 | PRPF6 | NCCBC5 | Human | Breast | DCIS | 1.75e-05 | 1.22e-01 | 0.2046 |
| 24148 | PRPF6 | P1 | Human | Breast | IDC | 2.76e-05 | -1.86e-02 | 0.1527 |
| 24148 | PRPF6 | DCIS2 | Human | Breast | DCIS | 2.39e-55 | 2.72e-01 | 0.0085 |
| 24148 | PRPF6 | HTA11_2487_2000001011 | Human | Colorectum | SER | 4.59e-02 | 1.10e-01 | -0.1808 |
| 24148 | PRPF6 | HTA11_2951_2000001011 | Human | Colorectum | AD | 2.02e-02 | 3.17e-01 | 0.0216 |
| 24148 | PRPF6 | HTA11_347_2000001011 | Human | Colorectum | AD | 1.74e-07 | 3.21e-01 | -0.1954 |
| Page: 1 2 3 4 5 6 7 8 9 |
| Tissue | Expression Dynamics | Abbreviation |
| Breast | 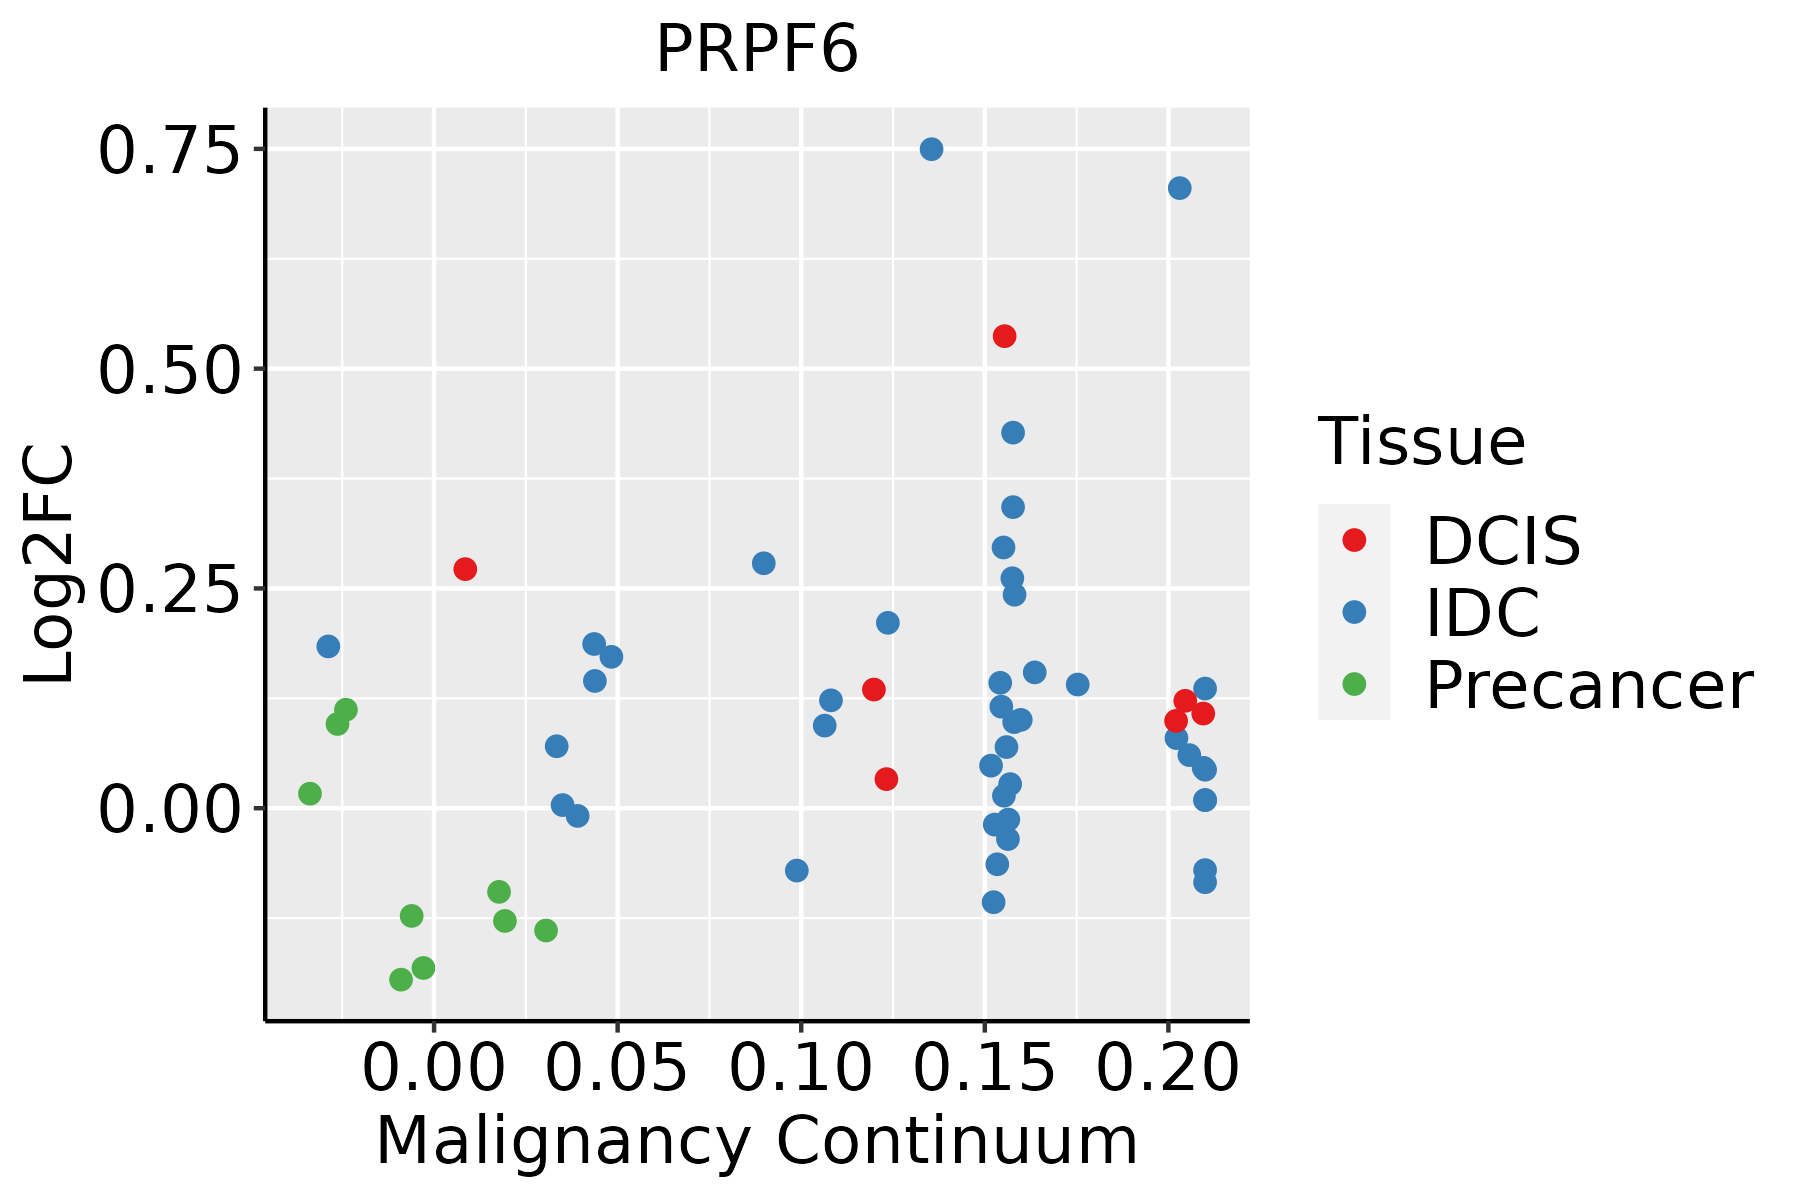 | IDC: Invasive ductal carcinoma |
| DCIS: Ductal carcinoma in situ | ||
| Precancer(BRCA1-mut): Precancerous lesion from BRCA1 mutation carriers | ||
| Colorectum (GSE201348) |  | FAP: Familial adenomatous polyposis |
| CRC: Colorectal cancer | ||
| Colorectum (HTA11) |  | AD: Adenomas |
| SER: Sessile serrated lesions | ||
| MSI-H: Microsatellite-high colorectal cancer | ||
| MSS: Microsatellite stable colorectal cancer | ||
| Esophagus |  | ESCC: Esophageal squamous cell carcinoma |
| HGIN: High-grade intraepithelial neoplasias | ||
| LGIN: Low-grade intraepithelial neoplasias | ||
| Liver | 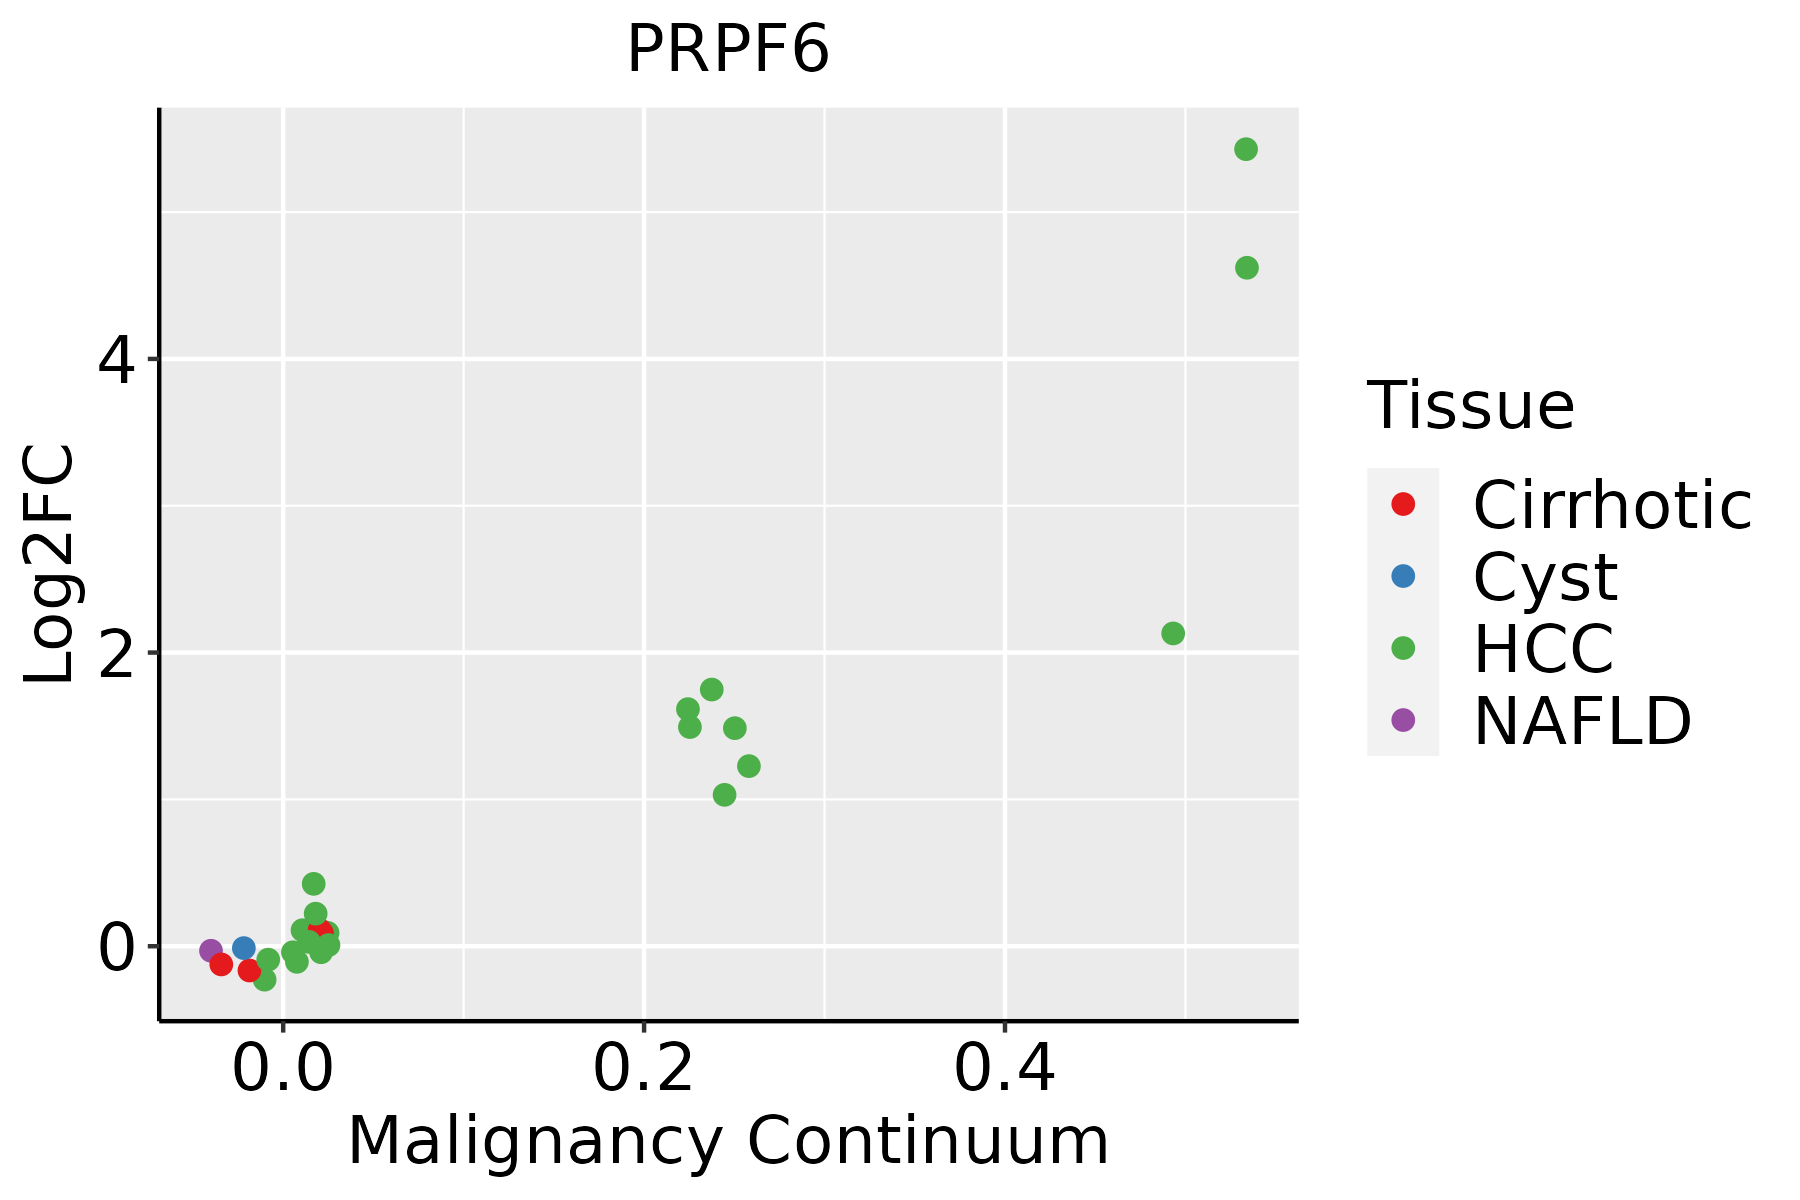 | HCC: Hepatocellular carcinoma |
| NAFLD: Non-alcoholic fatty liver disease | ||
| Lung |  | AAH: Atypical adenomatous hyperplasia |
| AIS: Adenocarcinoma in situ | ||
| IAC: Invasive lung adenocarcinoma | ||
| MIA: Minimally invasive adenocarcinoma | ||
| Oral Cavity | 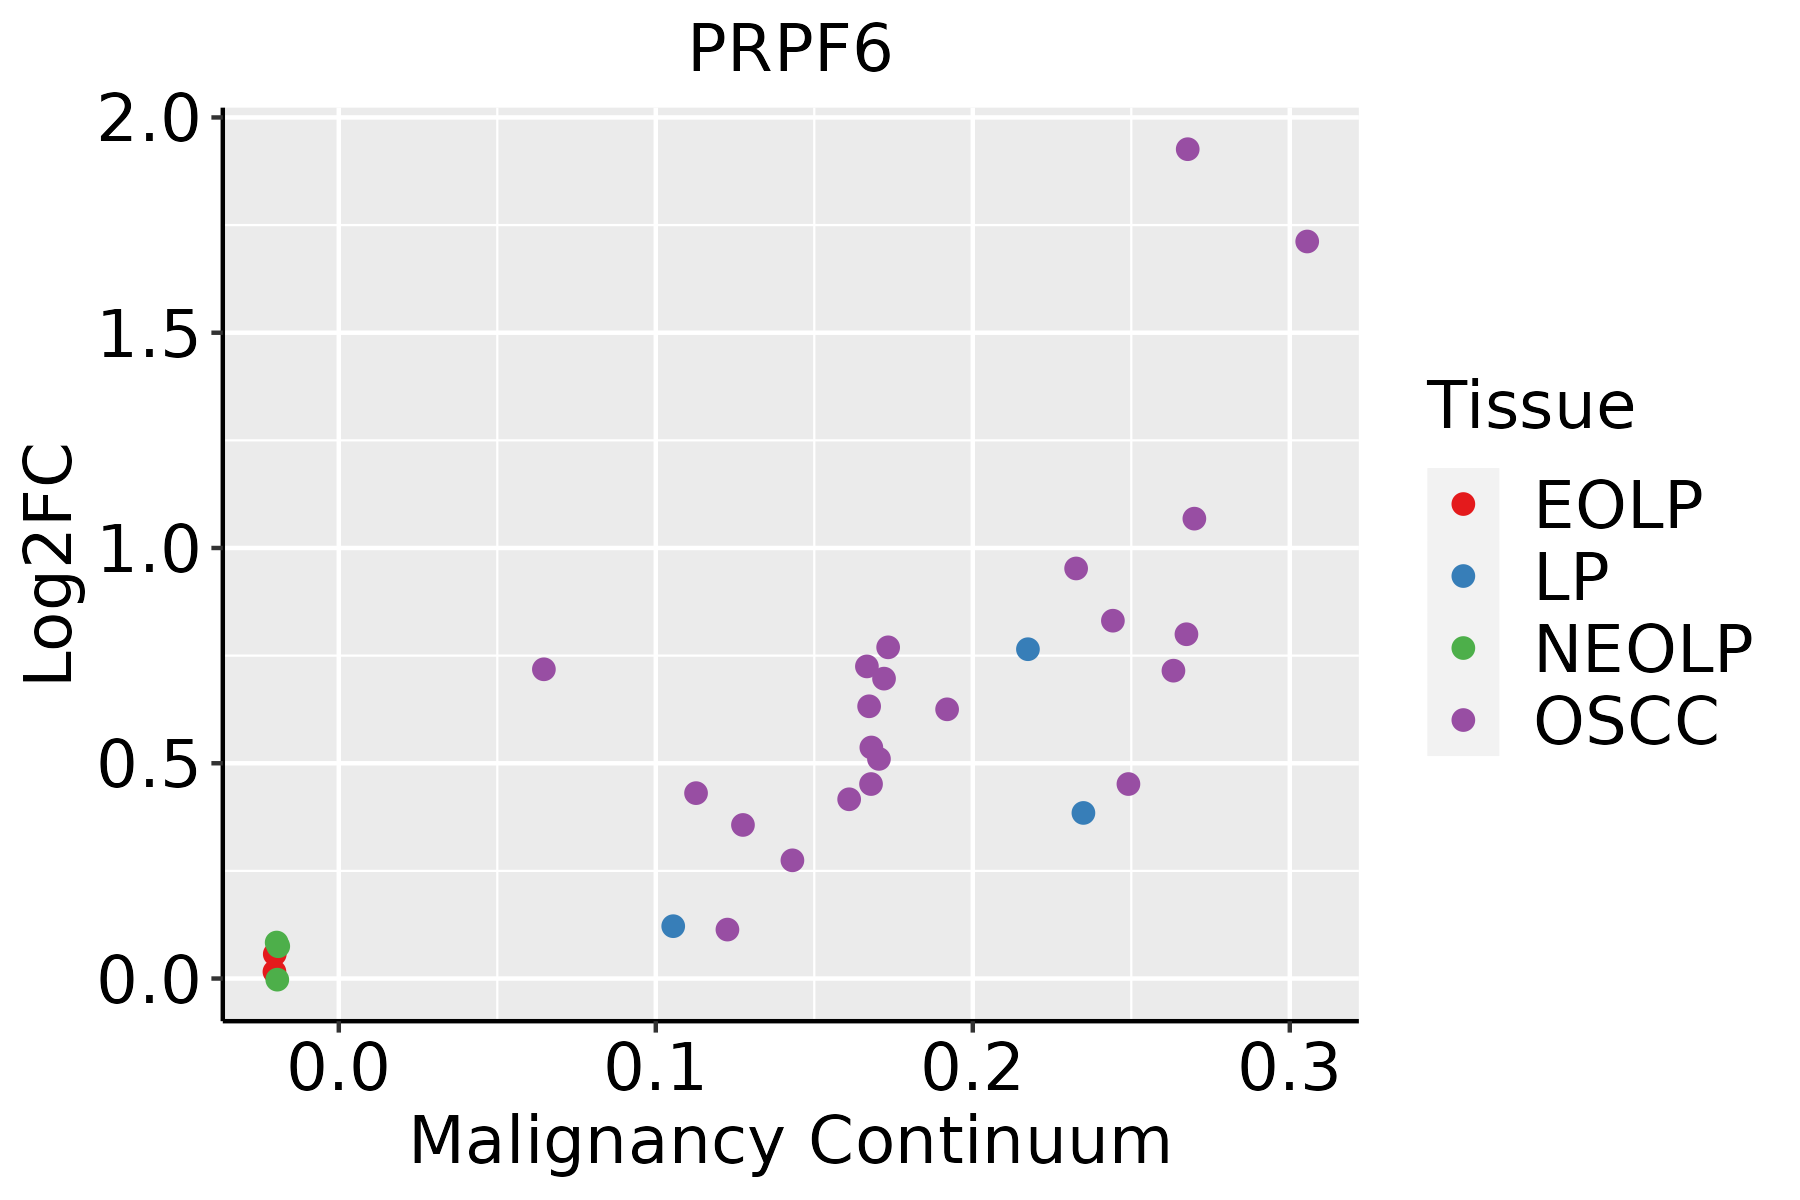 | EOLP: Erosive Oral lichen planus |
| LP: leukoplakia | ||
| NEOLP: Non-erosive oral lichen planus | ||
| OSCC: Oral squamous cell carcinoma | ||
| Prostate |  | BPH: Benign Prostatic Hyperplasia |
| Skin |  | AK: Actinic keratosis |
| cSCC: Cutaneous squamous cell carcinoma | ||
| SCCIS:squamous cell carcinoma in situ | ||
| Thyroid | 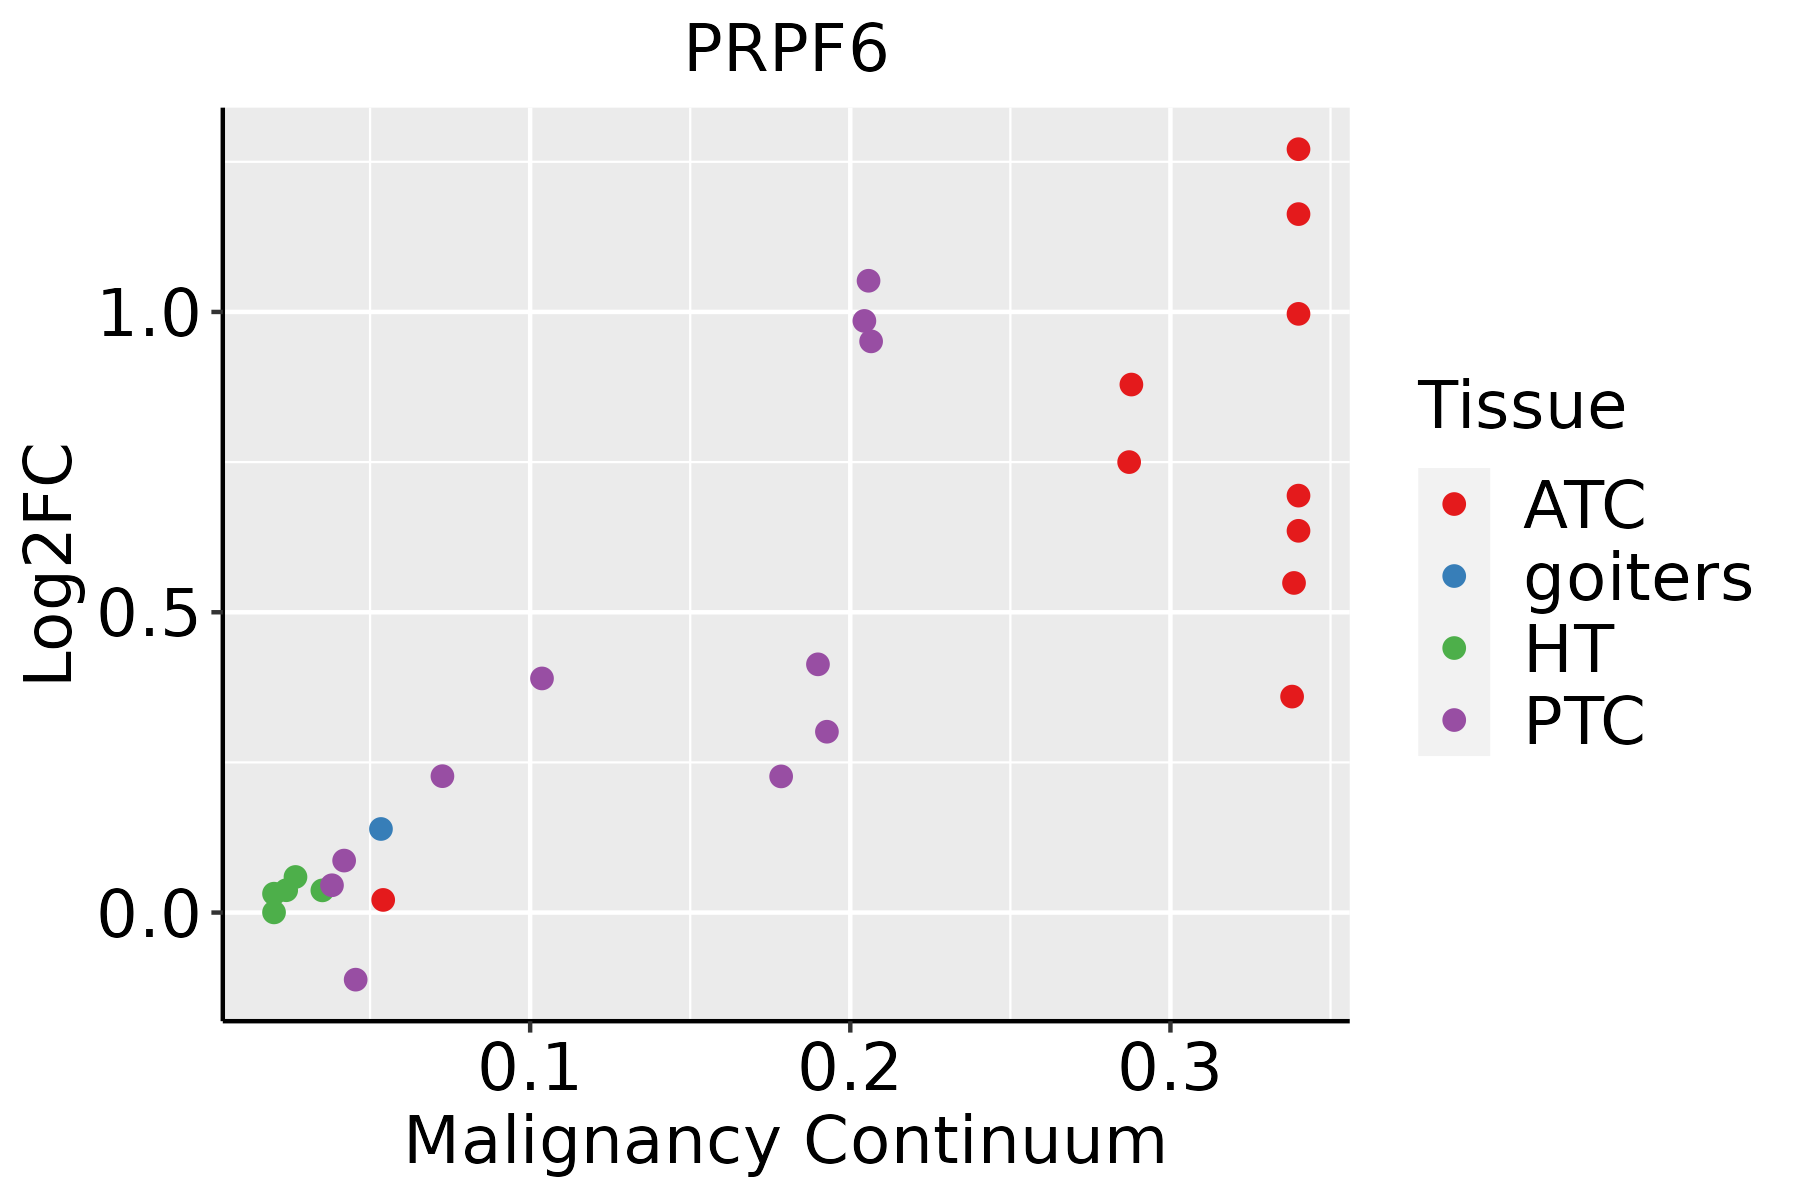 | ATC: Anaplastic thyroid cancer |
| HT: Hashimoto's thyroiditis | ||
| PTC: Papillary thyroid cancer |
| ∗log2FC in expression of this searched gene in stem-like cells from each diseased tissue sample relative to stem-like cells in normal samples in each tissue plotted against the malignancy continuum. Samples are colored based on if they are from different disease stage. |
Top |
Malignant transformation related pathway analysis |
| Find out the enriched GO biological processes and KEGG pathways involved in transition from healthy to precancer to cancer |
| Tissue | Disease Stage | Enriched GO biological Processes |
| Colorectum | AD |  |
| Colorectum | SER |  |
| Colorectum | MSS |  |
| Colorectum | MSI-H |  |
| Colorectum | FAP |  |
| ∗Top 15 enriched GO BP terms are showed in the bar plot of each disease state in each tissue. Each row represents a significant GO biological process which is colored according to the -log10(p.adjust). |
| Page: 1 2 3 4 5 6 7 8 9 |
| GO ID | Tissue | Disease Stage | Description | Gene Ratio | Bg Ratio | pvalue | p.adjust | Count |
| GO:002261314 | Breast | IDC | ribonucleoprotein complex biogenesis | 83/1434 | 463/18723 | 2.01e-13 | 5.20e-11 | 83 |
| GO:007182614 | Breast | IDC | ribonucleoprotein complex subunit organization | 52/1434 | 227/18723 | 5.18e-13 | 1.21e-10 | 52 |
| GO:002261814 | Breast | IDC | ribonucleoprotein complex assembly | 51/1434 | 220/18723 | 5.32e-13 | 1.21e-10 | 51 |
| GO:000838014 | Breast | IDC | RNA splicing | 73/1434 | 434/18723 | 1.27e-10 | 1.57e-08 | 73 |
| GO:000037514 | Breast | IDC | RNA splicing, via transesterification reactions | 58/1434 | 324/18723 | 9.44e-10 | 9.58e-08 | 58 |
| GO:000037714 | Breast | IDC | RNA splicing, via transesterification reactions with bulged adenosine as nucleophile | 57/1434 | 320/18723 | 1.60e-09 | 1.49e-07 | 57 |
| GO:000039814 | Breast | IDC | mRNA splicing, via spliceosome | 57/1434 | 320/18723 | 1.60e-09 | 1.49e-07 | 57 |
| GO:000038711 | Breast | IDC | spliceosomal snRNP assembly | 11/1434 | 50/18723 | 1.18e-03 | 1.28e-02 | 11 |
| GO:000640313 | Breast | IDC | RNA localization | 27/1434 | 201/18723 | 3.04e-03 | 2.60e-02 | 27 |
| GO:002261324 | Breast | DCIS | ribonucleoprotein complex biogenesis | 83/1390 | 463/18723 | 3.65e-14 | 1.09e-11 | 83 |
| GO:007182624 | Breast | DCIS | ribonucleoprotein complex subunit organization | 52/1390 | 227/18723 | 1.54e-13 | 3.95e-11 | 52 |
| GO:002261824 | Breast | DCIS | ribonucleoprotein complex assembly | 51/1390 | 220/18723 | 1.60e-13 | 3.95e-11 | 51 |
| GO:000838024 | Breast | DCIS | RNA splicing | 73/1390 | 434/18723 | 3.05e-11 | 5.08e-09 | 73 |
| GO:000037524 | Breast | DCIS | RNA splicing, via transesterification reactions | 58/1390 | 324/18723 | 2.89e-10 | 3.34e-08 | 58 |
| GO:000037724 | Breast | DCIS | RNA splicing, via transesterification reactions with bulged adenosine as nucleophile | 57/1390 | 320/18723 | 5.01e-10 | 5.35e-08 | 57 |
| GO:000039824 | Breast | DCIS | mRNA splicing, via spliceosome | 57/1390 | 320/18723 | 5.01e-10 | 5.35e-08 | 57 |
| GO:000038721 | Breast | DCIS | spliceosomal snRNP assembly | 11/1390 | 50/18723 | 9.14e-04 | 1.03e-02 | 11 |
| GO:000640322 | Breast | DCIS | RNA localization | 27/1390 | 201/18723 | 1.97e-03 | 1.84e-02 | 27 |
| GO:0008380 | Colorectum | AD | RNA splicing | 169/3918 | 434/18723 | 3.59e-18 | 2.04e-15 | 169 |
| GO:0000377 | Colorectum | AD | RNA splicing, via transesterification reactions with bulged adenosine as nucleophile | 130/3918 | 320/18723 | 5.88e-16 | 2.16e-13 | 130 |
| Page: 1 2 3 4 5 6 7 8 9 |
| Pathway ID | Tissue | Disease Stage | Description | Gene Ratio | Bg Ratio | pvalue | p.adjust | qvalue | Count |
| hsa0304043 | Breast | DCIS | Spliceosome | 40/846 | 217/8465 | 8.97e-05 | 8.52e-04 | 6.28e-04 | 40 |
| hsa0304053 | Breast | DCIS | Spliceosome | 40/846 | 217/8465 | 8.97e-05 | 8.52e-04 | 6.28e-04 | 40 |
| hsa03040 | Colorectum | AD | Spliceosome | 73/2092 | 217/8465 | 1.73e-03 | 9.68e-03 | 6.18e-03 | 73 |
| hsa030401 | Colorectum | AD | Spliceosome | 73/2092 | 217/8465 | 1.73e-03 | 9.68e-03 | 6.18e-03 | 73 |
| hsa030402 | Colorectum | MSS | Spliceosome | 66/1875 | 217/8465 | 2.58e-03 | 1.27e-02 | 7.81e-03 | 66 |
| hsa030403 | Colorectum | MSS | Spliceosome | 66/1875 | 217/8465 | 2.58e-03 | 1.27e-02 | 7.81e-03 | 66 |
| hsa0304018 | Esophagus | HGIN | Spliceosome | 79/1383 | 217/8465 | 3.22e-13 | 7.00e-12 | 5.56e-12 | 79 |
| hsa0304019 | Esophagus | HGIN | Spliceosome | 79/1383 | 217/8465 | 3.22e-13 | 7.00e-12 | 5.56e-12 | 79 |
| hsa0304027 | Esophagus | ESCC | Spliceosome | 128/4205 | 217/8465 | 3.31e-03 | 8.79e-03 | 4.50e-03 | 128 |
| hsa0304037 | Esophagus | ESCC | Spliceosome | 128/4205 | 217/8465 | 3.31e-03 | 8.79e-03 | 4.50e-03 | 128 |
| hsa030407 | Liver | Cirrhotic | Spliceosome | 102/2530 | 217/8465 | 5.69e-08 | 9.47e-07 | 5.84e-07 | 102 |
| hsa0304012 | Liver | Cirrhotic | Spliceosome | 102/2530 | 217/8465 | 5.69e-08 | 9.47e-07 | 5.84e-07 | 102 |
| hsa0304022 | Liver | HCC | Spliceosome | 122/4020 | 217/8465 | 5.55e-03 | 1.60e-02 | 8.91e-03 | 122 |
| hsa0304032 | Liver | HCC | Spliceosome | 122/4020 | 217/8465 | 5.55e-03 | 1.60e-02 | 8.91e-03 | 122 |
| hsa0304016 | Oral cavity | OSCC | Spliceosome | 123/3704 | 217/8465 | 7.21e-05 | 2.74e-04 | 1.40e-04 | 123 |
| hsa0304017 | Oral cavity | OSCC | Spliceosome | 123/3704 | 217/8465 | 7.21e-05 | 2.74e-04 | 1.40e-04 | 123 |
| hsa0304026 | Oral cavity | LP | Spliceosome | 106/2418 | 217/8465 | 1.30e-10 | 2.40e-09 | 1.55e-09 | 106 |
| hsa0304036 | Oral cavity | LP | Spliceosome | 106/2418 | 217/8465 | 1.30e-10 | 2.40e-09 | 1.55e-09 | 106 |
| hsa0304010 | Prostate | BPH | Spliceosome | 62/1718 | 217/8465 | 1.99e-03 | 7.92e-03 | 4.90e-03 | 62 |
| hsa0304015 | Prostate | BPH | Spliceosome | 62/1718 | 217/8465 | 1.99e-03 | 7.92e-03 | 4.90e-03 | 62 |
| Page: 1 2 |
Top |
Cell-cell communication analysis |
| Identification of potential cell-cell interactions between two cell types and their ligand-receptor pairs for different disease states |
| Ligand | Receptor | LRpair | Pathway | Tissue | Disease Stage |
| Page: 1 |
Top |
Single-cell gene regulatory network inference analysis |
| Find out the significant the regulons (TFs) and the target genes of each regulon across cell types for different disease states |
| TF | Cell Type | Tissue | Disease Stage | Target Gene | RSS | Regulon Activity |
| ∗The dot plots of a searched regulon are shown for all cell subpopulations in each disease state of each tissue based on the regulon specific score inferred using pySCENIC and by calculating the average expression. |
| Page: 1 |
Top |
Somatic mutation of malignant transformation related genes |
| Annotation of somatic variants for genes involved in malignant transformation |
| Hugo Symbol | Variant Class | Variant Classification | dbSNP RS | HGVSc | HGVSp | HGVSp Short | SWISSPROT | BIOTYPE | SIFT | PolyPhen | Tumor Sample Barcode | Tissue | Histology | Sex | Age | Stage | Therapy Types | Drugs | Outcome |
| PRPF6 | SNV | Missense_Mutation | c.1817N>G | p.Lys606Arg | p.K606R | O94906 | protein_coding | tolerated(0.16) | benign(0.03) | TCGA-A8-A08S-01 | Breast | breast invasive carcinoma | Female | >=65 | I/II | Hormone Therapy | anastrozole | SD | |
| PRPF6 | SNV | Missense_Mutation | rs756373021 | c.1913N>G | p.Asn638Ser | p.N638S | O94906 | protein_coding | deleterious(0.04) | possibly_damaging(0.593) | TCGA-AQ-A1H2-01 | Breast | breast invasive carcinoma | Female | >=65 | III/IV | Chemotherapy | herceptin | SD |
| PRPF6 | SNV | Missense_Mutation | novel | c.2668A>C | p.Thr890Pro | p.T890P | O94906 | protein_coding | deleterious(0.01) | possibly_damaging(0.828) | TCGA-BH-A0HW-01 | Breast | breast invasive carcinoma | Female | <65 | I/II | Chemotherapy | doxorubicin | SD |
| PRPF6 | SNV | Missense_Mutation | c.2411N>A | p.Leu804Gln | p.L804Q | O94906 | protein_coding | deleterious(0) | probably_damaging(0.954) | TCGA-D8-A1XK-01 | Breast | breast invasive carcinoma | Female | <65 | I/II | Chemotherapy | doxorubicine+cyclophosphamide | SD | |
| PRPF6 | SNV | Missense_Mutation | c.701G>A | p.Gly234Asp | p.G234D | O94906 | protein_coding | tolerated(0.24) | benign(0) | TCGA-E9-A1RF-01 | Breast | breast invasive carcinoma | Female | >=65 | III/IV | Hormone Therapy | tamoxiphen | SD | |
| PRPF6 | SNV | Missense_Mutation | c.349A>C | p.Lys117Gln | p.K117Q | O94906 | protein_coding | tolerated(0.05) | possibly_damaging(0.745) | TCGA-EW-A1PB-01 | Breast | breast invasive carcinoma | Female | >=65 | III/IV | Unknown | Unknown | SD | |
| PRPF6 | SNV | Missense_Mutation | c.902T>A | p.Val301Asp | p.V301D | O94906 | protein_coding | deleterious(0) | probably_damaging(0.926) | TCGA-GM-A2DB-01 | Breast | breast invasive carcinoma | Female | <65 | I/II | Chemotherapy | taxol | CR | |
| PRPF6 | insertion | Frame_Shift_Ins | novel | c.2009_2010insAGCTGCCTGTTTGAGATGGCAT | p.Ser670ArgfsTer44 | p.S670Rfs*44 | O94906 | protein_coding | TCGA-AO-A03R-01 | Breast | breast invasive carcinoma | Female | <65 | I/II | Chemotherapy | doxorubicin | SD | ||
| PRPF6 | insertion | In_Frame_Ins | novel | c.2670_2671insCTCATAGCATGGACCTCTTCG | p.Thr890_Glu891insLeuIleAlaTrpThrSerSer | p.T890_E891insLIAWTSS | O94906 | protein_coding | TCGA-BH-A0HW-01 | Breast | breast invasive carcinoma | Female | <65 | I/II | Chemotherapy | doxorubicin | SD | ||
| PRPF6 | deletion | Frame_Shift_Del | novel | c.2006delN | p.Ser670AlafsTer10 | p.S670Afs*10 | O94906 | protein_coding | TCGA-D8-A27V-01 | Breast | breast invasive carcinoma | Female | <65 | I/II | Hormone Therapy | tamoxiphen | SD |
| Page: 1 2 3 4 5 6 7 8 9 10 11 |
Top |
Related drugs of malignant transformation related genes |
| Identification of chemicals and drugs interact with genes involved in malignant transfromation |
| (DGIdb 4.0) |
| Entrez ID | Symbol | Category | Interaction Types | Drug Claim Name | Drug Name | PMIDs |
| Page: 1 |

Copyright 2023-Present -The University of Texas Health Science Center at Houston |