
|
|||||
|
 | |
| |
| |
| |
| |
| |
|
Gene: PRPF4 |
Gene summary for PRPF4 |
| Gene information | Species | Human | Gene symbol | PRPF4 | Gene ID | 9128 |
| Gene name | pre-mRNA processing factor 4 | |
| Gene Alias | HPRP4 | |
| Cytomap | 9q32 | |
| Gene Type | protein-coding | GO ID | GO:0000375 | UniProtAcc | O43172 |
Top |
Malignant transformation analysis |
| Identification of the aberrant gene expression in precancerous and cancerous lesions by comparing the gene expression of stem-like cells in diseased tissues with normal stem cells |
| Entrez ID | Symbol | Replicates | Species | Organ | Tissue | Adj P-value | Log2FC | Malignancy |
| 9128 | PRPF4 | LZE2T | Human | Esophagus | ESCC | 6.88e-04 | 2.61e-01 | 0.082 |
| 9128 | PRPF4 | LZE4T | Human | Esophagus | ESCC | 9.84e-12 | 4.21e-01 | 0.0811 |
| 9128 | PRPF4 | LZE7T | Human | Esophagus | ESCC | 2.28e-08 | 4.77e-01 | 0.0667 |
| 9128 | PRPF4 | LZE8T | Human | Esophagus | ESCC | 1.71e-07 | 9.92e-02 | 0.067 |
| 9128 | PRPF4 | LZE20T | Human | Esophagus | ESCC | 4.18e-07 | 2.79e-01 | 0.0662 |
| 9128 | PRPF4 | LZE24T | Human | Esophagus | ESCC | 9.97e-10 | 2.35e-01 | 0.0596 |
| 9128 | PRPF4 | LZE21T | Human | Esophagus | ESCC | 3.33e-05 | 2.21e-01 | 0.0655 |
| 9128 | PRPF4 | P1T-E | Human | Esophagus | ESCC | 1.37e-12 | 3.30e-01 | 0.0875 |
| 9128 | PRPF4 | P2T-E | Human | Esophagus | ESCC | 1.61e-34 | 6.05e-01 | 0.1177 |
| 9128 | PRPF4 | P4T-E | Human | Esophagus | ESCC | 1.72e-21 | 4.89e-01 | 0.1323 |
| 9128 | PRPF4 | P5T-E | Human | Esophagus | ESCC | 5.92e-25 | 5.61e-01 | 0.1327 |
| 9128 | PRPF4 | P8T-E | Human | Esophagus | ESCC | 1.93e-12 | 1.43e-01 | 0.0889 |
| 9128 | PRPF4 | P9T-E | Human | Esophagus | ESCC | 1.35e-11 | 3.29e-01 | 0.1131 |
| 9128 | PRPF4 | P10T-E | Human | Esophagus | ESCC | 4.77e-36 | 7.65e-01 | 0.116 |
| 9128 | PRPF4 | P11T-E | Human | Esophagus | ESCC | 3.11e-03 | 3.52e-01 | 0.1426 |
| 9128 | PRPF4 | P12T-E | Human | Esophagus | ESCC | 2.41e-24 | 6.94e-01 | 0.1122 |
| 9128 | PRPF4 | P15T-E | Human | Esophagus | ESCC | 3.30e-31 | 1.04e+00 | 0.1149 |
| 9128 | PRPF4 | P16T-E | Human | Esophagus | ESCC | 1.51e-18 | 2.89e-01 | 0.1153 |
| 9128 | PRPF4 | P17T-E | Human | Esophagus | ESCC | 2.64e-02 | 3.28e-01 | 0.1278 |
| 9128 | PRPF4 | P20T-E | Human | Esophagus | ESCC | 2.99e-09 | 1.78e-01 | 0.1124 |
| Page: 1 2 3 4 5 6 |
| Tissue | Expression Dynamics | Abbreviation |
| Esophagus |  | ESCC: Esophageal squamous cell carcinoma |
| HGIN: High-grade intraepithelial neoplasias | ||
| LGIN: Low-grade intraepithelial neoplasias | ||
| Liver | 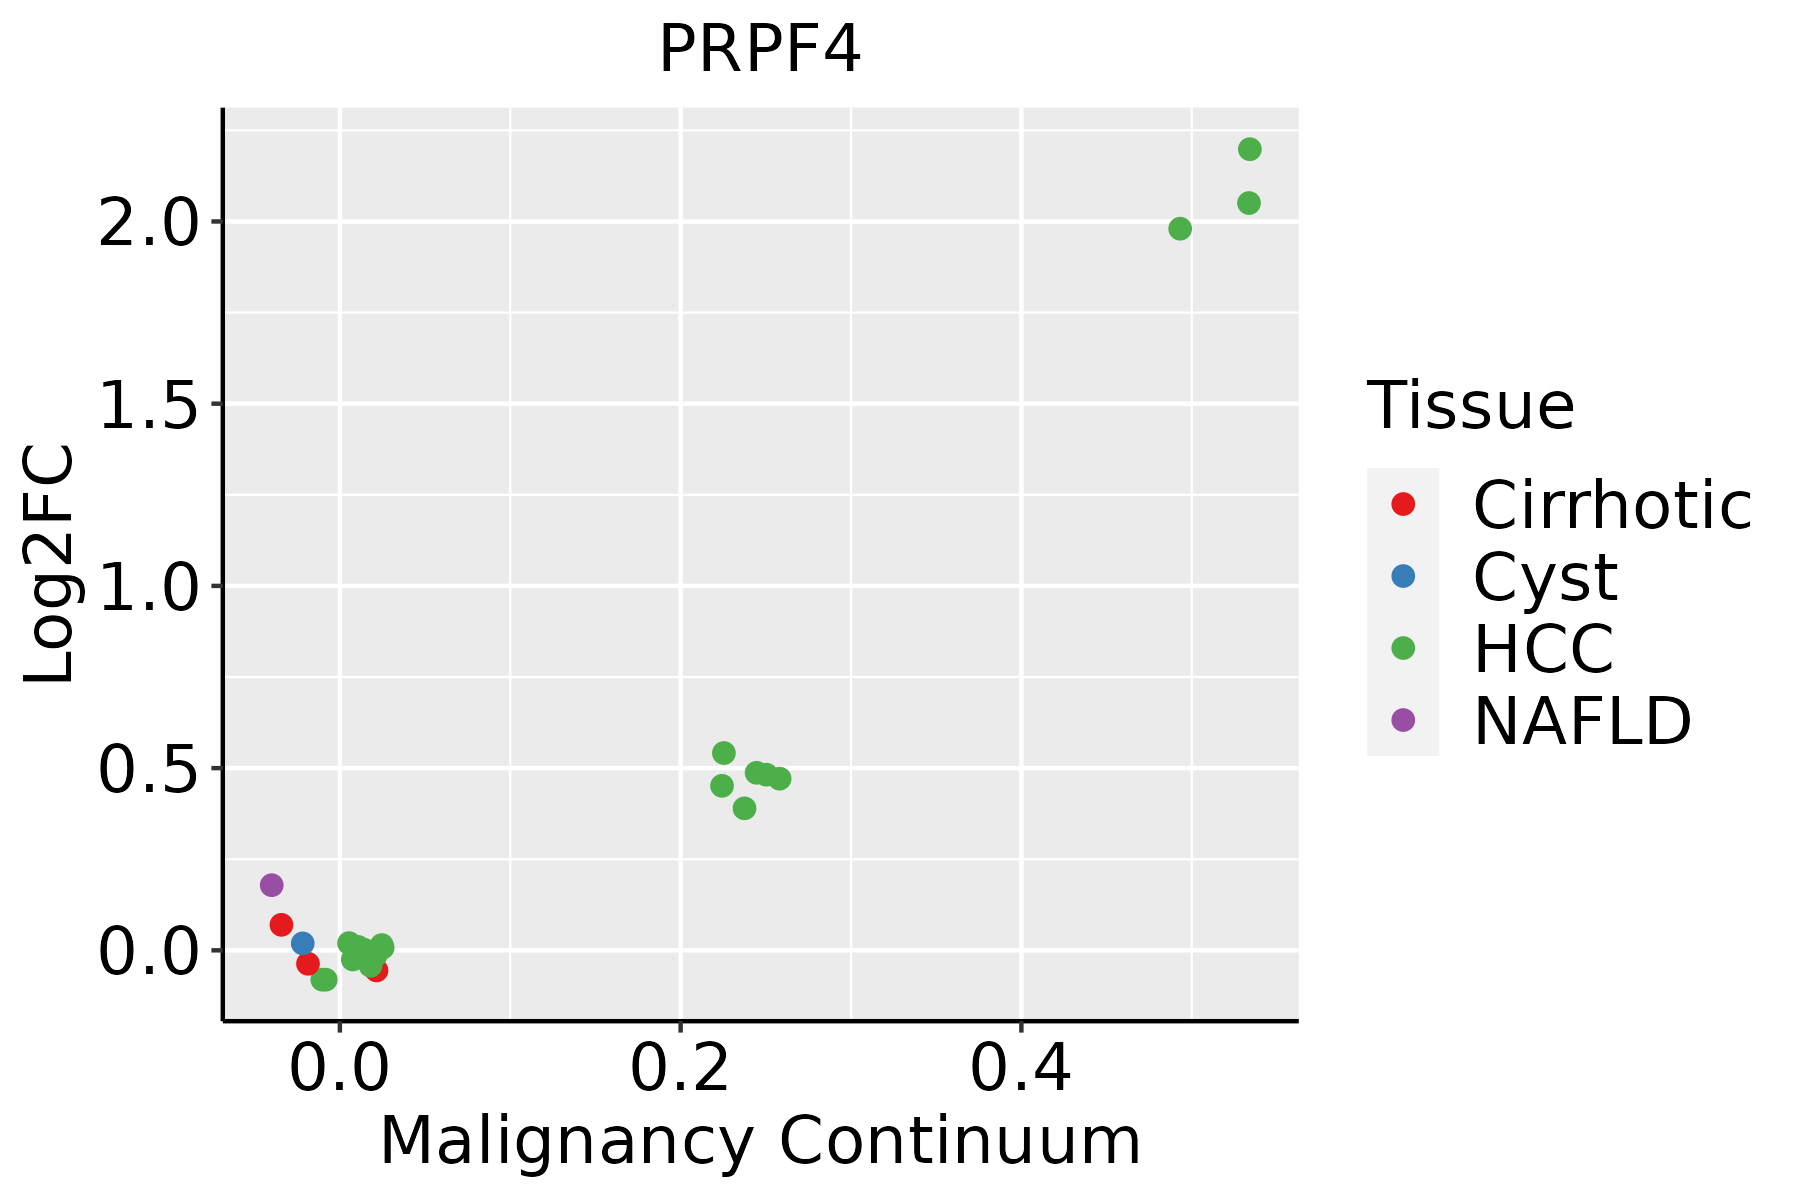 | HCC: Hepatocellular carcinoma |
| NAFLD: Non-alcoholic fatty liver disease | ||
| Oral Cavity |  | EOLP: Erosive Oral lichen planus |
| LP: leukoplakia | ||
| NEOLP: Non-erosive oral lichen planus | ||
| OSCC: Oral squamous cell carcinoma | ||
| Skin | 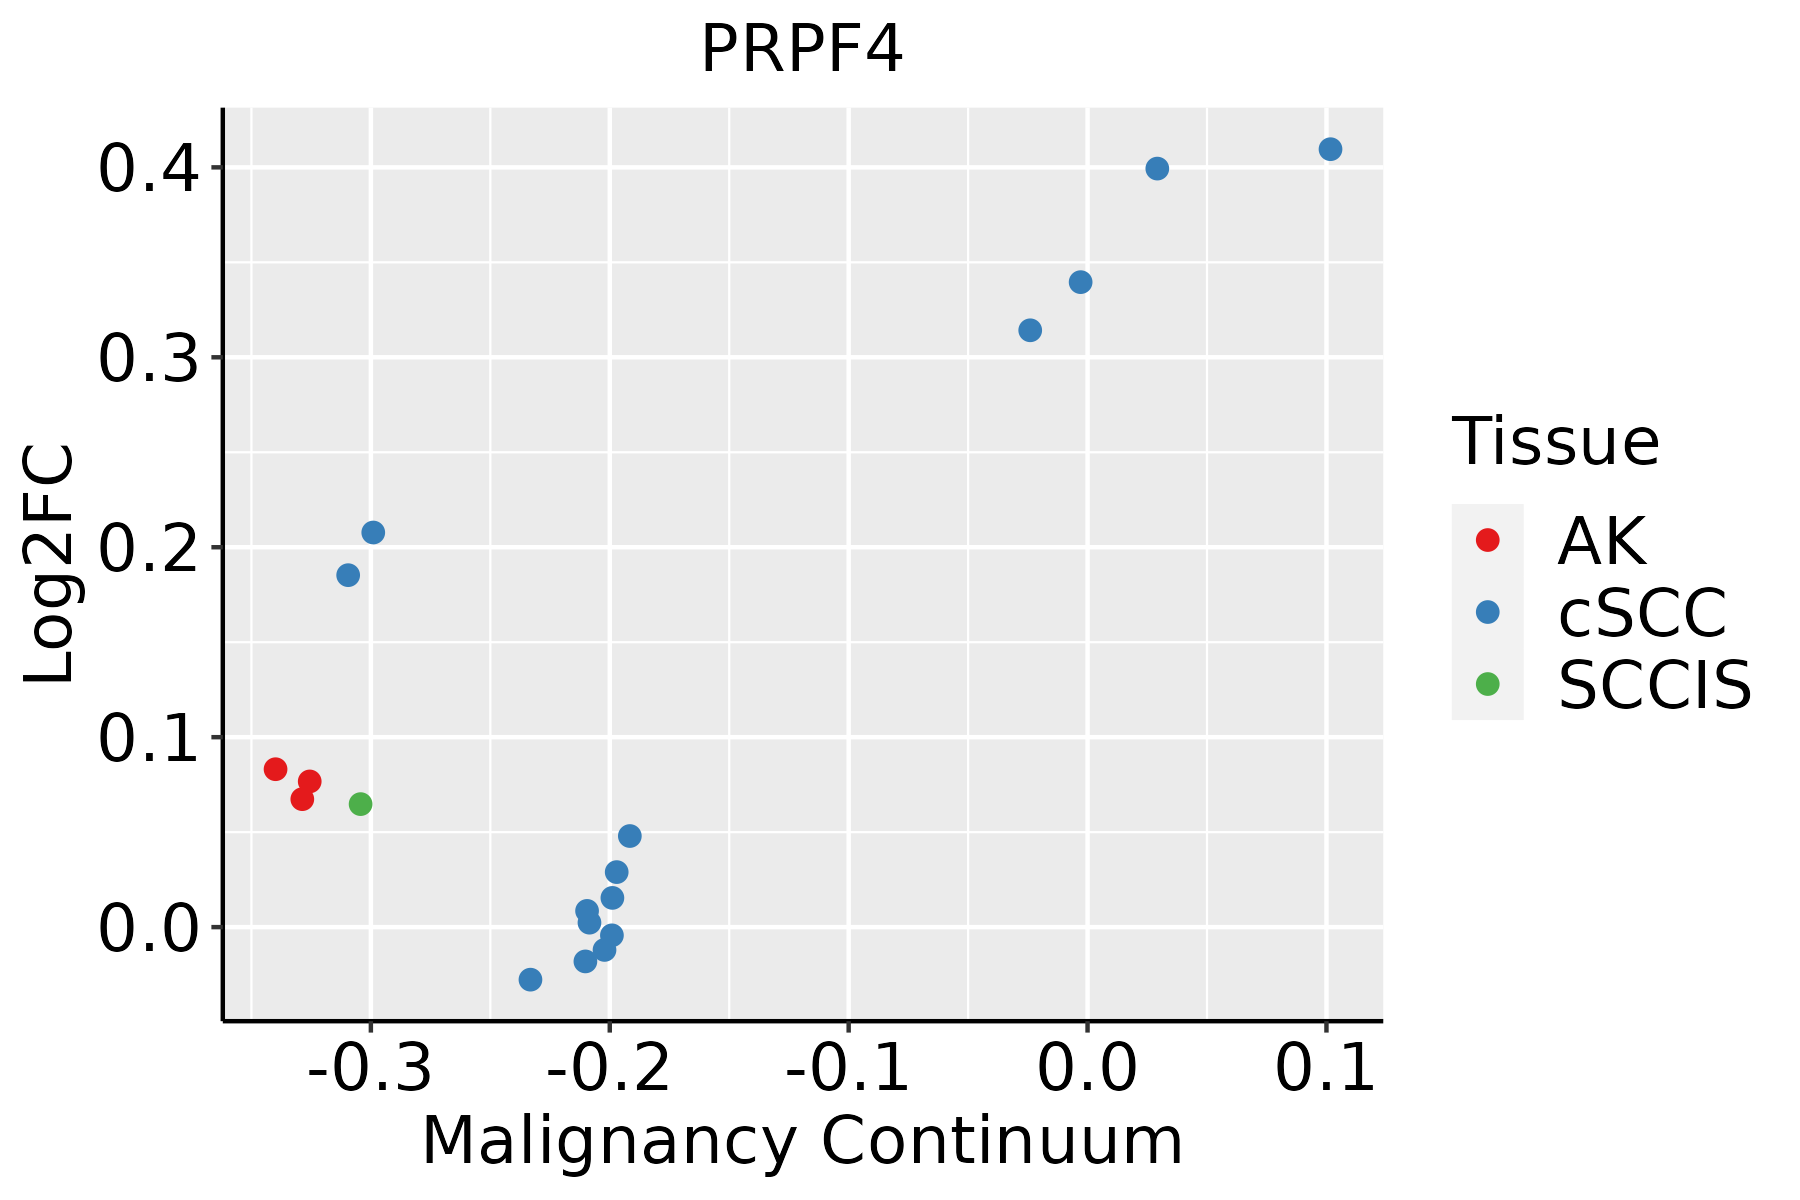 | AK: Actinic keratosis |
| cSCC: Cutaneous squamous cell carcinoma | ||
| SCCIS:squamous cell carcinoma in situ | ||
| Thyroid | 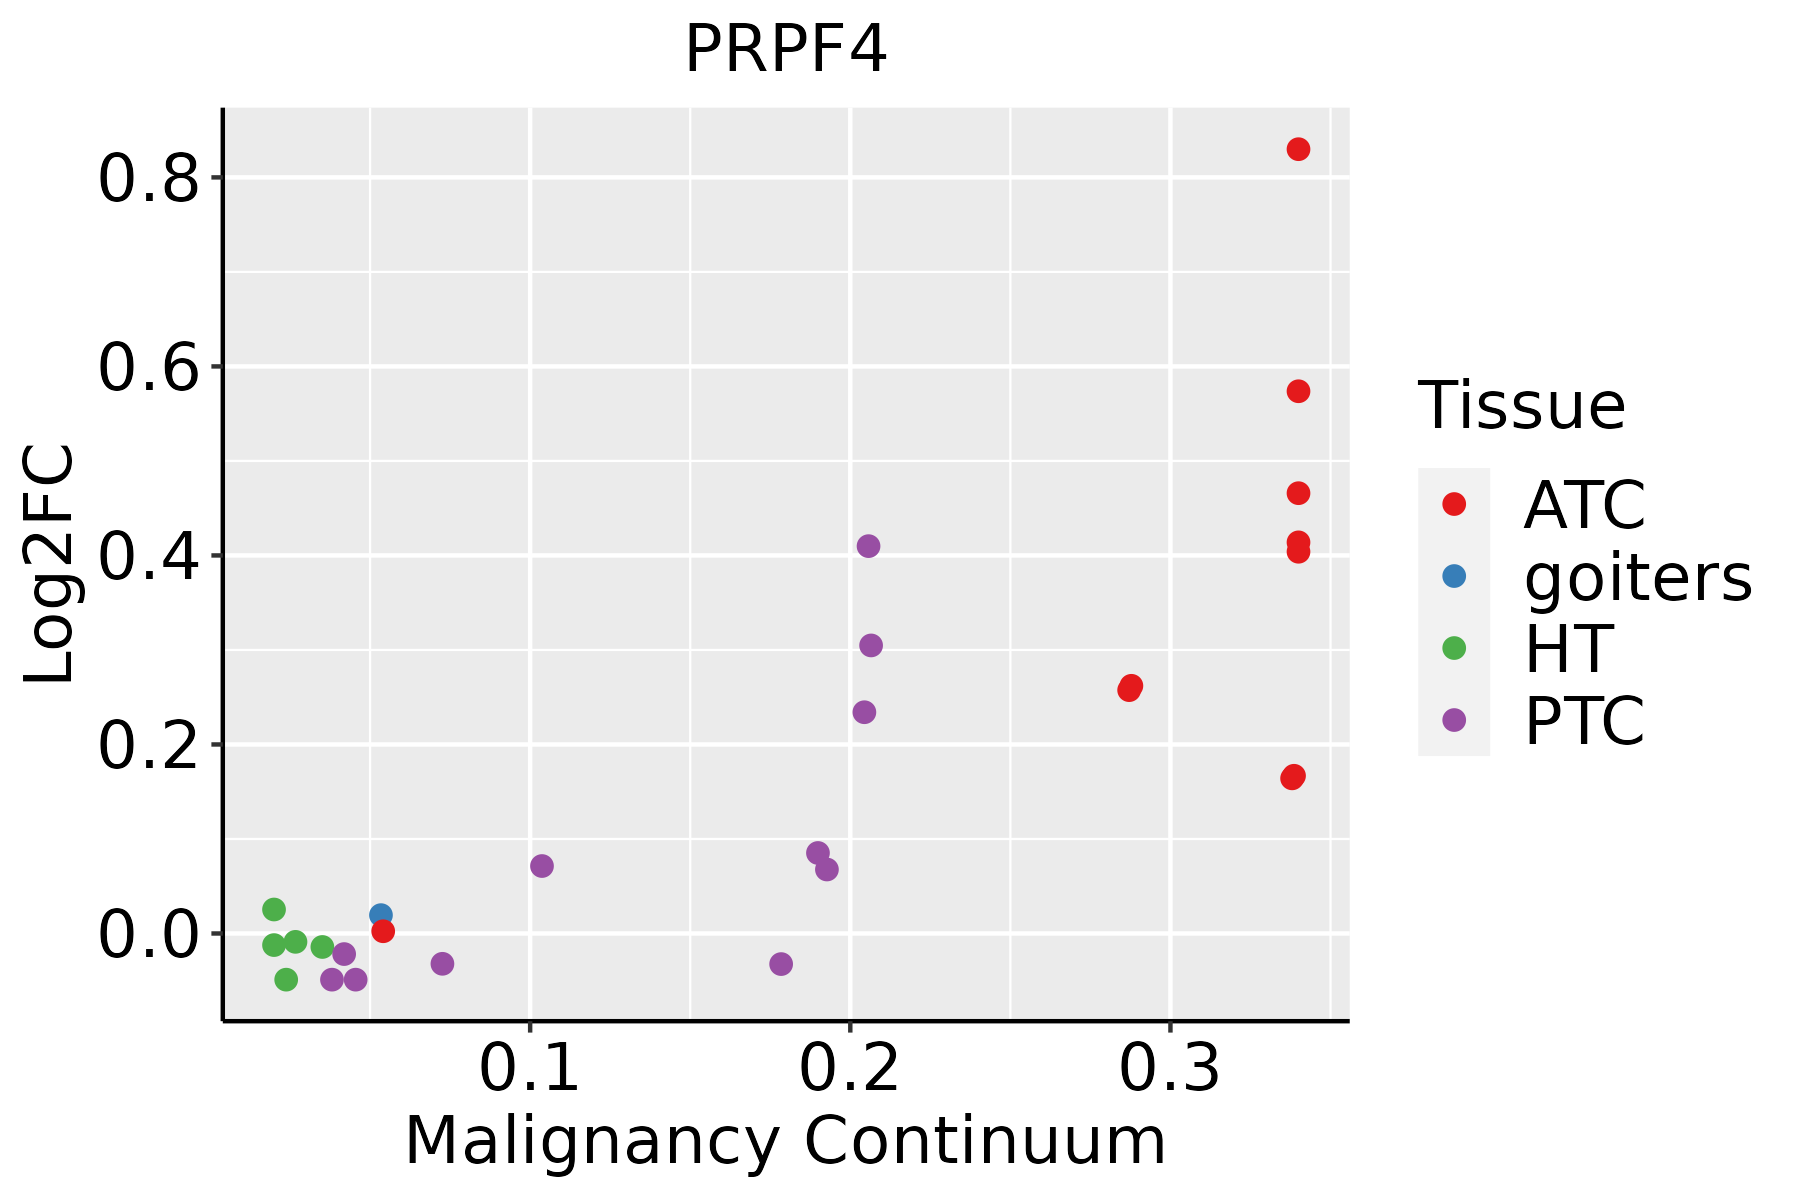 | ATC: Anaplastic thyroid cancer |
| HT: Hashimoto's thyroiditis | ||
| PTC: Papillary thyroid cancer |
| ∗log2FC in expression of this searched gene in stem-like cells from each diseased tissue sample relative to stem-like cells in normal samples in each tissue plotted against the malignancy continuum. Samples are colored based on if they are from different disease stage. |
Top |
Malignant transformation related pathway analysis |
| Find out the enriched GO biological processes and KEGG pathways involved in transition from healthy to precancer to cancer |
| Tissue | Disease Stage | Enriched GO biological Processes |
| Colorectum | AD |  |
| Colorectum | SER |  |
| Colorectum | MSS |  |
| Colorectum | MSI-H |  |
| Colorectum | FAP |  |
| ∗Top 15 enriched GO BP terms are showed in the bar plot of each disease state in each tissue. Each row represents a significant GO biological process which is colored according to the -log10(p.adjust). |
| Page: 1 2 3 4 5 6 7 8 9 |
| GO ID | Tissue | Disease Stage | Description | Gene Ratio | Bg Ratio | pvalue | p.adjust | Count |
| GO:00083809 | Breast | Precancer | RNA splicing | 65/1080 | 434/18723 | 1.27e-12 | 2.53e-10 | 65 |
| GO:00003759 | Breast | Precancer | RNA splicing, via transesterification reactions | 52/1080 | 324/18723 | 1.74e-11 | 2.22e-09 | 52 |
| GO:00003779 | Breast | Precancer | RNA splicing, via transesterification reactions with bulged adenosine as nucleophile | 51/1080 | 320/18723 | 3.55e-11 | 4.04e-09 | 51 |
| GO:00003989 | Breast | Precancer | mRNA splicing, via spliceosome | 51/1080 | 320/18723 | 3.55e-11 | 4.04e-09 | 51 |
| GO:00226049 | Breast | Precancer | regulation of cell morphogenesis | 29/1080 | 309/18723 | 6.88e-03 | 4.67e-02 | 29 |
| GO:000838014 | Breast | IDC | RNA splicing | 73/1434 | 434/18723 | 1.27e-10 | 1.57e-08 | 73 |
| GO:000037514 | Breast | IDC | RNA splicing, via transesterification reactions | 58/1434 | 324/18723 | 9.44e-10 | 9.58e-08 | 58 |
| GO:000037714 | Breast | IDC | RNA splicing, via transesterification reactions with bulged adenosine as nucleophile | 57/1434 | 320/18723 | 1.60e-09 | 1.49e-07 | 57 |
| GO:000039814 | Breast | IDC | mRNA splicing, via spliceosome | 57/1434 | 320/18723 | 1.60e-09 | 1.49e-07 | 57 |
| GO:000838024 | Breast | DCIS | RNA splicing | 73/1390 | 434/18723 | 3.05e-11 | 5.08e-09 | 73 |
| GO:000037524 | Breast | DCIS | RNA splicing, via transesterification reactions | 58/1390 | 324/18723 | 2.89e-10 | 3.34e-08 | 58 |
| GO:000037724 | Breast | DCIS | RNA splicing, via transesterification reactions with bulged adenosine as nucleophile | 57/1390 | 320/18723 | 5.01e-10 | 5.35e-08 | 57 |
| GO:000039824 | Breast | DCIS | mRNA splicing, via spliceosome | 57/1390 | 320/18723 | 5.01e-10 | 5.35e-08 | 57 |
| GO:000838010 | Cervix | CC | RNA splicing | 76/2311 | 434/18723 | 9.79e-04 | 8.19e-03 | 76 |
| GO:000037710 | Cervix | CC | RNA splicing, via transesterification reactions with bulged adenosine as nucleophile | 55/2311 | 320/18723 | 6.71e-03 | 3.70e-02 | 55 |
| GO:000039810 | Cervix | CC | mRNA splicing, via spliceosome | 55/2311 | 320/18723 | 6.71e-03 | 3.70e-02 | 55 |
| GO:000037510 | Cervix | CC | RNA splicing, via transesterification reactions | 55/2311 | 324/18723 | 8.61e-03 | 4.44e-02 | 55 |
| GO:0008380 | Colorectum | AD | RNA splicing | 169/3918 | 434/18723 | 3.59e-18 | 2.04e-15 | 169 |
| GO:0000377 | Colorectum | AD | RNA splicing, via transesterification reactions with bulged adenosine as nucleophile | 130/3918 | 320/18723 | 5.88e-16 | 2.16e-13 | 130 |
| GO:0000398 | Colorectum | AD | mRNA splicing, via spliceosome | 130/3918 | 320/18723 | 5.88e-16 | 2.16e-13 | 130 |
| Page: 1 2 3 4 5 6 7 8 9 |
| Pathway ID | Tissue | Disease Stage | Description | Gene Ratio | Bg Ratio | pvalue | p.adjust | qvalue | Count |
| hsa0304027 | Esophagus | ESCC | Spliceosome | 128/4205 | 217/8465 | 3.31e-03 | 8.79e-03 | 4.50e-03 | 128 |
| hsa0304037 | Esophagus | ESCC | Spliceosome | 128/4205 | 217/8465 | 3.31e-03 | 8.79e-03 | 4.50e-03 | 128 |
| hsa0304022 | Liver | HCC | Spliceosome | 122/4020 | 217/8465 | 5.55e-03 | 1.60e-02 | 8.91e-03 | 122 |
| hsa0304032 | Liver | HCC | Spliceosome | 122/4020 | 217/8465 | 5.55e-03 | 1.60e-02 | 8.91e-03 | 122 |
| hsa0304016 | Oral cavity | OSCC | Spliceosome | 123/3704 | 217/8465 | 7.21e-05 | 2.74e-04 | 1.40e-04 | 123 |
| hsa0304017 | Oral cavity | OSCC | Spliceosome | 123/3704 | 217/8465 | 7.21e-05 | 2.74e-04 | 1.40e-04 | 123 |
| hsa0304026 | Oral cavity | LP | Spliceosome | 106/2418 | 217/8465 | 1.30e-10 | 2.40e-09 | 1.55e-09 | 106 |
| hsa0304036 | Oral cavity | LP | Spliceosome | 106/2418 | 217/8465 | 1.30e-10 | 2.40e-09 | 1.55e-09 | 106 |
| Page: 1 |
Top |
Cell-cell communication analysis |
| Identification of potential cell-cell interactions between two cell types and their ligand-receptor pairs for different disease states |
| Ligand | Receptor | LRpair | Pathway | Tissue | Disease Stage |
| Page: 1 |
Top |
Single-cell gene regulatory network inference analysis |
| Find out the significant the regulons (TFs) and the target genes of each regulon across cell types for different disease states |
| TF | Cell Type | Tissue | Disease Stage | Target Gene | RSS | Regulon Activity |
| ∗The dot plots of a searched regulon are shown for all cell subpopulations in each disease state of each tissue based on the regulon specific score inferred using pySCENIC and by calculating the average expression. |
| Page: 1 |
Top |
Somatic mutation of malignant transformation related genes |
| Annotation of somatic variants for genes involved in malignant transformation |
| Hugo Symbol | Variant Class | Variant Classification | dbSNP RS | HGVSc | HGVSp | HGVSp Short | SWISSPROT | BIOTYPE | SIFT | PolyPhen | Tumor Sample Barcode | Tissue | Histology | Sex | Age | Stage | Therapy Types | Drugs | Outcome |
| PRPF4 | SNV | Missense_Mutation | c.1270N>C | p.Thr424Pro | p.T424P | O43172 | protein_coding | deleterious(0) | probably_damaging(0.999) | TCGA-AR-A256-01 | Breast | breast invasive carcinoma | Female | <65 | I/II | Chemotherapy | doxorubicin | PD | |
| PRPF4 | SNV | Missense_Mutation | novel | c.250N>T | p.Ala84Ser | p.A84S | O43172 | protein_coding | tolerated(0.66) | benign(0.017) | TCGA-D8-A1X5-01 | Breast | breast invasive carcinoma | Female | >=65 | III/IV | Hormone Therapy | tamoxiphen | SD |
| PRPF4 | SNV | Missense_Mutation | c.1542G>C | p.Arg514Ser | p.R514S | O43172 | protein_coding | deleterious(0) | probably_damaging(0.998) | TCGA-D8-A1XL-01 | Breast | breast invasive carcinoma | Female | <65 | I/II | Chemotherapy | doxorubicine+cyclophosphamide+tamoxifen | SD | |
| PRPF4 | insertion | Nonsense_Mutation | novel | c.1433_1434insAGTGGAGGAAGAAAGAAGGTAACAGA | p.His479ValfsTer7 | p.H479Vfs*7 | O43172 | protein_coding | TCGA-A8-A083-01 | Breast | breast invasive carcinoma | Female | >=65 | I/II | Unknown | Unknown | SD | ||
| PRPF4 | SNV | Missense_Mutation | rs575911571 | c.899N>T | p.Ala300Val | p.A300V | O43172 | protein_coding | deleterious(0.01) | possibly_damaging(0.849) | TCGA-2W-A8YY-01 | Cervix | cervical & endocervical cancer | Female | <65 | I/II | Chemotherapy | cisplatin | CR |
| PRPF4 | SNV | Missense_Mutation | novel | c.1043N>A | p.Arg348His | p.R348H | O43172 | protein_coding | deleterious(0.04) | probably_damaging(1) | TCGA-2W-A8YY-01 | Cervix | cervical & endocervical cancer | Female | <65 | I/II | Chemotherapy | cisplatin | CR |
| PRPF4 | SNV | Missense_Mutation | c.206C>T | p.Ser69Phe | p.S69F | O43172 | protein_coding | deleterious(0.05) | possibly_damaging(0.472) | TCGA-FU-A5XV-01 | Cervix | cervical & endocervical cancer | Female | <65 | III/IV | Unknown | Unknown | SD | |
| PRPF4 | SNV | Missense_Mutation | c.391G>C | p.Glu131Gln | p.E131Q | O43172 | protein_coding | tolerated(0.06) | possibly_damaging(0.903) | TCGA-Q1-A73O-01 | Cervix | cervical & endocervical cancer | Female | <65 | I/II | Chemotherapy | cisplatin | CR | |
| PRPF4 | SNV | Missense_Mutation | c.809G>A | p.Arg270Gln | p.R270Q | O43172 | protein_coding | tolerated(0.05) | possibly_damaging(0.462) | TCGA-Q1-A73O-01 | Cervix | cervical & endocervical cancer | Female | <65 | I/II | Chemotherapy | cisplatin | CR | |
| PRPF4 | SNV | Missense_Mutation | rs373783471 | c.980N>T | p.Ala327Val | p.A327V | O43172 | protein_coding | deleterious(0.01) | possibly_damaging(0.714) | TCGA-VS-A9UI-01 | Cervix | cervical & endocervical cancer | Female | >=65 | I/II | Unknown | Unknown | SD |
| Page: 1 2 3 4 5 |
Top |
Related drugs of malignant transformation related genes |
| Identification of chemicals and drugs interact with genes involved in malignant transfromation |
| (DGIdb 4.0) |
| Entrez ID | Symbol | Category | Interaction Types | Drug Claim Name | Drug Name | PMIDs |
| Page: 1 |

Copyright 2023-Present -The University of Texas Health Science Center at Houston |