
|
|||||
|
 | |
| |
| |
| |
| |
| |
|
Gene: PRPF39 |
Gene summary for PRPF39 |
| Gene information | Species | Human | Gene symbol | PRPF39 | Gene ID | 55015 |
| Gene name | pre-mRNA processing factor 39 | |
| Gene Alias | PRPF39 | |
| Cytomap | 14q21.2 | |
| Gene Type | protein-coding | GO ID | GO:0000245 | UniProtAcc | Q86UA1 |
Top |
Malignant transformation analysis |
| Identification of the aberrant gene expression in precancerous and cancerous lesions by comparing the gene expression of stem-like cells in diseased tissues with normal stem cells |
| Entrez ID | Symbol | Replicates | Species | Organ | Tissue | Adj P-value | Log2FC | Malignancy |
| 55015 | PRPF39 | LZE4T | Human | Esophagus | ESCC | 2.67e-05 | 2.20e-01 | 0.0811 |
| 55015 | PRPF39 | LZE5T | Human | Esophagus | ESCC | 2.51e-04 | 2.39e-01 | 0.0514 |
| 55015 | PRPF39 | LZE24T | Human | Esophagus | ESCC | 3.48e-06 | 1.91e-01 | 0.0596 |
| 55015 | PRPF39 | P2T-E | Human | Esophagus | ESCC | 3.11e-24 | 3.72e-01 | 0.1177 |
| 55015 | PRPF39 | P4T-E | Human | Esophagus | ESCC | 1.51e-13 | 3.51e-01 | 0.1323 |
| 55015 | PRPF39 | P5T-E | Human | Esophagus | ESCC | 2.76e-20 | 3.97e-01 | 0.1327 |
| 55015 | PRPF39 | P8T-E | Human | Esophagus | ESCC | 4.82e-13 | 2.44e-01 | 0.0889 |
| 55015 | PRPF39 | P9T-E | Human | Esophagus | ESCC | 9.09e-08 | 1.54e-01 | 0.1131 |
| 55015 | PRPF39 | P10T-E | Human | Esophagus | ESCC | 9.30e-24 | 4.33e-01 | 0.116 |
| 55015 | PRPF39 | P11T-E | Human | Esophagus | ESCC | 1.07e-09 | 3.08e-01 | 0.1426 |
| 55015 | PRPF39 | P12T-E | Human | Esophagus | ESCC | 3.45e-18 | 4.58e-01 | 0.1122 |
| 55015 | PRPF39 | P15T-E | Human | Esophagus | ESCC | 2.78e-20 | 4.39e-01 | 0.1149 |
| 55015 | PRPF39 | P16T-E | Human | Esophagus | ESCC | 2.84e-24 | 3.93e-01 | 0.1153 |
| 55015 | PRPF39 | P17T-E | Human | Esophagus | ESCC | 2.08e-04 | 1.81e-01 | 0.1278 |
| 55015 | PRPF39 | P20T-E | Human | Esophagus | ESCC | 8.38e-15 | 3.16e-01 | 0.1124 |
| 55015 | PRPF39 | P21T-E | Human | Esophagus | ESCC | 1.54e-11 | 2.03e-01 | 0.1617 |
| 55015 | PRPF39 | P22T-E | Human | Esophagus | ESCC | 7.88e-09 | 1.72e-01 | 0.1236 |
| 55015 | PRPF39 | P23T-E | Human | Esophagus | ESCC | 2.01e-15 | 3.46e-01 | 0.108 |
| 55015 | PRPF39 | P24T-E | Human | Esophagus | ESCC | 2.98e-08 | 2.19e-01 | 0.1287 |
| 55015 | PRPF39 | P26T-E | Human | Esophagus | ESCC | 1.60e-64 | 1.01e+00 | 0.1276 |
| Page: 1 2 3 |
| Tissue | Expression Dynamics | Abbreviation |
| Esophagus | 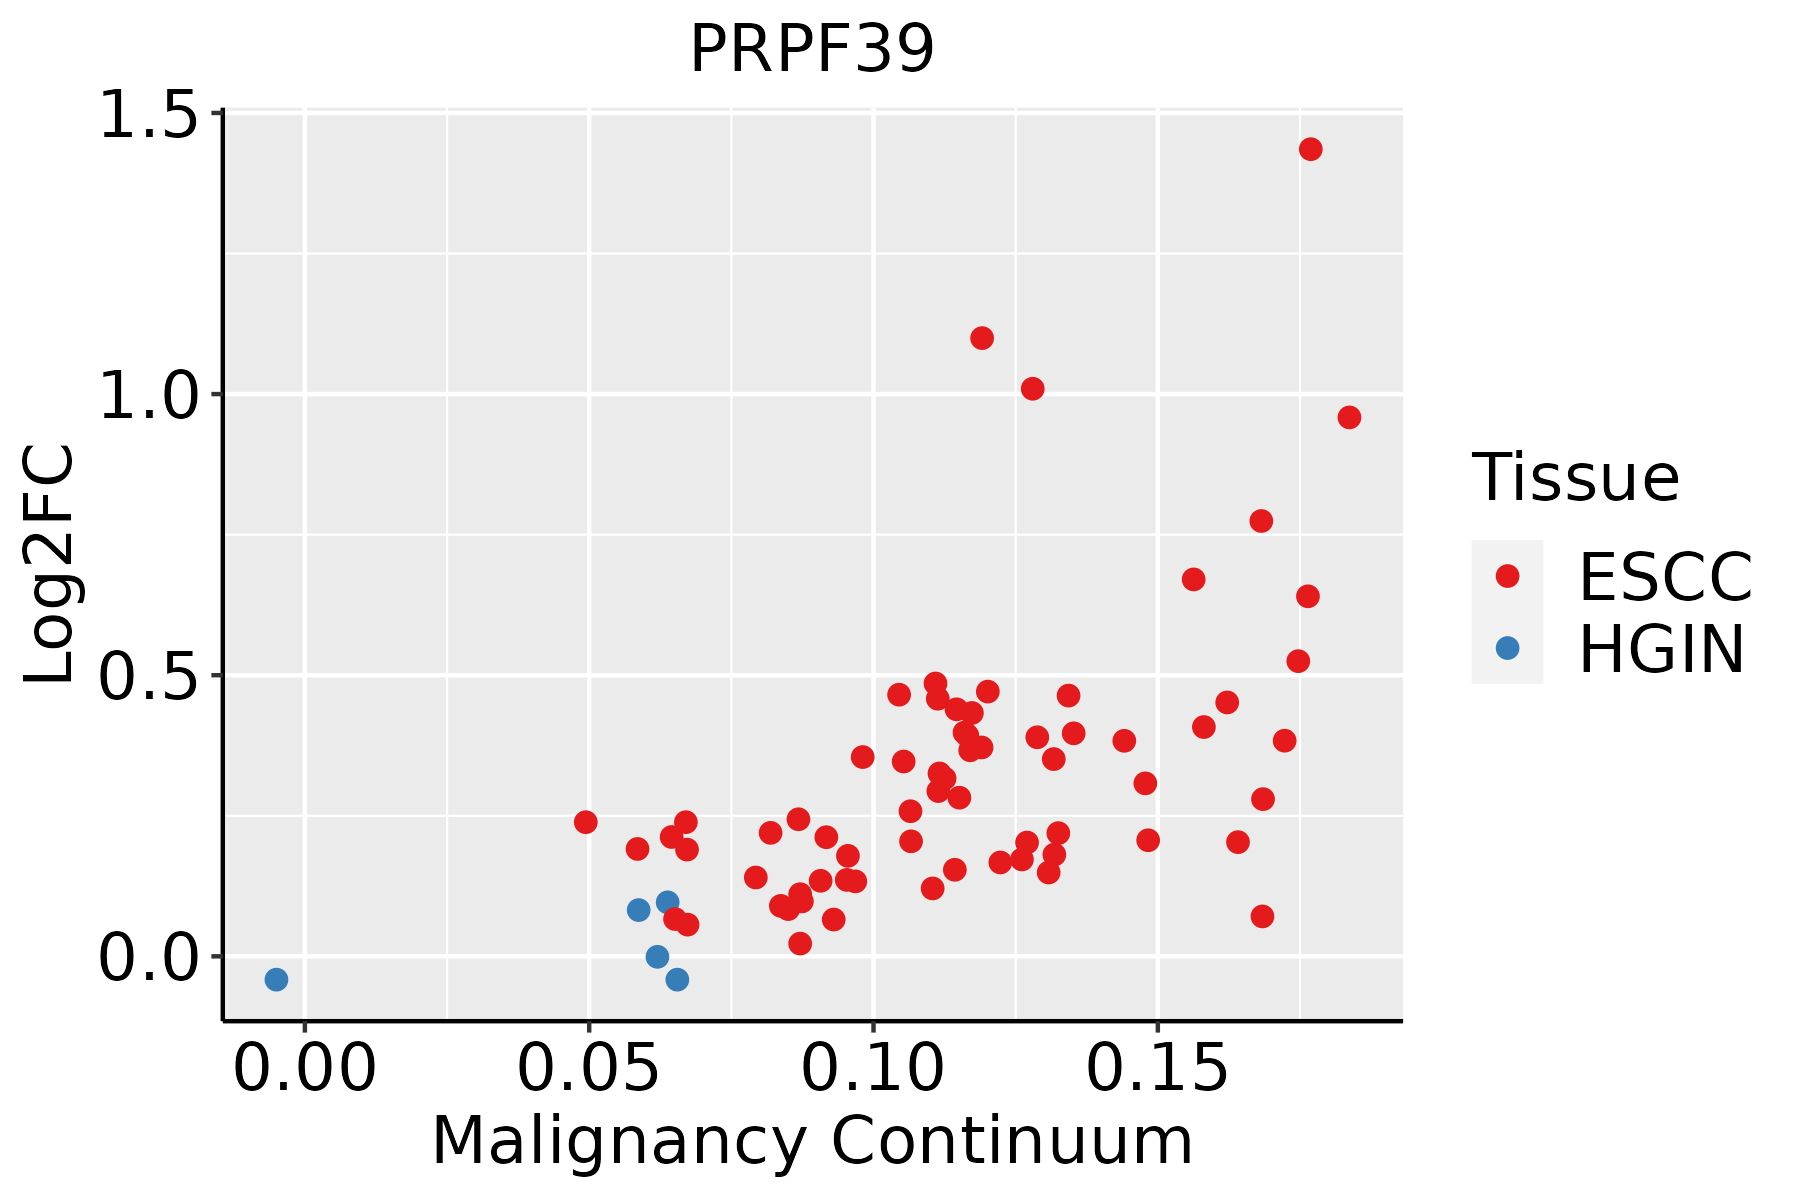 | ESCC: Esophageal squamous cell carcinoma |
| HGIN: High-grade intraepithelial neoplasias | ||
| LGIN: Low-grade intraepithelial neoplasias |
| ∗log2FC in expression of this searched gene in stem-like cells from each diseased tissue sample relative to stem-like cells in normal samples in each tissue plotted against the malignancy continuum. Samples are colored based on if they are from different disease stage. |
Top |
Malignant transformation related pathway analysis |
| Find out the enriched GO biological processes and KEGG pathways involved in transition from healthy to precancer to cancer |
| Tissue | Disease Stage | Enriched GO biological Processes |
| Colorectum | AD |  |
| Colorectum | SER |  |
| Colorectum | MSS |  |
| Colorectum | MSI-H |  |
| Colorectum | FAP |  |
| ∗Top 15 enriched GO BP terms are showed in the bar plot of each disease state in each tissue. Each row represents a significant GO biological process which is colored according to the -log10(p.adjust). |
| Page: 1 2 3 4 5 6 7 8 9 |
| GO ID | Tissue | Disease Stage | Description | Gene Ratio | Bg Ratio | pvalue | p.adjust | Count |
| GO:0022613111 | Esophagus | ESCC | ribonucleoprotein complex biogenesis | 365/8552 | 463/18723 | 1.74e-49 | 1.11e-45 | 365 |
| GO:0008380111 | Esophagus | ESCC | RNA splicing | 336/8552 | 434/18723 | 1.74e-42 | 3.67e-39 | 336 |
| GO:0000375111 | Esophagus | ESCC | RNA splicing, via transesterification reactions | 248/8552 | 324/18723 | 3.05e-30 | 1.49e-27 | 248 |
| GO:0000377111 | Esophagus | ESCC | RNA splicing, via transesterification reactions with bulged adenosine as nucleophile | 244/8552 | 320/18723 | 2.52e-29 | 1.07e-26 | 244 |
| GO:0000398111 | Esophagus | ESCC | mRNA splicing, via spliceosome | 244/8552 | 320/18723 | 2.52e-29 | 1.07e-26 | 244 |
| GO:0071826111 | Esophagus | ESCC | ribonucleoprotein complex subunit organization | 166/8552 | 227/18723 | 2.94e-17 | 2.42e-15 | 166 |
| GO:0022618111 | Esophagus | ESCC | ribonucleoprotein complex assembly | 159/8552 | 220/18723 | 8.19e-16 | 5.71e-14 | 159 |
| GO:000024514 | Esophagus | ESCC | spliceosomal complex assembly | 48/8552 | 79/18723 | 4.93e-03 | 1.89e-02 | 48 |
| Page: 1 |
| Pathway ID | Tissue | Disease Stage | Description | Gene Ratio | Bg Ratio | pvalue | p.adjust | qvalue | Count |
| Page: 1 |
Top |
Cell-cell communication analysis |
| Identification of potential cell-cell interactions between two cell types and their ligand-receptor pairs for different disease states |
| Ligand | Receptor | LRpair | Pathway | Tissue | Disease Stage |
| Page: 1 |
Top |
Single-cell gene regulatory network inference analysis |
| Find out the significant the regulons (TFs) and the target genes of each regulon across cell types for different disease states |
| TF | Cell Type | Tissue | Disease Stage | Target Gene | RSS | Regulon Activity |
| ∗The dot plots of a searched regulon are shown for all cell subpopulations in each disease state of each tissue based on the regulon specific score inferred using pySCENIC and by calculating the average expression. |
| Page: 1 |
Top |
Somatic mutation of malignant transformation related genes |
| Annotation of somatic variants for genes involved in malignant transformation |
| Hugo Symbol | Variant Class | Variant Classification | dbSNP RS | HGVSc | HGVSp | HGVSp Short | SWISSPROT | BIOTYPE | SIFT | PolyPhen | Tumor Sample Barcode | Tissue | Histology | Sex | Age | Stage | Therapy Types | Drugs | Outcome |
| PRPF39 | SNV | Missense_Mutation | c.1346A>C | p.Glu449Ala | p.E449A | Q86UA1 | protein_coding | tolerated(0.46) | benign(0.015) | TCGA-A8-A06Y-01 | Breast | breast invasive carcinoma | Female | >=65 | I/II | Hormone Therapy | anastrozole | PD | |
| PRPF39 | SNV | Missense_Mutation | novel | c.1859N>T | p.Ala620Val | p.A620V | Q86UA1 | protein_coding | tolerated(0.58) | benign(0) | TCGA-BH-A0HF-01 | Breast | breast invasive carcinoma | Female | >=65 | I/II | Hormone Therapy | arimidex | SD |
| PRPF39 | SNV | Missense_Mutation | rs768524269 | c.421C>T | p.Arg141Trp | p.R141W | Q86UA1 | protein_coding | deleterious(0) | probably_damaging(0.968) | TCGA-D8-A1J8-01 | Breast | breast invasive carcinoma | Female | >=65 | I/II | Hormone Therapy | nolvadex | SD |
| PRPF39 | SNV | Missense_Mutation | c.506N>G | p.Tyr169Cys | p.Y169C | Q86UA1 | protein_coding | deleterious(0) | probably_damaging(0.999) | TCGA-E2-A15T-01 | Breast | breast invasive carcinoma | Female | >=65 | I/II | Hormone Therapy | arimidex | SD | |
| PRPF39 | SNV | Missense_Mutation | novel | c.169N>C | p.Glu57Gln | p.E57Q | Q86UA1 | protein_coding | tolerated(0.15) | benign(0.12) | TCGA-PE-A5DE-01 | Breast | breast invasive carcinoma | Female | <65 | I/II | Chemotherapy | taxotere | CR |
| PRPF39 | SNV | Missense_Mutation | c.1966N>T | p.Asn656Tyr | p.N656Y | Q86UA1 | protein_coding | deleterious(0.05) | possibly_damaging(0.663) | TCGA-4N-A93T-01 | Colorectum | colon adenocarcinoma | Male | >=65 | III/IV | Chemotherapy | xeloda | SD | |
| PRPF39 | SNV | Missense_Mutation | novel | c.824N>A | p.Val275Glu | p.V275E | Q86UA1 | protein_coding | tolerated(1) | benign(0.013) | TCGA-AA-3678-01 | Colorectum | colon adenocarcinoma | Female | <65 | III/IV | Chemotherapy | folinic | CR |
| PRPF39 | SNV | Missense_Mutation | novel | c.481C>A | p.Leu161Ile | p.L161I | Q86UA1 | protein_coding | deleterious(0.01) | possibly_damaging(0.561) | TCGA-AA-3947-01 | Colorectum | colon adenocarcinoma | Female | <65 | I/II | Unknown | Unknown | SD |
| PRPF39 | SNV | Missense_Mutation | novel | c.1854N>T | p.Lys618Asn | p.K618N | Q86UA1 | protein_coding | deleterious(0) | probably_damaging(0.976) | TCGA-AA-3984-01 | Colorectum | colon adenocarcinoma | Female | <65 | I/II | Unknown | Unknown | SD |
| PRPF39 | SNV | Missense_Mutation | novel | c.1629N>C | p.Lys543Asn | p.K543N | Q86UA1 | protein_coding | tolerated(0.38) | benign(0.051) | TCGA-F5-6814-01 | Colorectum | rectum adenocarcinoma | Male | <65 | I/II | Unknown | Unknown | SD |
| Page: 1 2 3 4 5 |
Top |
Related drugs of malignant transformation related genes |
| Identification of chemicals and drugs interact with genes involved in malignant transfromation |
| (DGIdb 4.0) |
| Entrez ID | Symbol | Category | Interaction Types | Drug Claim Name | Drug Name | PMIDs |
| Page: 1 |

Copyright 2023-Present -The University of Texas Health Science Center at Houston |