
|
|||||
|
 | |
| |
| |
| |
| |
| |
|
Gene: PRPF38B |
Gene summary for PRPF38B |
| Gene information | Species | Human | Gene symbol | PRPF38B | Gene ID | 55119 |
| Gene name | pre-mRNA processing factor 38B | |
| Gene Alias | NET1 | |
| Cytomap | 1p13.3 | |
| Gene Type | protein-coding | GO ID | GO:0006139 | UniProtAcc | Q5VTL8 |
Top |
Malignant transformation analysis |
| Identification of the aberrant gene expression in precancerous and cancerous lesions by comparing the gene expression of stem-like cells in diseased tissues with normal stem cells |
| Entrez ID | Symbol | Replicates | Species | Organ | Tissue | Adj P-value | Log2FC | Malignancy |
| 55119 | PRPF38B | HTA11_3410_2000001011 | Human | Colorectum | AD | 1.53e-05 | -3.14e-01 | 0.0155 |
| 55119 | PRPF38B | HTA11_347_2000001011 | Human | Colorectum | AD | 3.02e-03 | 4.02e-01 | -0.1954 |
| 55119 | PRPF38B | A015-C-203 | Human | Colorectum | FAP | 7.15e-31 | 5.23e-01 | -0.1294 |
| 55119 | PRPF38B | A015-C-204 | Human | Colorectum | FAP | 7.95e-07 | 4.42e-01 | -0.0228 |
| 55119 | PRPF38B | A014-C-040 | Human | Colorectum | FAP | 1.10e-05 | 4.80e-01 | -0.1184 |
| 55119 | PRPF38B | A002-C-201 | Human | Colorectum | FAP | 2.78e-08 | 2.68e-01 | 0.0324 |
| 55119 | PRPF38B | A001-C-119 | Human | Colorectum | FAP | 3.88e-34 | 9.85e-01 | -0.1557 |
| 55119 | PRPF38B | A001-C-108 | Human | Colorectum | FAP | 9.69e-27 | 5.70e-01 | -0.0272 |
| 55119 | PRPF38B | A002-C-021 | Human | Colorectum | FAP | 5.14e-08 | 3.48e-01 | 0.1171 |
| 55119 | PRPF38B | A002-C-205 | Human | Colorectum | FAP | 1.01e-39 | 7.96e-01 | -0.1236 |
| 55119 | PRPF38B | A014-C-108 | Human | Colorectum | FAP | 4.29e-02 | 4.24e-01 | -0.124 |
| 55119 | PRPF38B | A001-C-104 | Human | Colorectum | FAP | 2.70e-06 | 3.76e-01 | 0.0184 |
| 55119 | PRPF38B | A015-C-006 | Human | Colorectum | FAP | 1.46e-17 | 4.95e-01 | -0.0994 |
| 55119 | PRPF38B | A015-C-106 | Human | Colorectum | FAP | 1.37e-09 | 4.04e-01 | -0.0511 |
| 55119 | PRPF38B | A002-C-114 | Human | Colorectum | FAP | 2.22e-22 | 5.82e-01 | -0.1561 |
| 55119 | PRPF38B | A015-C-104 | Human | Colorectum | FAP | 3.13e-40 | 6.76e-01 | -0.1899 |
| 55119 | PRPF38B | A001-C-014 | Human | Colorectum | FAP | 5.19e-16 | 4.99e-01 | 0.0135 |
| 55119 | PRPF38B | A002-C-016 | Human | Colorectum | FAP | 2.50e-21 | 4.12e-01 | 0.0521 |
| 55119 | PRPF38B | A015-C-002 | Human | Colorectum | FAP | 2.97e-18 | 6.88e-01 | -0.0763 |
| 55119 | PRPF38B | A001-C-007 | Human | Colorectum | CRC | 2.35e-04 | 5.60e-01 | 0.1899 |
| Page: 1 2 3 4 5 6 7 8 9 10 |
| Tissue | Expression Dynamics | Abbreviation |
| Colorectum (GSE201348) |  | FAP: Familial adenomatous polyposis |
| CRC: Colorectal cancer | ||
| Colorectum (HTA11) |  | AD: Adenomas |
| SER: Sessile serrated lesions | ||
| MSI-H: Microsatellite-high colorectal cancer | ||
| MSS: Microsatellite stable colorectal cancer | ||
| Endometrium |  | AEH: Atypical endometrial hyperplasia |
| EEC: Endometrioid Cancer | ||
| Esophagus | 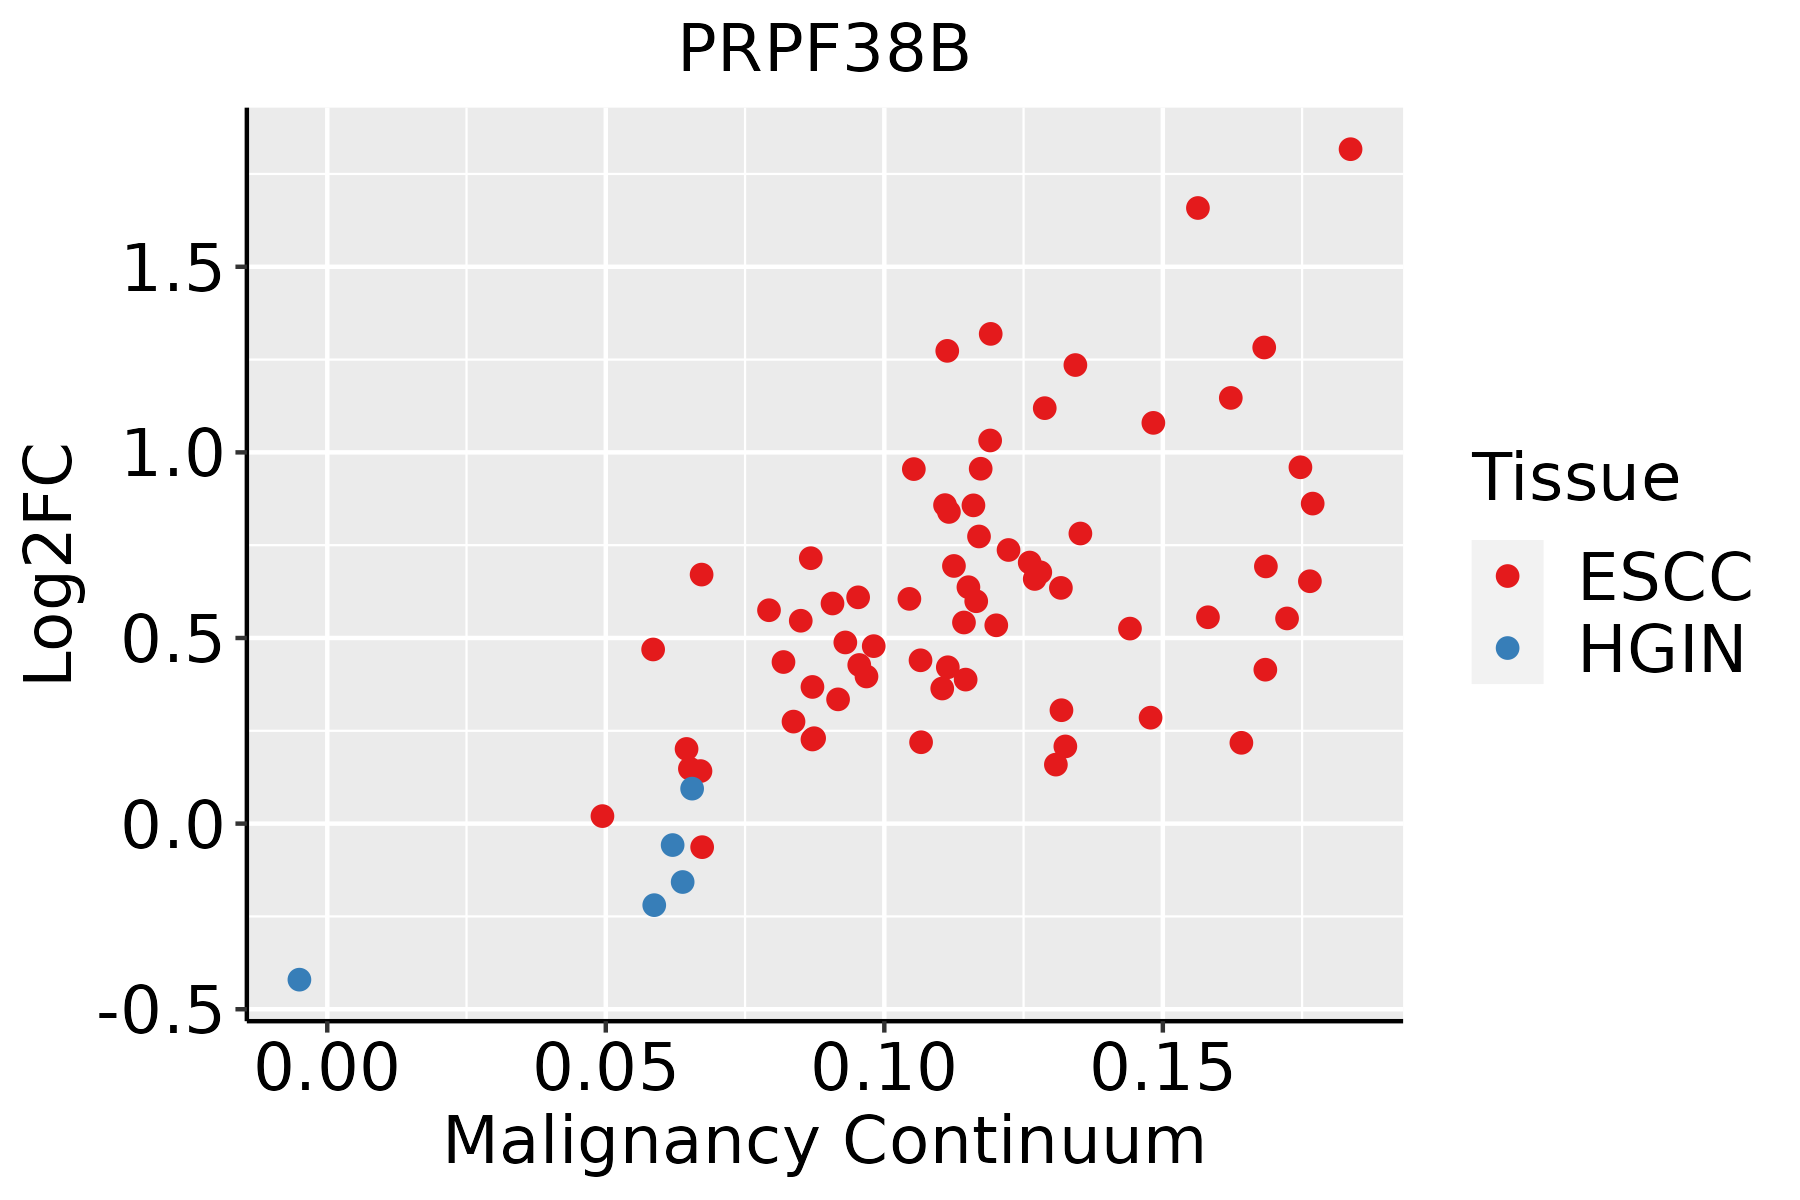 | ESCC: Esophageal squamous cell carcinoma |
| HGIN: High-grade intraepithelial neoplasias | ||
| LGIN: Low-grade intraepithelial neoplasias | ||
| Liver | 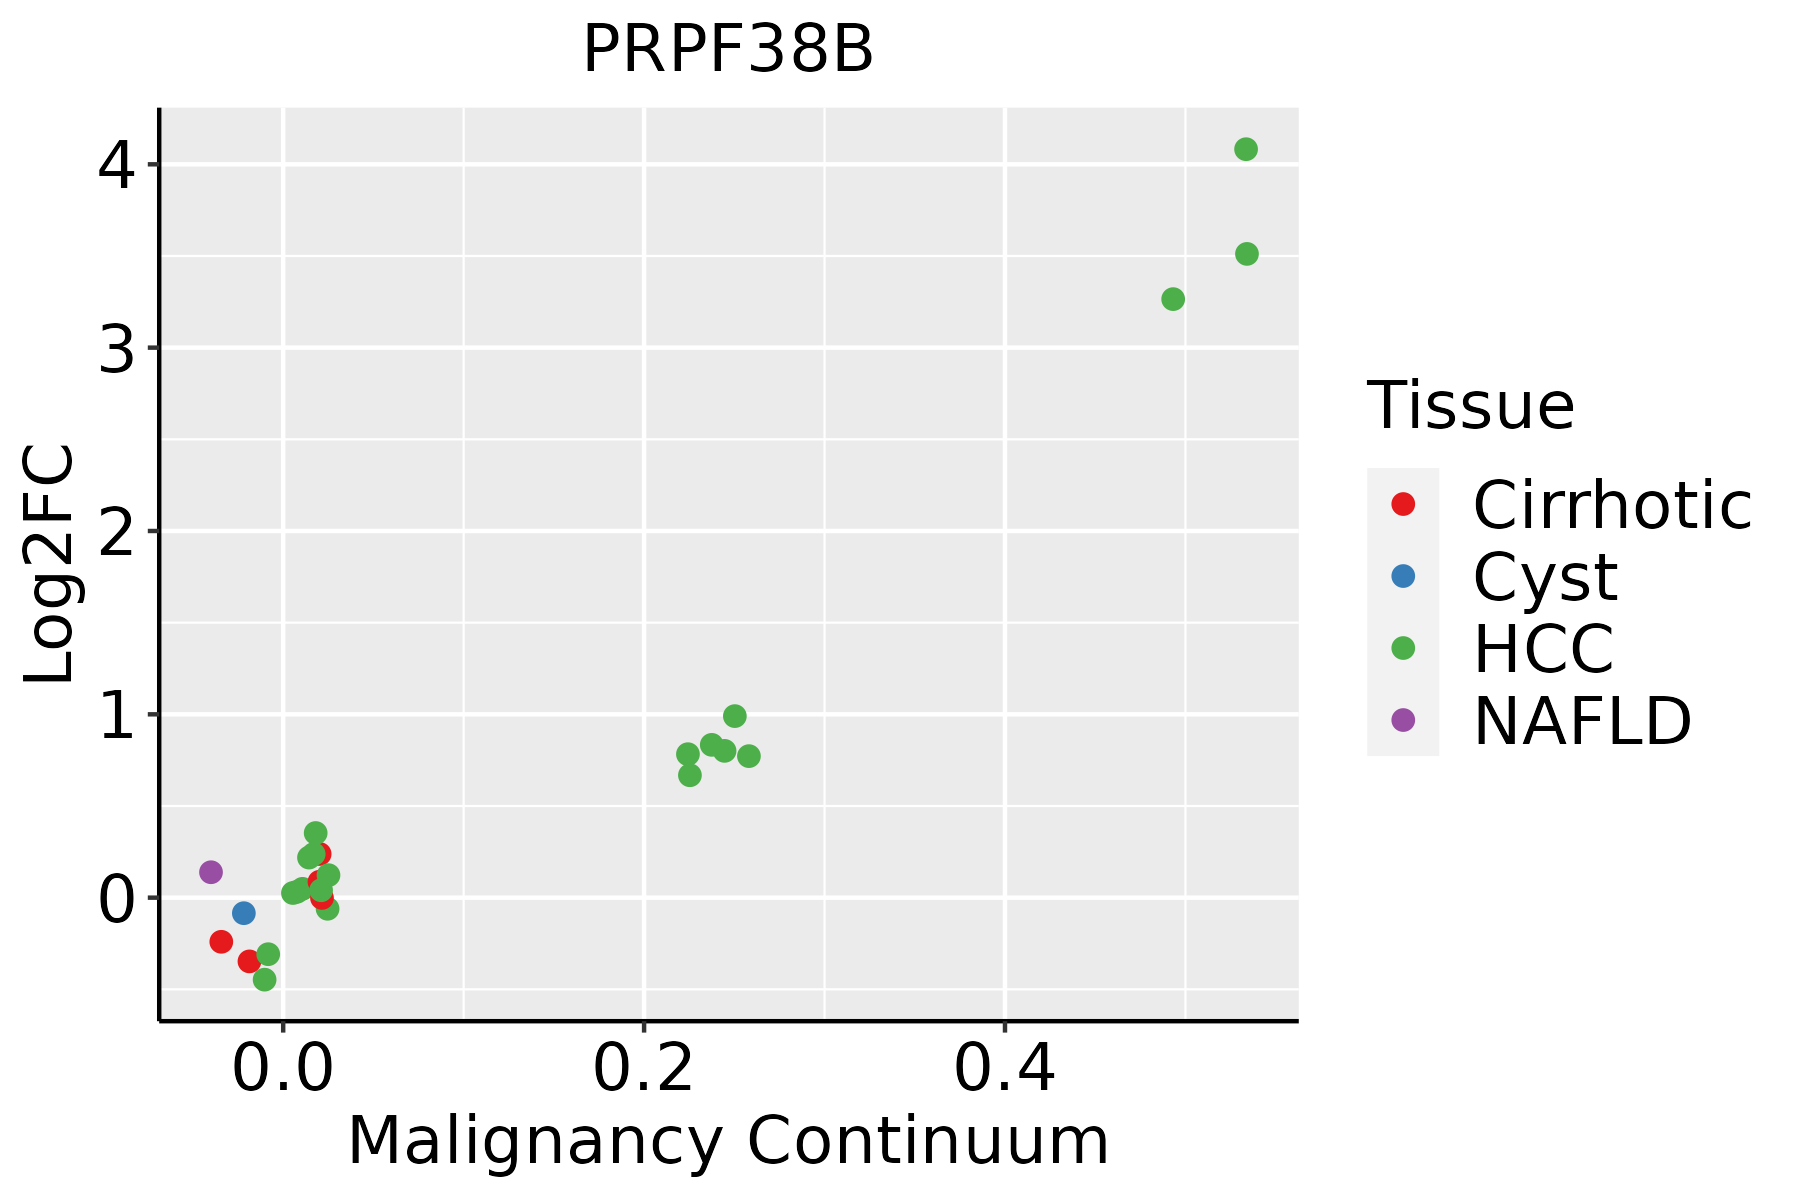 | HCC: Hepatocellular carcinoma |
| NAFLD: Non-alcoholic fatty liver disease | ||
| Oral Cavity |  | EOLP: Erosive Oral lichen planus |
| LP: leukoplakia | ||
| NEOLP: Non-erosive oral lichen planus | ||
| OSCC: Oral squamous cell carcinoma | ||
| Prostate | 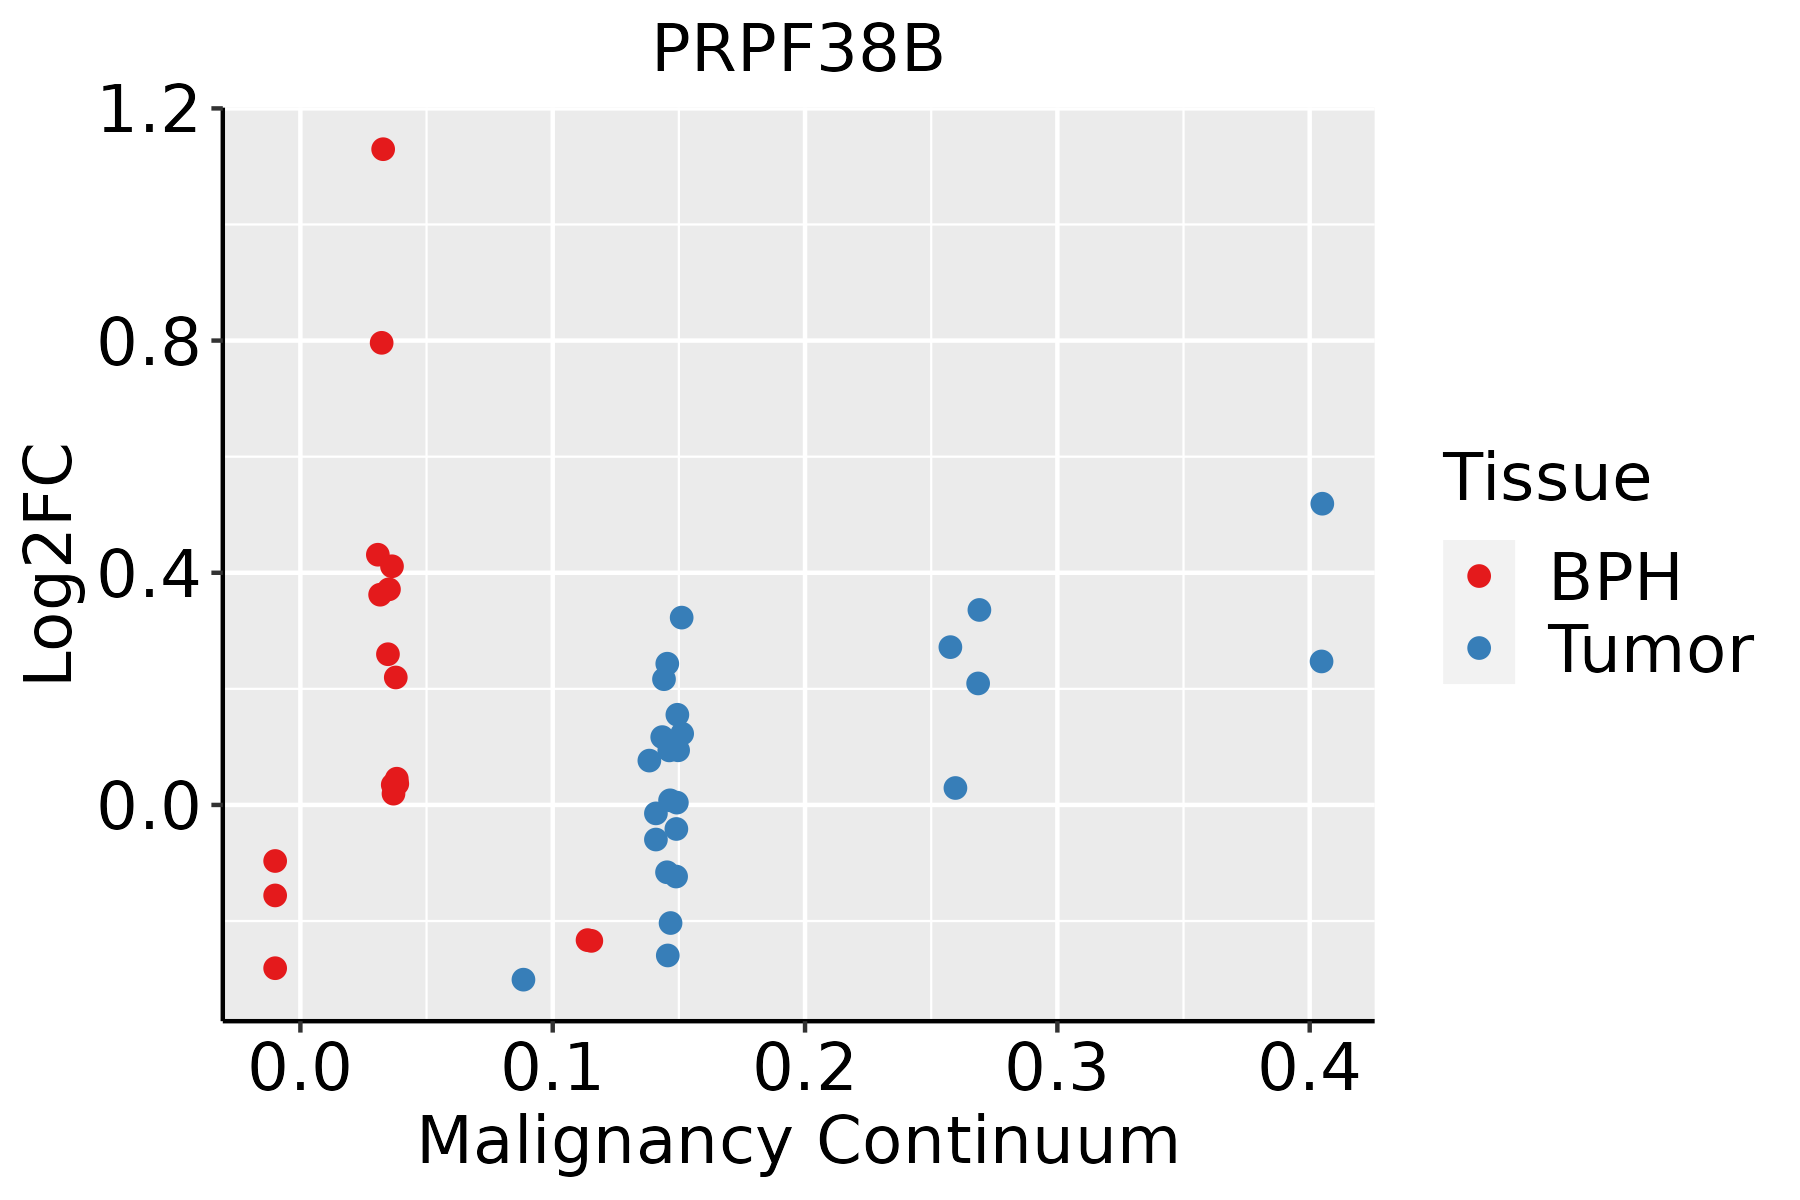 | BPH: Benign Prostatic Hyperplasia |
| Skin |  | AK: Actinic keratosis |
| cSCC: Cutaneous squamous cell carcinoma | ||
| SCCIS:squamous cell carcinoma in situ | ||
| Thyroid | 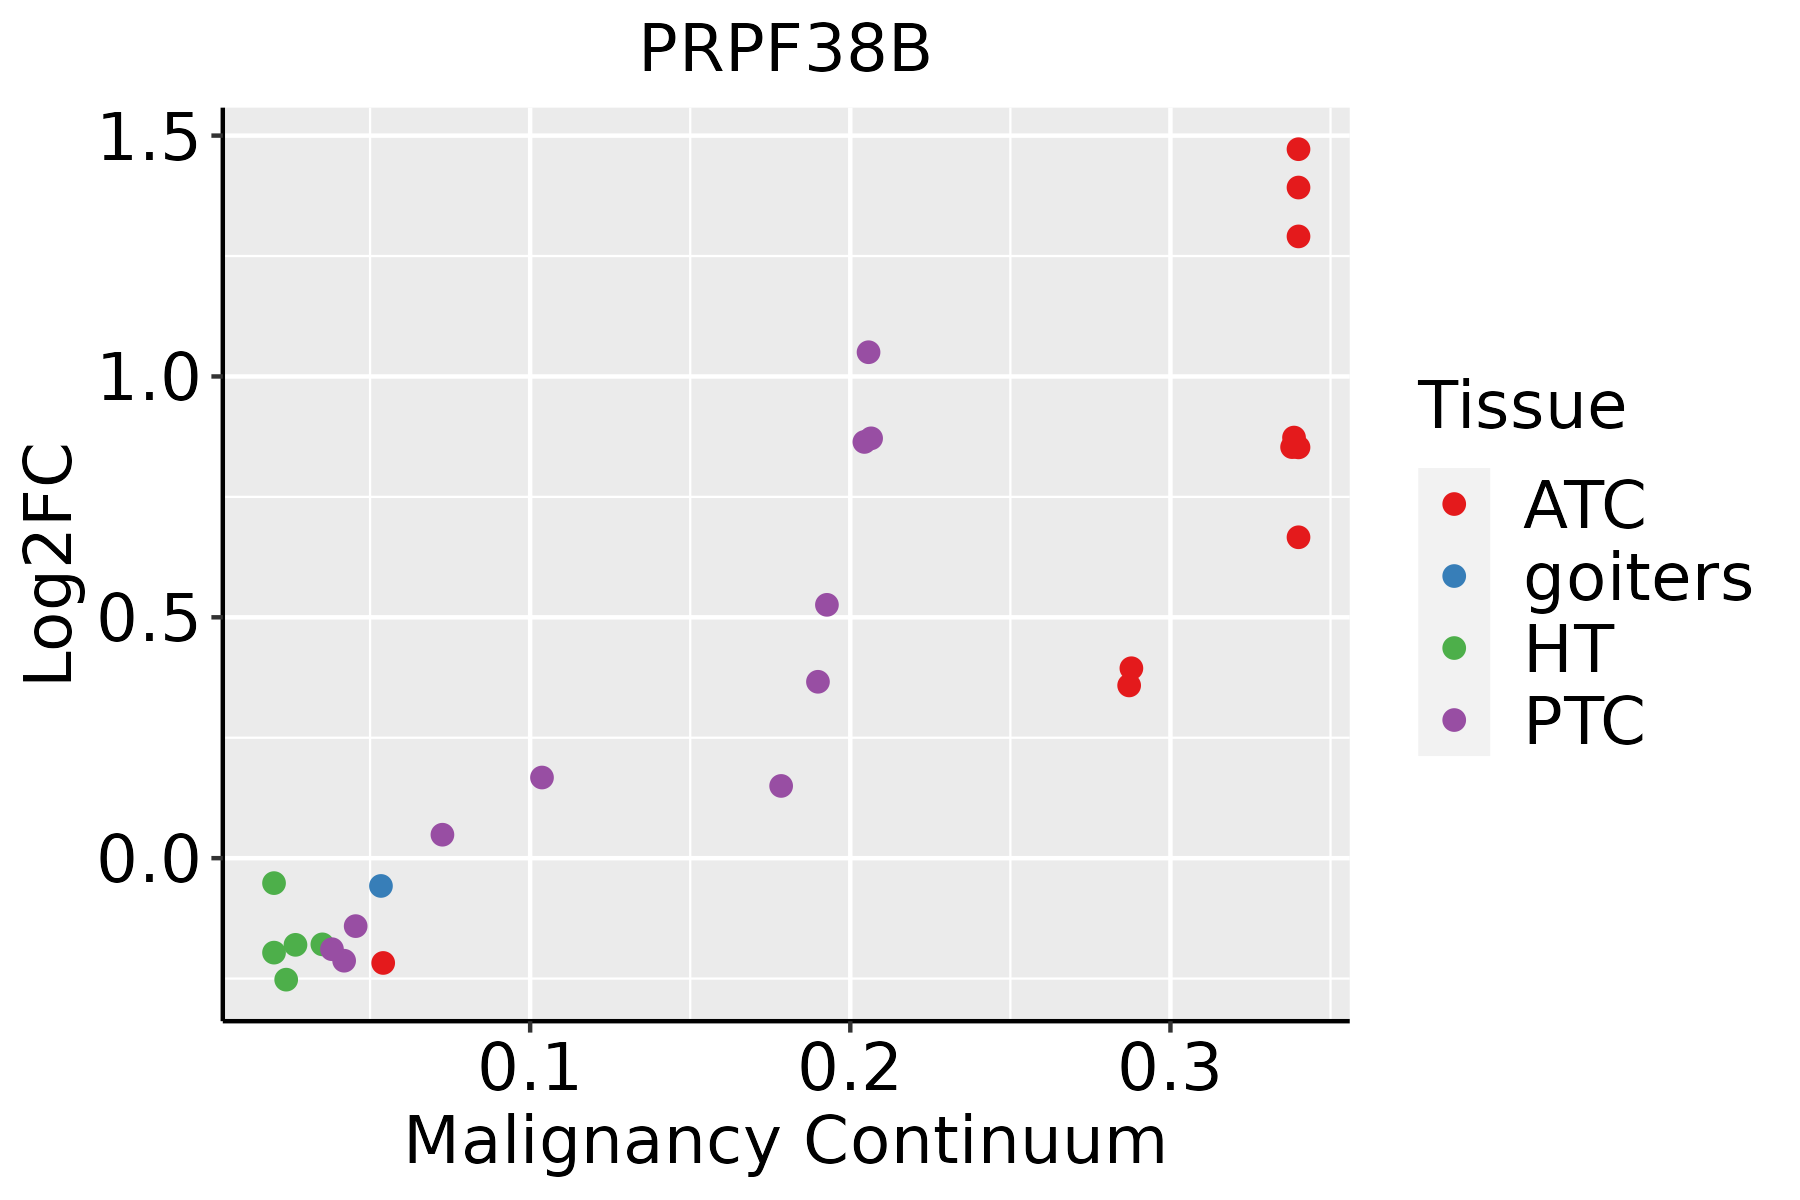 | ATC: Anaplastic thyroid cancer |
| HT: Hashimoto's thyroiditis | ||
| PTC: Papillary thyroid cancer |
| ∗log2FC in expression of this searched gene in stem-like cells from each diseased tissue sample relative to stem-like cells in normal samples in each tissue plotted against the malignancy continuum. Samples are colored based on if they are from different disease stage. |
Top |
Malignant transformation related pathway analysis |
| Find out the enriched GO biological processes and KEGG pathways involved in transition from healthy to precancer to cancer |
| Tissue | Disease Stage | Enriched GO biological Processes |
| Colorectum | AD |  |
| Colorectum | SER |  |
| Colorectum | MSS |  |
| Colorectum | MSI-H |  |
| Colorectum | FAP |  |
| ∗Top 15 enriched GO BP terms are showed in the bar plot of each disease state in each tissue. Each row represents a significant GO biological process which is colored according to the -log10(p.adjust). |
| Page: 1 2 3 4 5 6 7 8 9 |
| GO ID | Tissue | Disease Stage | Description | Gene Ratio | Bg Ratio | pvalue | p.adjust | Count |
| GO:0008380 | Colorectum | AD | RNA splicing | 169/3918 | 434/18723 | 3.59e-18 | 2.04e-15 | 169 |
| GO:00083804 | Colorectum | FAP | RNA splicing | 108/2622 | 434/18723 | 7.90e-10 | 1.86e-07 | 108 |
| GO:00083805 | Colorectum | CRC | RNA splicing | 90/2078 | 434/18723 | 2.80e-09 | 7.97e-07 | 90 |
| GO:000838016 | Endometrium | AEH | RNA splicing | 111/2100 | 434/18723 | 2.42e-17 | 1.12e-14 | 111 |
| GO:000838017 | Endometrium | EEC | RNA splicing | 111/2168 | 434/18723 | 2.45e-16 | 1.13e-13 | 111 |
| GO:0008380111 | Esophagus | ESCC | RNA splicing | 336/8552 | 434/18723 | 1.74e-42 | 3.67e-39 | 336 |
| GO:00083807 | Liver | NAFLD | RNA splicing | 70/1882 | 434/18723 | 4.62e-05 | 1.10e-03 | 70 |
| GO:000838012 | Liver | Cirrhotic | RNA splicing | 229/4634 | 434/18723 | 9.13e-37 | 2.86e-33 | 229 |
| GO:000838022 | Liver | HCC | RNA splicing | 313/7958 | 434/18723 | 1.36e-36 | 1.73e-33 | 313 |
| GO:000838020 | Oral cavity | OSCC | RNA splicing | 308/7305 | 434/18723 | 2.43e-42 | 7.70e-39 | 308 |
| GO:0008380110 | Oral cavity | LP | RNA splicing | 237/4623 | 434/18723 | 1.82e-41 | 3.79e-38 | 237 |
| GO:000838025 | Oral cavity | EOLP | RNA splicing | 115/2218 | 434/18723 | 2.24e-17 | 3.04e-14 | 115 |
| GO:000838018 | Prostate | BPH | RNA splicing | 147/3107 | 434/18723 | 5.17e-19 | 2.29e-16 | 147 |
| GO:000838019 | Prostate | Tumor | RNA splicing | 153/3246 | 434/18723 | 9.15e-20 | 5.79e-17 | 153 |
| GO:0008380112 | Skin | cSCC | RNA splicing | 263/4864 | 434/18723 | 2.45e-53 | 5.13e-50 | 263 |
| GO:0008380113 | Thyroid | PTC | RNA splicing | 273/5968 | 434/18723 | 4.44e-41 | 1.40e-37 | 273 |
| GO:000838034 | Thyroid | ATC | RNA splicing | 270/6293 | 434/18723 | 7.50e-35 | 1.19e-31 | 270 |
| Page: 1 |
| Pathway ID | Tissue | Disease Stage | Description | Gene Ratio | Bg Ratio | pvalue | p.adjust | qvalue | Count |
| hsa03040 | Colorectum | AD | Spliceosome | 73/2092 | 217/8465 | 1.73e-03 | 9.68e-03 | 6.18e-03 | 73 |
| hsa030401 | Colorectum | AD | Spliceosome | 73/2092 | 217/8465 | 1.73e-03 | 9.68e-03 | 6.18e-03 | 73 |
| hsa030409 | Endometrium | AEH | Spliceosome | 54/1197 | 217/8465 | 1.47e-05 | 1.65e-04 | 1.21e-04 | 54 |
| hsa0304014 | Endometrium | AEH | Spliceosome | 54/1197 | 217/8465 | 1.47e-05 | 1.65e-04 | 1.21e-04 | 54 |
| hsa0304024 | Endometrium | EEC | Spliceosome | 54/1237 | 217/8465 | 3.78e-05 | 3.88e-04 | 2.89e-04 | 54 |
| hsa0304034 | Endometrium | EEC | Spliceosome | 54/1237 | 217/8465 | 3.78e-05 | 3.88e-04 | 2.89e-04 | 54 |
| hsa0304027 | Esophagus | ESCC | Spliceosome | 128/4205 | 217/8465 | 3.31e-03 | 8.79e-03 | 4.50e-03 | 128 |
| hsa0304037 | Esophagus | ESCC | Spliceosome | 128/4205 | 217/8465 | 3.31e-03 | 8.79e-03 | 4.50e-03 | 128 |
| hsa030407 | Liver | Cirrhotic | Spliceosome | 102/2530 | 217/8465 | 5.69e-08 | 9.47e-07 | 5.84e-07 | 102 |
| hsa0304012 | Liver | Cirrhotic | Spliceosome | 102/2530 | 217/8465 | 5.69e-08 | 9.47e-07 | 5.84e-07 | 102 |
| hsa0304022 | Liver | HCC | Spliceosome | 122/4020 | 217/8465 | 5.55e-03 | 1.60e-02 | 8.91e-03 | 122 |
| hsa0304032 | Liver | HCC | Spliceosome | 122/4020 | 217/8465 | 5.55e-03 | 1.60e-02 | 8.91e-03 | 122 |
| hsa0304016 | Oral cavity | OSCC | Spliceosome | 123/3704 | 217/8465 | 7.21e-05 | 2.74e-04 | 1.40e-04 | 123 |
| hsa0304017 | Oral cavity | OSCC | Spliceosome | 123/3704 | 217/8465 | 7.21e-05 | 2.74e-04 | 1.40e-04 | 123 |
| hsa0304026 | Oral cavity | LP | Spliceosome | 106/2418 | 217/8465 | 1.30e-10 | 2.40e-09 | 1.55e-09 | 106 |
| hsa0304036 | Oral cavity | LP | Spliceosome | 106/2418 | 217/8465 | 1.30e-10 | 2.40e-09 | 1.55e-09 | 106 |
| hsa0304010 | Prostate | BPH | Spliceosome | 62/1718 | 217/8465 | 1.99e-03 | 7.92e-03 | 4.90e-03 | 62 |
| hsa0304015 | Prostate | BPH | Spliceosome | 62/1718 | 217/8465 | 1.99e-03 | 7.92e-03 | 4.90e-03 | 62 |
| hsa0304025 | Prostate | Tumor | Spliceosome | 66/1791 | 217/8465 | 7.53e-04 | 3.59e-03 | 2.23e-03 | 66 |
| hsa0304035 | Prostate | Tumor | Spliceosome | 66/1791 | 217/8465 | 7.53e-04 | 3.59e-03 | 2.23e-03 | 66 |
| Page: 1 |
Top |
Cell-cell communication analysis |
| Identification of potential cell-cell interactions between two cell types and their ligand-receptor pairs for different disease states |
| Ligand | Receptor | LRpair | Pathway | Tissue | Disease Stage |
| Page: 1 |
Top |
Single-cell gene regulatory network inference analysis |
| Find out the significant the regulons (TFs) and the target genes of each regulon across cell types for different disease states |
| TF | Cell Type | Tissue | Disease Stage | Target Gene | RSS | Regulon Activity |
| ∗The dot plots of a searched regulon are shown for all cell subpopulations in each disease state of each tissue based on the regulon specific score inferred using pySCENIC and by calculating the average expression. |
| Page: 1 |
Top |
Somatic mutation of malignant transformation related genes |
| Annotation of somatic variants for genes involved in malignant transformation |
| Hugo Symbol | Variant Class | Variant Classification | dbSNP RS | HGVSc | HGVSp | HGVSp Short | SWISSPROT | BIOTYPE | SIFT | PolyPhen | Tumor Sample Barcode | Tissue | Histology | Sex | Age | Stage | Therapy Types | Drugs | Outcome |
| PRPF38B | SNV | Missense_Mutation | c.442N>G | p.Leu148Val | p.L148V | Q5VTL8 | protein_coding | deleterious(0) | possibly_damaging(0.908) | TCGA-A8-A08R-01 | Breast | breast invasive carcinoma | Female | <65 | I/II | Unknown | Unknown | SD | |
| PRPF38B | SNV | Missense_Mutation | c.881N>T | p.Glu294Val | p.E294V | Q5VTL8 | protein_coding | deleterious(0.05) | probably_damaging(0.994) | TCGA-C8-A12P-01 | Breast | breast invasive carcinoma | Female | <65 | I/II | Unknown | Unknown | SD | |
| PRPF38B | SNV | Missense_Mutation | novel | c.9N>G | p.Asn3Lys | p.N3K | Q5VTL8 | protein_coding | deleterious_low_confidence(0.01) | benign(0.062) | TCGA-GM-A3XL-01 | Breast | breast invasive carcinoma | Female | <65 | I/II | Chemotherapy | fluorouracil | CR |
| PRPF38B | insertion | In_Frame_Ins | novel | c.278_304dupTCACGCACGTTGAACCATGGGAGAAAG | p.Val93_Lys101dup | p.V93_K101dup | Q5VTL8 | protein_coding | TCGA-A8-A097-01 | Breast | breast invasive carcinoma | Female | >=65 | I/II | Hormone Therapy | tamoxiphen | SD | ||
| PRPF38B | deletion | Frame_Shift_Del | novel | c.523_551delNNNNNNNNNNNNNNNNNNNNNNNNNNNNN | p.Trp175Ter | p.W175* | Q5VTL8 | protein_coding | TCGA-E2-A14R-01 | Breast | breast invasive carcinoma | Female | <65 | I/II | Chemotherapy | doxorubicin | PD | ||
| PRPF38B | SNV | Missense_Mutation | novel | c.622N>G | p.Leu208Val | p.L208V | Q5VTL8 | protein_coding | deleterious(0.01) | probably_damaging(0.979) | TCGA-Q1-A5R2-01 | Cervix | cervical & endocervical cancer | Female | <65 | I/II | Chemotherapy | cisplatin | PR |
| PRPF38B | SNV | Missense_Mutation | c.594N>A | p.Met198Ile | p.M198I | Q5VTL8 | protein_coding | tolerated(0.09) | benign(0.376) | TCGA-Q1-A6DT-01 | Cervix | cervical & endocervical cancer | Female | <65 | I/II | Unknown | Unknown | PD | |
| PRPF38B | SNV | Missense_Mutation | novel | c.146N>C | p.Leu49Pro | p.L49P | Q5VTL8 | protein_coding | deleterious(0) | probably_damaging(0.991) | TCGA-ZJ-AAXT-01 | Cervix | cervical & endocervical cancer | Female | <65 | III/IV | Unknown | Unknown | SD |
| PRPF38B | insertion | In_Frame_Ins | rs754387851 | c.1060_1061insTCCTTG | p.Arg354delinsLeuLeuGly | p.R354delinsLLG | Q5VTL8 | protein_coding | TCGA-DS-A1OB-01 | Cervix | cervical & endocervical cancer | Female | <65 | I/II | Chemotherapy | carboplatin | PD | ||
| PRPF38B | SNV | Missense_Mutation | rs750555207 | c.986G>A | p.Arg329His | p.R329H | Q5VTL8 | protein_coding | tolerated(0.27) | benign(0) | TCGA-AA-3949-01 | Colorectum | colon adenocarcinoma | Female | >=65 | III/IV | Unknown | Unknown | SD |
| Page: 1 2 3 4 5 6 7 |
Top |
Related drugs of malignant transformation related genes |
| Identification of chemicals and drugs interact with genes involved in malignant transfromation |
| (DGIdb 4.0) |
| Entrez ID | Symbol | Category | Interaction Types | Drug Claim Name | Drug Name | PMIDs |
| Page: 1 |

Copyright 2023-Present -The University of Texas Health Science Center at Houston |