
|
|||||
|
 | |
| |
| |
| |
| |
| |
|
Gene: PRPF3 |
Gene summary for PRPF3 |
| Gene information | Species | Human | Gene symbol | PRPF3 | Gene ID | 9129 |
| Gene name | pre-mRNA processing factor 3 | |
| Gene Alias | HPRP3 | |
| Cytomap | 1q21.2 | |
| Gene Type | protein-coding | GO ID | GO:0000244 | UniProtAcc | O43395 |
Top |
Malignant transformation analysis |
| Identification of the aberrant gene expression in precancerous and cancerous lesions by comparing the gene expression of stem-like cells in diseased tissues with normal stem cells |
| Entrez ID | Symbol | Replicates | Species | Organ | Tissue | Adj P-value | Log2FC | Malignancy |
| 9129 | PRPF3 | LZE2T | Human | Esophagus | ESCC | 3.35e-09 | 7.01e-01 | 0.082 |
| 9129 | PRPF3 | LZE4T | Human | Esophagus | ESCC | 3.21e-07 | 2.77e-01 | 0.0811 |
| 9129 | PRPF3 | LZE7T | Human | Esophagus | ESCC | 1.81e-06 | 3.54e-01 | 0.0667 |
| 9129 | PRPF3 | LZE8T | Human | Esophagus | ESCC | 8.87e-03 | 6.80e-02 | 0.067 |
| 9129 | PRPF3 | LZE22T | Human | Esophagus | ESCC | 4.91e-04 | 4.14e-01 | 0.068 |
| 9129 | PRPF3 | LZE24T | Human | Esophagus | ESCC | 1.06e-07 | 2.22e-01 | 0.0596 |
| 9129 | PRPF3 | P1T-E | Human | Esophagus | ESCC | 9.38e-05 | 3.39e-01 | 0.0875 |
| 9129 | PRPF3 | P2T-E | Human | Esophagus | ESCC | 7.78e-23 | 3.82e-01 | 0.1177 |
| 9129 | PRPF3 | P4T-E | Human | Esophagus | ESCC | 1.19e-06 | 2.27e-01 | 0.1323 |
| 9129 | PRPF3 | P5T-E | Human | Esophagus | ESCC | 2.56e-16 | 2.09e-01 | 0.1327 |
| 9129 | PRPF3 | P8T-E | Human | Esophagus | ESCC | 5.74e-23 | 2.05e-01 | 0.0889 |
| 9129 | PRPF3 | P9T-E | Human | Esophagus | ESCC | 4.73e-14 | 2.44e-01 | 0.1131 |
| 9129 | PRPF3 | P10T-E | Human | Esophagus | ESCC | 7.41e-33 | 5.93e-01 | 0.116 |
| 9129 | PRPF3 | P11T-E | Human | Esophagus | ESCC | 1.56e-07 | 4.85e-01 | 0.1426 |
| 9129 | PRPF3 | P12T-E | Human | Esophagus | ESCC | 7.63e-22 | 3.16e-01 | 0.1122 |
| 9129 | PRPF3 | P15T-E | Human | Esophagus | ESCC | 2.05e-21 | 4.04e-01 | 0.1149 |
| 9129 | PRPF3 | P16T-E | Human | Esophagus | ESCC | 3.43e-30 | 4.32e-01 | 0.1153 |
| 9129 | PRPF3 | P17T-E | Human | Esophagus | ESCC | 6.47e-04 | 2.82e-01 | 0.1278 |
| 9129 | PRPF3 | P19T-E | Human | Esophagus | ESCC | 1.05e-04 | 2.99e-01 | 0.1662 |
| 9129 | PRPF3 | P20T-E | Human | Esophagus | ESCC | 6.57e-09 | 3.03e-01 | 0.1124 |
| Page: 1 2 3 4 |
| Tissue | Expression Dynamics | Abbreviation |
| Esophagus | 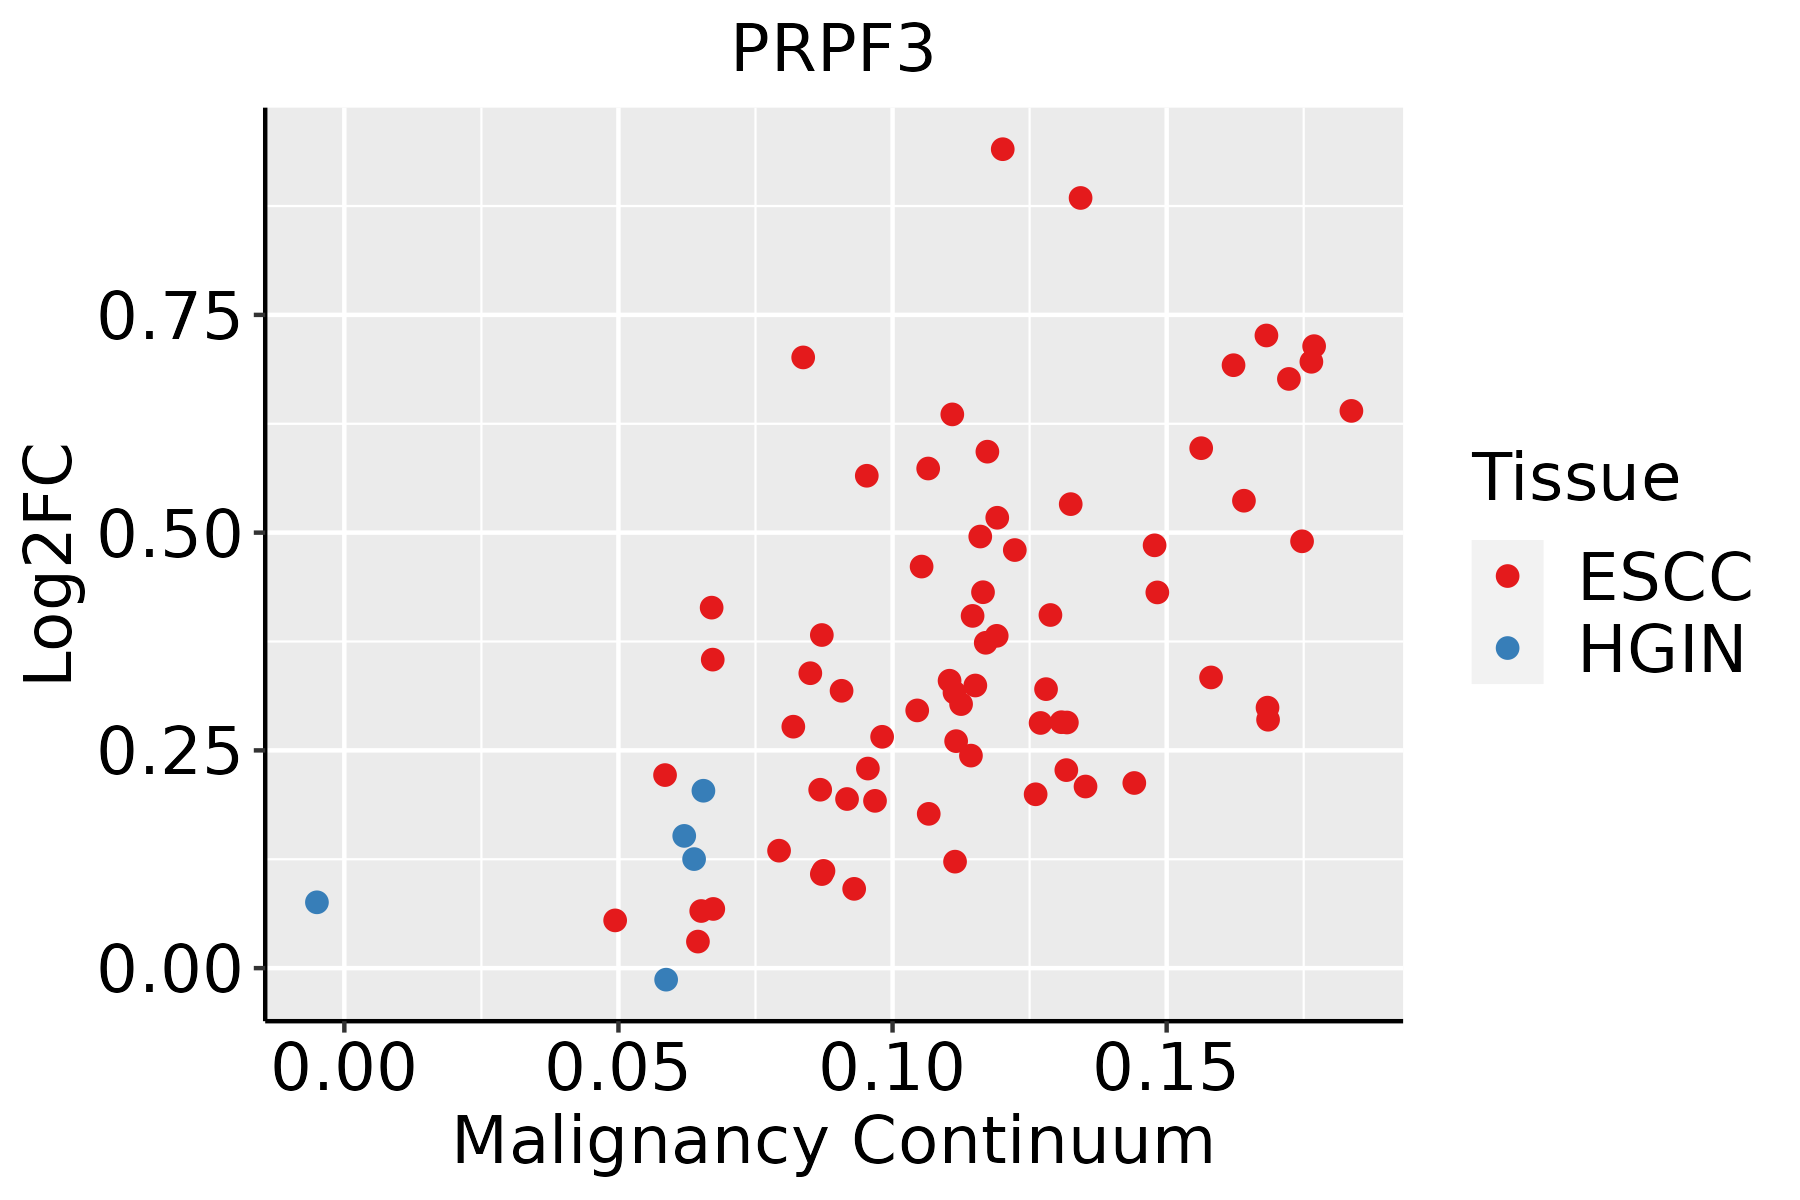 | ESCC: Esophageal squamous cell carcinoma |
| HGIN: High-grade intraepithelial neoplasias | ||
| LGIN: Low-grade intraepithelial neoplasias | ||
| Liver | 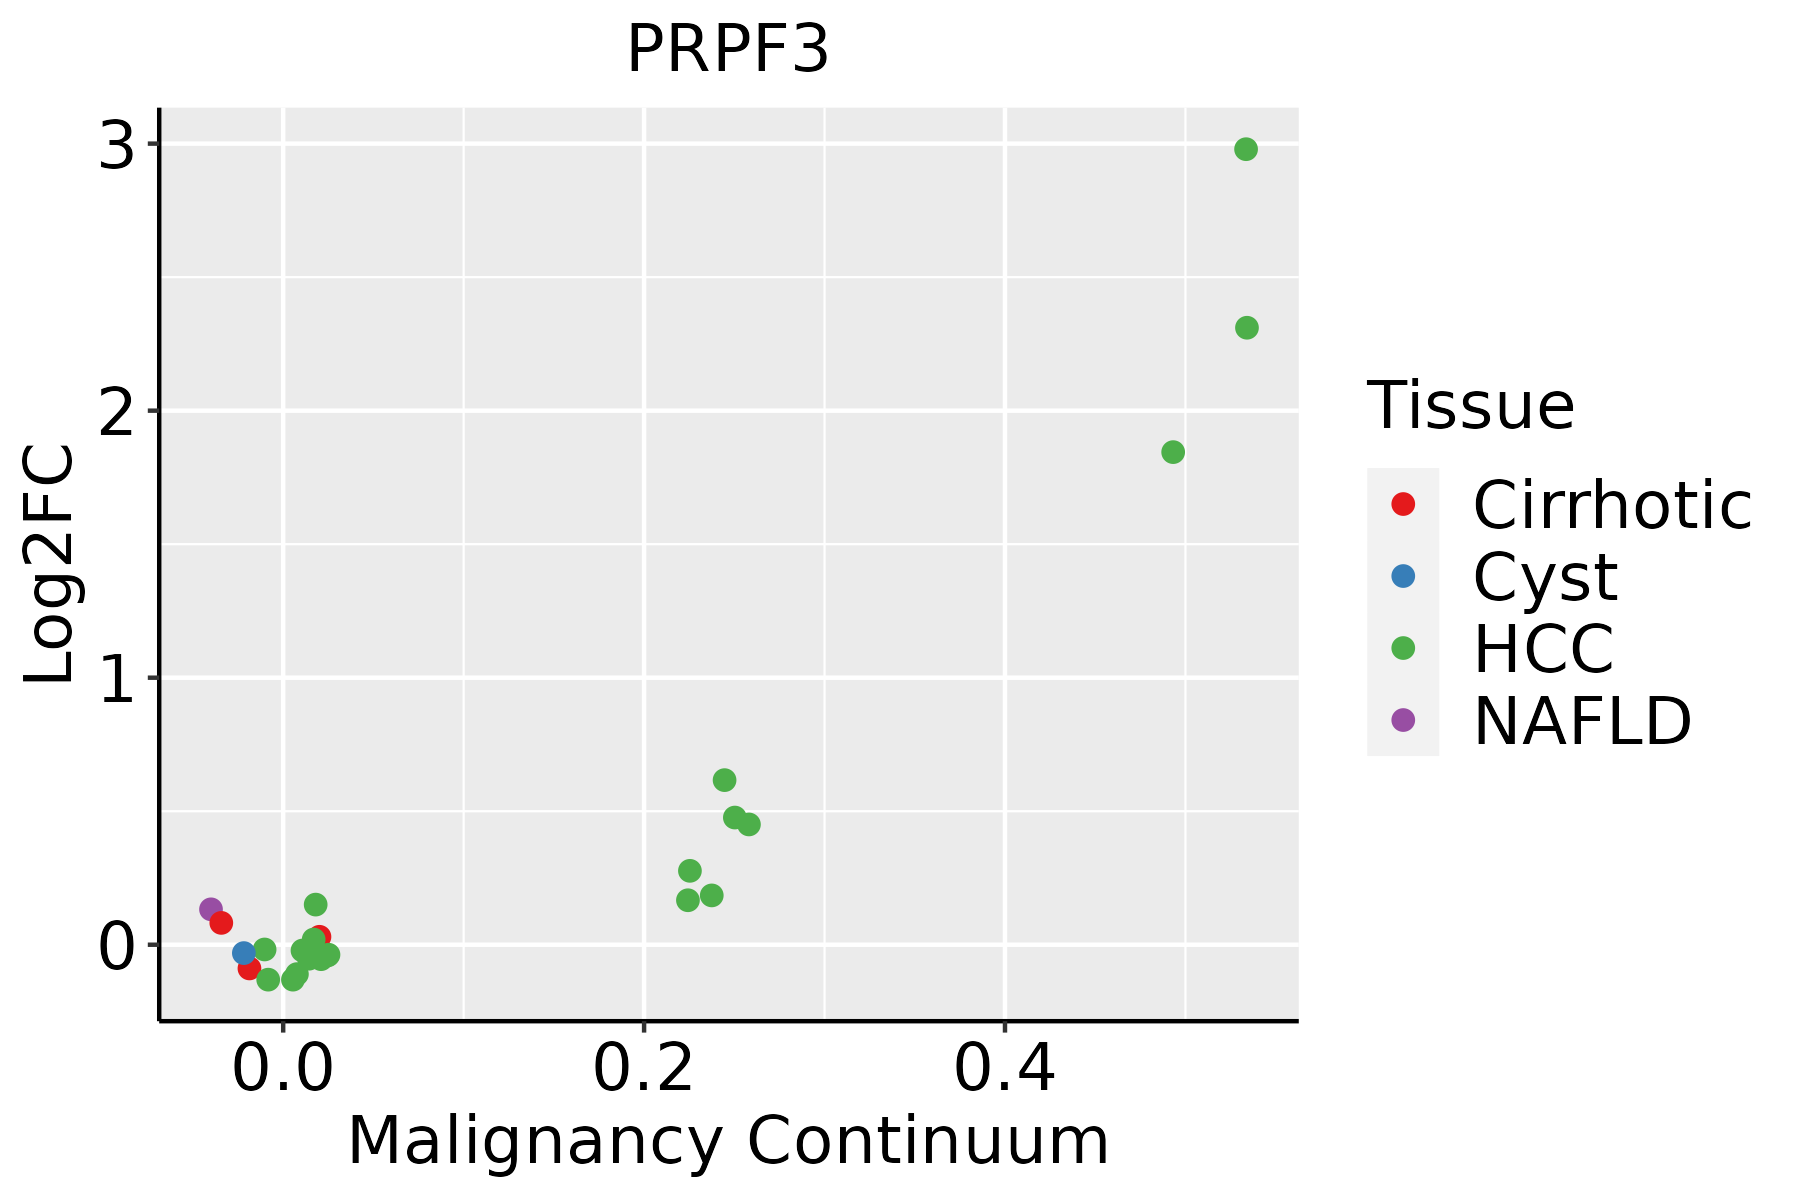 | HCC: Hepatocellular carcinoma |
| NAFLD: Non-alcoholic fatty liver disease |
| ∗log2FC in expression of this searched gene in stem-like cells from each diseased tissue sample relative to stem-like cells in normal samples in each tissue plotted against the malignancy continuum. Samples are colored based on if they are from different disease stage. |
Top |
Malignant transformation related pathway analysis |
| Find out the enriched GO biological processes and KEGG pathways involved in transition from healthy to precancer to cancer |
| Tissue | Disease Stage | Enriched GO biological Processes |
| Colorectum | AD |  |
| Colorectum | SER |  |
| Colorectum | MSS |  |
| Colorectum | MSI-H |  |
| Colorectum | FAP |  |
| ∗Top 15 enriched GO BP terms are showed in the bar plot of each disease state in each tissue. Each row represents a significant GO biological process which is colored according to the -log10(p.adjust). |
| Page: 1 2 3 4 5 6 7 8 9 |
| GO ID | Tissue | Disease Stage | Description | Gene Ratio | Bg Ratio | pvalue | p.adjust | Count |
| GO:0008380 | Colorectum | AD | RNA splicing | 169/3918 | 434/18723 | 3.59e-18 | 2.04e-15 | 169 |
| GO:00083804 | Colorectum | FAP | RNA splicing | 108/2622 | 434/18723 | 7.90e-10 | 1.86e-07 | 108 |
| GO:00083805 | Colorectum | CRC | RNA splicing | 90/2078 | 434/18723 | 2.80e-09 | 7.97e-07 | 90 |
| GO:000838016 | Endometrium | AEH | RNA splicing | 111/2100 | 434/18723 | 2.42e-17 | 1.12e-14 | 111 |
| GO:000838017 | Endometrium | EEC | RNA splicing | 111/2168 | 434/18723 | 2.45e-16 | 1.13e-13 | 111 |
| GO:000838026 | Esophagus | HGIN | RNA splicing | 160/2587 | 434/18723 | 3.74e-34 | 1.12e-30 | 160 |
| GO:002261327 | Esophagus | HGIN | ribonucleoprotein complex biogenesis | 158/2587 | 463/18723 | 2.61e-29 | 5.23e-26 | 158 |
| GO:000037520 | Esophagus | HGIN | RNA splicing, via transesterification reactions | 115/2587 | 324/18723 | 3.16e-23 | 3.80e-20 | 115 |
| GO:000037720 | Esophagus | HGIN | RNA splicing, via transesterification reactions with bulged adenosine as nucleophile | 113/2587 | 320/18723 | 1.24e-22 | 9.26e-20 | 113 |
| GO:000039820 | Esophagus | HGIN | mRNA splicing, via spliceosome | 113/2587 | 320/18723 | 1.24e-22 | 9.26e-20 | 113 |
| GO:007182627 | Esophagus | HGIN | ribonucleoprotein complex subunit organization | 84/2587 | 227/18723 | 1.34e-18 | 5.37e-16 | 84 |
| GO:002261827 | Esophagus | HGIN | ribonucleoprotein complex assembly | 82/2587 | 220/18723 | 2.07e-18 | 7.36e-16 | 82 |
| GO:00711665 | Esophagus | HGIN | ribonucleoprotein complex localization | 23/2587 | 77/18723 | 2.00e-04 | 3.72e-03 | 23 |
| GO:0022613111 | Esophagus | ESCC | ribonucleoprotein complex biogenesis | 365/8552 | 463/18723 | 1.74e-49 | 1.11e-45 | 365 |
| GO:0008380111 | Esophagus | ESCC | RNA splicing | 336/8552 | 434/18723 | 1.74e-42 | 3.67e-39 | 336 |
| GO:0000375111 | Esophagus | ESCC | RNA splicing, via transesterification reactions | 248/8552 | 324/18723 | 3.05e-30 | 1.49e-27 | 248 |
| GO:0000377111 | Esophagus | ESCC | RNA splicing, via transesterification reactions with bulged adenosine as nucleophile | 244/8552 | 320/18723 | 2.52e-29 | 1.07e-26 | 244 |
| GO:0000398111 | Esophagus | ESCC | mRNA splicing, via spliceosome | 244/8552 | 320/18723 | 2.52e-29 | 1.07e-26 | 244 |
| GO:0071826111 | Esophagus | ESCC | ribonucleoprotein complex subunit organization | 166/8552 | 227/18723 | 2.94e-17 | 2.42e-15 | 166 |
| GO:0022618111 | Esophagus | ESCC | ribonucleoprotein complex assembly | 159/8552 | 220/18723 | 8.19e-16 | 5.71e-14 | 159 |
| Page: 1 2 3 4 5 |
| Pathway ID | Tissue | Disease Stage | Description | Gene Ratio | Bg Ratio | pvalue | p.adjust | qvalue | Count |
| hsa0304027 | Esophagus | ESCC | Spliceosome | 128/4205 | 217/8465 | 3.31e-03 | 8.79e-03 | 4.50e-03 | 128 |
| hsa0304037 | Esophagus | ESCC | Spliceosome | 128/4205 | 217/8465 | 3.31e-03 | 8.79e-03 | 4.50e-03 | 128 |
| hsa0304022 | Liver | HCC | Spliceosome | 122/4020 | 217/8465 | 5.55e-03 | 1.60e-02 | 8.91e-03 | 122 |
| hsa0304032 | Liver | HCC | Spliceosome | 122/4020 | 217/8465 | 5.55e-03 | 1.60e-02 | 8.91e-03 | 122 |
| Page: 1 |
Top |
Cell-cell communication analysis |
| Identification of potential cell-cell interactions between two cell types and their ligand-receptor pairs for different disease states |
| Ligand | Receptor | LRpair | Pathway | Tissue | Disease Stage |
| Page: 1 |
Top |
Single-cell gene regulatory network inference analysis |
| Find out the significant the regulons (TFs) and the target genes of each regulon across cell types for different disease states |
| TF | Cell Type | Tissue | Disease Stage | Target Gene | RSS | Regulon Activity |
| ∗The dot plots of a searched regulon are shown for all cell subpopulations in each disease state of each tissue based on the regulon specific score inferred using pySCENIC and by calculating the average expression. |
| Page: 1 |
Top |
Somatic mutation of malignant transformation related genes |
| Annotation of somatic variants for genes involved in malignant transformation |
| Hugo Symbol | Variant Class | Variant Classification | dbSNP RS | HGVSc | HGVSp | HGVSp Short | SWISSPROT | BIOTYPE | SIFT | PolyPhen | Tumor Sample Barcode | Tissue | Histology | Sex | Age | Stage | Therapy Types | Drugs | Outcome |
| PRPF3 | SNV | Missense_Mutation | c.770N>C | p.Ile257Thr | p.I257T | O43395 | protein_coding | deleterious(0) | possibly_damaging(0.642) | TCGA-B6-A0IC-01 | Breast | breast invasive carcinoma | Female | >=65 | I/II | Unknown | Unknown | SD | |
| PRPF3 | SNV | Missense_Mutation | c.2041T>A | p.Ser681Thr | p.S681T | O43395 | protein_coding | tolerated(0.49) | benign(0.001) | TCGA-BH-A0BL-01 | Breast | breast invasive carcinoma | Female | <65 | I/II | Chemotherapy | adriamycin | CR | |
| PRPF3 | SNV | Missense_Mutation | c.1052N>A | p.Leu351Gln | p.L351Q | O43395 | protein_coding | deleterious(0) | probably_damaging(0.999) | TCGA-D8-A1XK-01 | Breast | breast invasive carcinoma | Female | <65 | I/II | Chemotherapy | doxorubicine+cyclophosphamide | SD | |
| PRPF3 | insertion | Frame_Shift_Ins | novel | c.1812_1813insCAAGTAAAAA | p.Asp605GlnfsTer5 | p.D605Qfs*5 | O43395 | protein_coding | TCGA-A8-A08C-01 | Breast | breast invasive carcinoma | Female | >=65 | I/II | Chemotherapy | 5-fluorouracil | CR | ||
| PRPF3 | insertion | Frame_Shift_Ins | novel | c.1759_1759+1insCGCGATCTCAGCGCACTGCAACCTCTGCCTCCCAAGTTCAA | p.Gly587AlafsTer30 | p.G587Afs*30 | O43395 | protein_coding | TCGA-A8-A08H-01 | Breast | breast invasive carcinoma | Female | >=65 | I/II | Unknown | Unknown | SD | ||
| PRPF3 | SNV | Missense_Mutation | novel | c.142G>A | p.Ala48Thr | p.A48T | O43395 | protein_coding | tolerated(0.59) | benign(0.023) | TCGA-2W-A8YY-01 | Cervix | cervical & endocervical cancer | Female | <65 | I/II | Chemotherapy | cisplatin | CR |
| PRPF3 | SNV | Missense_Mutation | rs782508157 | c.344G>A | p.Arg115His | p.R115H | O43395 | protein_coding | deleterious(0.04) | benign(0) | TCGA-2W-A8YY-01 | Cervix | cervical & endocervical cancer | Female | <65 | I/II | Chemotherapy | cisplatin | CR |
| PRPF3 | SNV | Missense_Mutation | novel | c.937C>T | p.Pro313Ser | p.P313S | O43395 | protein_coding | tolerated(0.23) | benign(0.04) | TCGA-2W-A8YY-01 | Cervix | cervical & endocervical cancer | Female | <65 | I/II | Chemotherapy | cisplatin | CR |
| PRPF3 | SNV | Missense_Mutation | c.603G>C | p.Glu201Asp | p.E201D | O43395 | protein_coding | tolerated(0.33) | benign(0.005) | TCGA-C5-A3HE-01 | Cervix | cervical & endocervical cancer | Female | <65 | I/II | Unknown | Unknown | PD | |
| PRPF3 | SNV | Missense_Mutation | c.736N>C | p.Glu246Gln | p.E246Q | O43395 | protein_coding | tolerated(0.33) | benign(0.099) | TCGA-EA-A78R-01 | Cervix | cervical & endocervical cancer | Female | <65 | I/II | Unknown | Unknown | SD |
| Page: 1 2 3 4 5 6 7 8 |
Top |
Related drugs of malignant transformation related genes |
| Identification of chemicals and drugs interact with genes involved in malignant transfromation |
| (DGIdb 4.0) |
| Entrez ID | Symbol | Category | Interaction Types | Drug Claim Name | Drug Name | PMIDs |
| Page: 1 |

Copyright 2023-Present -The University of Texas Health Science Center at Houston |