
|
|||||
|
 | |
| |
| |
| |
| |
| |
|
Gene: PRPF18 |
Gene summary for PRPF18 |
| Gene information | Species | Human | Gene symbol | PRPF18 | Gene ID | 8559 |
| Gene name | pre-mRNA processing factor 18 | |
| Gene Alias | PRP18 | |
| Cytomap | 10p13 | |
| Gene Type | protein-coding | GO ID | GO:0000350 | UniProtAcc | Q99633 |
Top |
Malignant transformation analysis |
| Identification of the aberrant gene expression in precancerous and cancerous lesions by comparing the gene expression of stem-like cells in diseased tissues with normal stem cells |
| Entrez ID | Symbol | Replicates | Species | Organ | Tissue | Adj P-value | Log2FC | Malignancy |
| 8559 | PRPF18 | LZE4T | Human | Esophagus | ESCC | 6.93e-12 | 1.94e-01 | 0.0811 |
| 8559 | PRPF18 | LZE5T | Human | Esophagus | ESCC | 1.14e-02 | 1.18e-01 | 0.0514 |
| 8559 | PRPF18 | LZE7T | Human | Esophagus | ESCC | 1.82e-08 | 1.62e-01 | 0.0667 |
| 8559 | PRPF18 | LZE8T | Human | Esophagus | ESCC | 1.16e-02 | 3.98e-02 | 0.067 |
| 8559 | PRPF18 | LZE24T | Human | Esophagus | ESCC | 3.64e-21 | 4.88e-01 | 0.0596 |
| 8559 | PRPF18 | P1T-E | Human | Esophagus | ESCC | 9.17e-09 | 3.27e-01 | 0.0875 |
| 8559 | PRPF18 | P2T-E | Human | Esophagus | ESCC | 4.34e-17 | 2.02e-01 | 0.1177 |
| 8559 | PRPF18 | P4T-E | Human | Esophagus | ESCC | 2.41e-21 | 3.49e-01 | 0.1323 |
| 8559 | PRPF18 | P5T-E | Human | Esophagus | ESCC | 2.60e-15 | 1.80e-01 | 0.1327 |
| 8559 | PRPF18 | P8T-E | Human | Esophagus | ESCC | 1.01e-15 | 2.74e-01 | 0.0889 |
| 8559 | PRPF18 | P9T-E | Human | Esophagus | ESCC | 3.76e-07 | 1.04e-01 | 0.1131 |
| 8559 | PRPF18 | P10T-E | Human | Esophagus | ESCC | 1.06e-21 | 1.88e-01 | 0.116 |
| 8559 | PRPF18 | P11T-E | Human | Esophagus | ESCC | 4.55e-14 | 4.92e-01 | 0.1426 |
| 8559 | PRPF18 | P12T-E | Human | Esophagus | ESCC | 1.77e-28 | 4.66e-01 | 0.1122 |
| 8559 | PRPF18 | P15T-E | Human | Esophagus | ESCC | 9.33e-21 | 3.48e-01 | 0.1149 |
| 8559 | PRPF18 | P16T-E | Human | Esophagus | ESCC | 1.94e-16 | 3.60e-01 | 0.1153 |
| 8559 | PRPF18 | P17T-E | Human | Esophagus | ESCC | 1.17e-03 | 2.10e-01 | 0.1278 |
| 8559 | PRPF18 | P19T-E | Human | Esophagus | ESCC | 1.47e-03 | 4.67e-01 | 0.1662 |
| 8559 | PRPF18 | P20T-E | Human | Esophagus | ESCC | 2.04e-11 | 2.03e-01 | 0.1124 |
| 8559 | PRPF18 | P21T-E | Human | Esophagus | ESCC | 8.75e-26 | 4.16e-01 | 0.1617 |
| Page: 1 2 3 4 5 |
| Tissue | Expression Dynamics | Abbreviation |
| Esophagus | 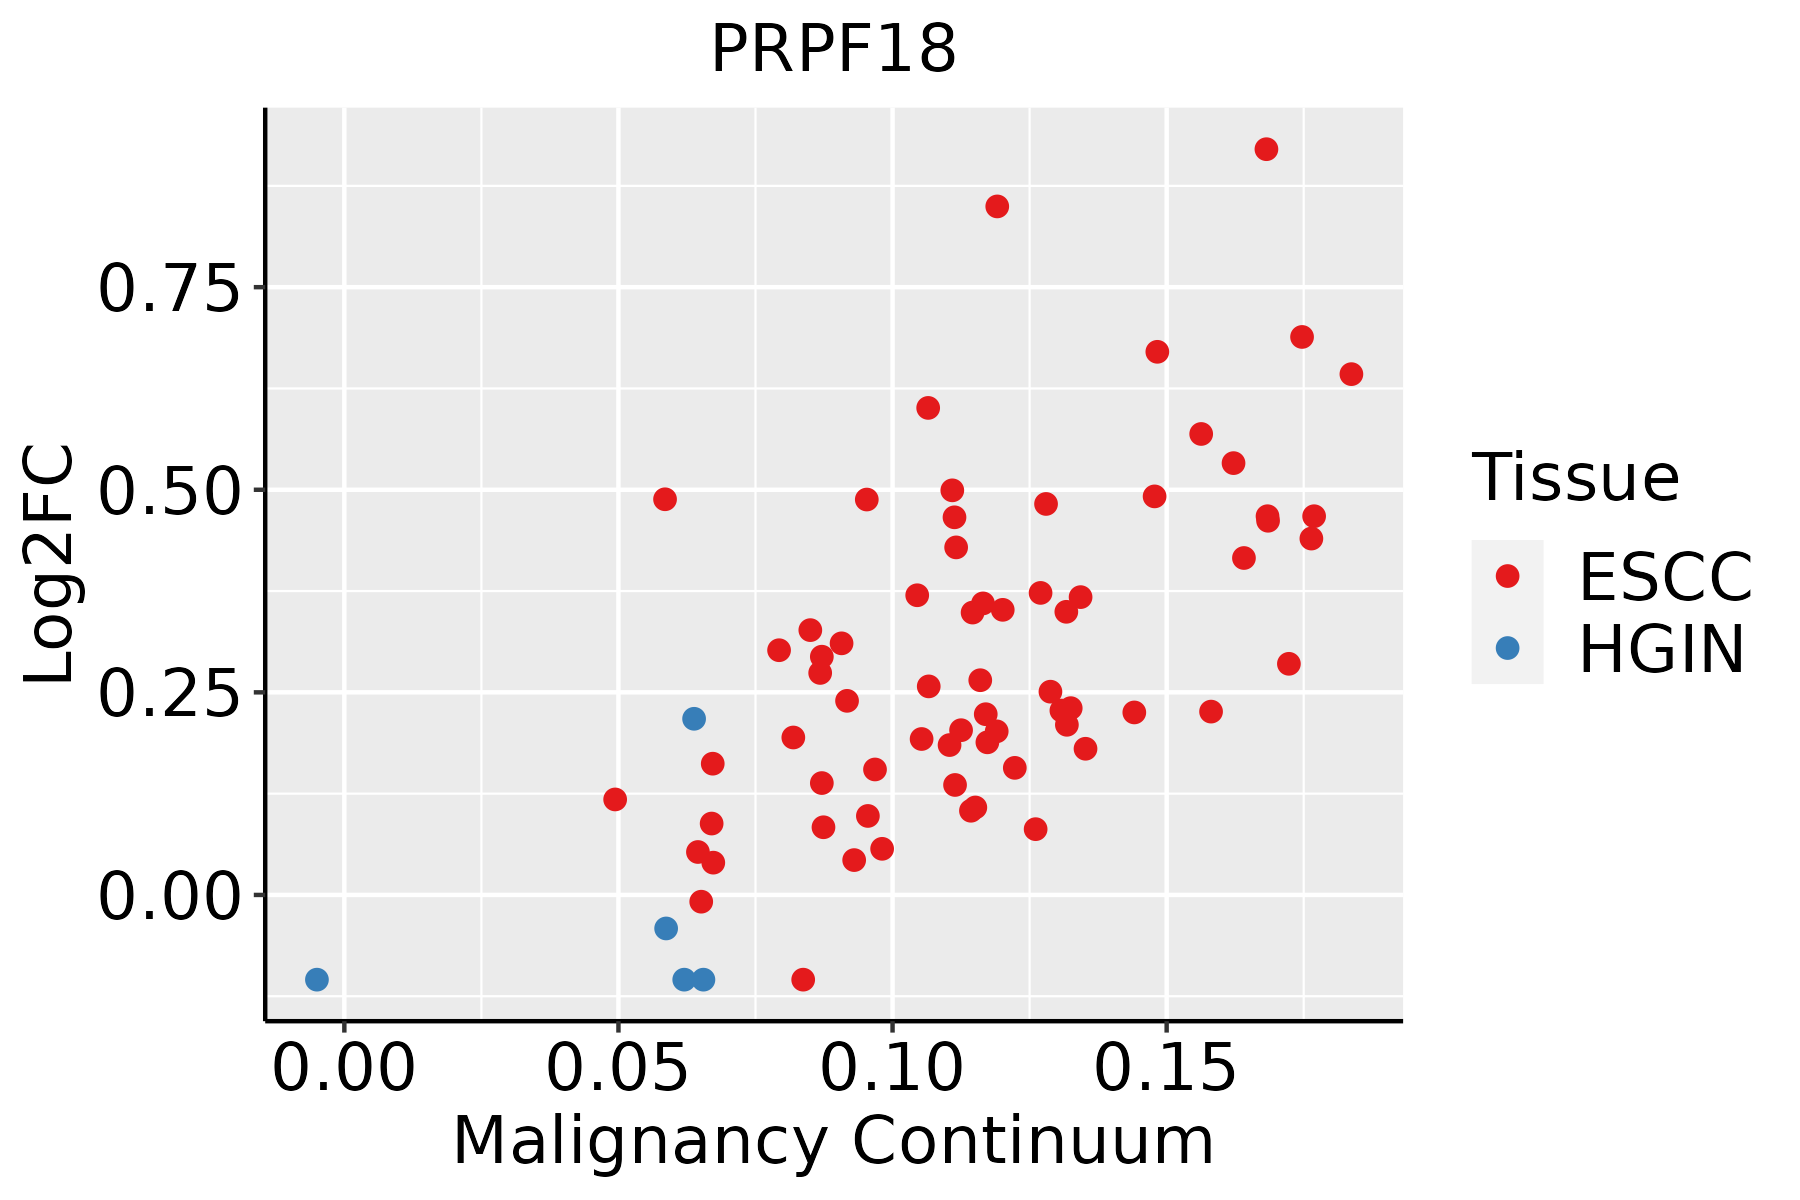 | ESCC: Esophageal squamous cell carcinoma |
| HGIN: High-grade intraepithelial neoplasias | ||
| LGIN: Low-grade intraepithelial neoplasias | ||
| Liver |  | HCC: Hepatocellular carcinoma |
| NAFLD: Non-alcoholic fatty liver disease | ||
| Oral Cavity |  | EOLP: Erosive Oral lichen planus |
| LP: leukoplakia | ||
| NEOLP: Non-erosive oral lichen planus | ||
| OSCC: Oral squamous cell carcinoma | ||
| Skin | 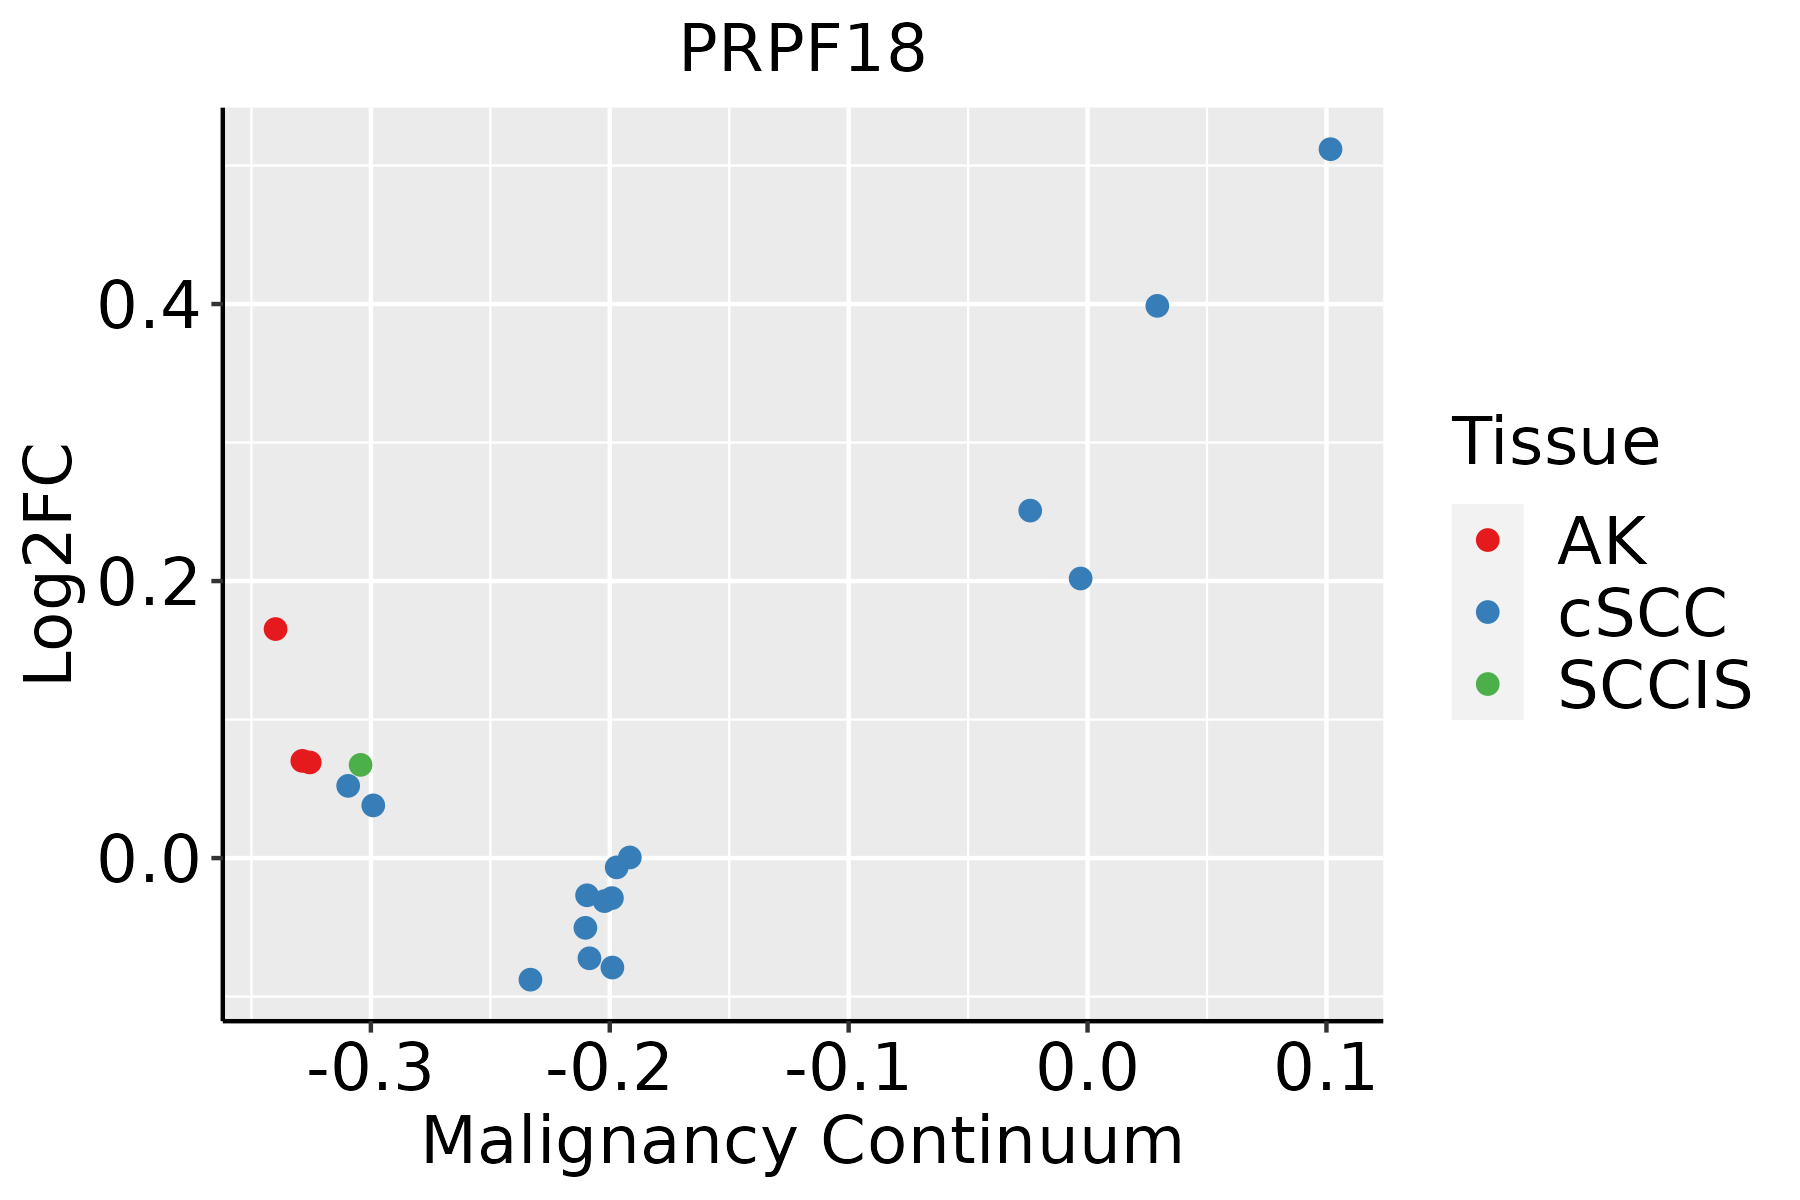 | AK: Actinic keratosis |
| cSCC: Cutaneous squamous cell carcinoma | ||
| SCCIS:squamous cell carcinoma in situ | ||
| Thyroid | 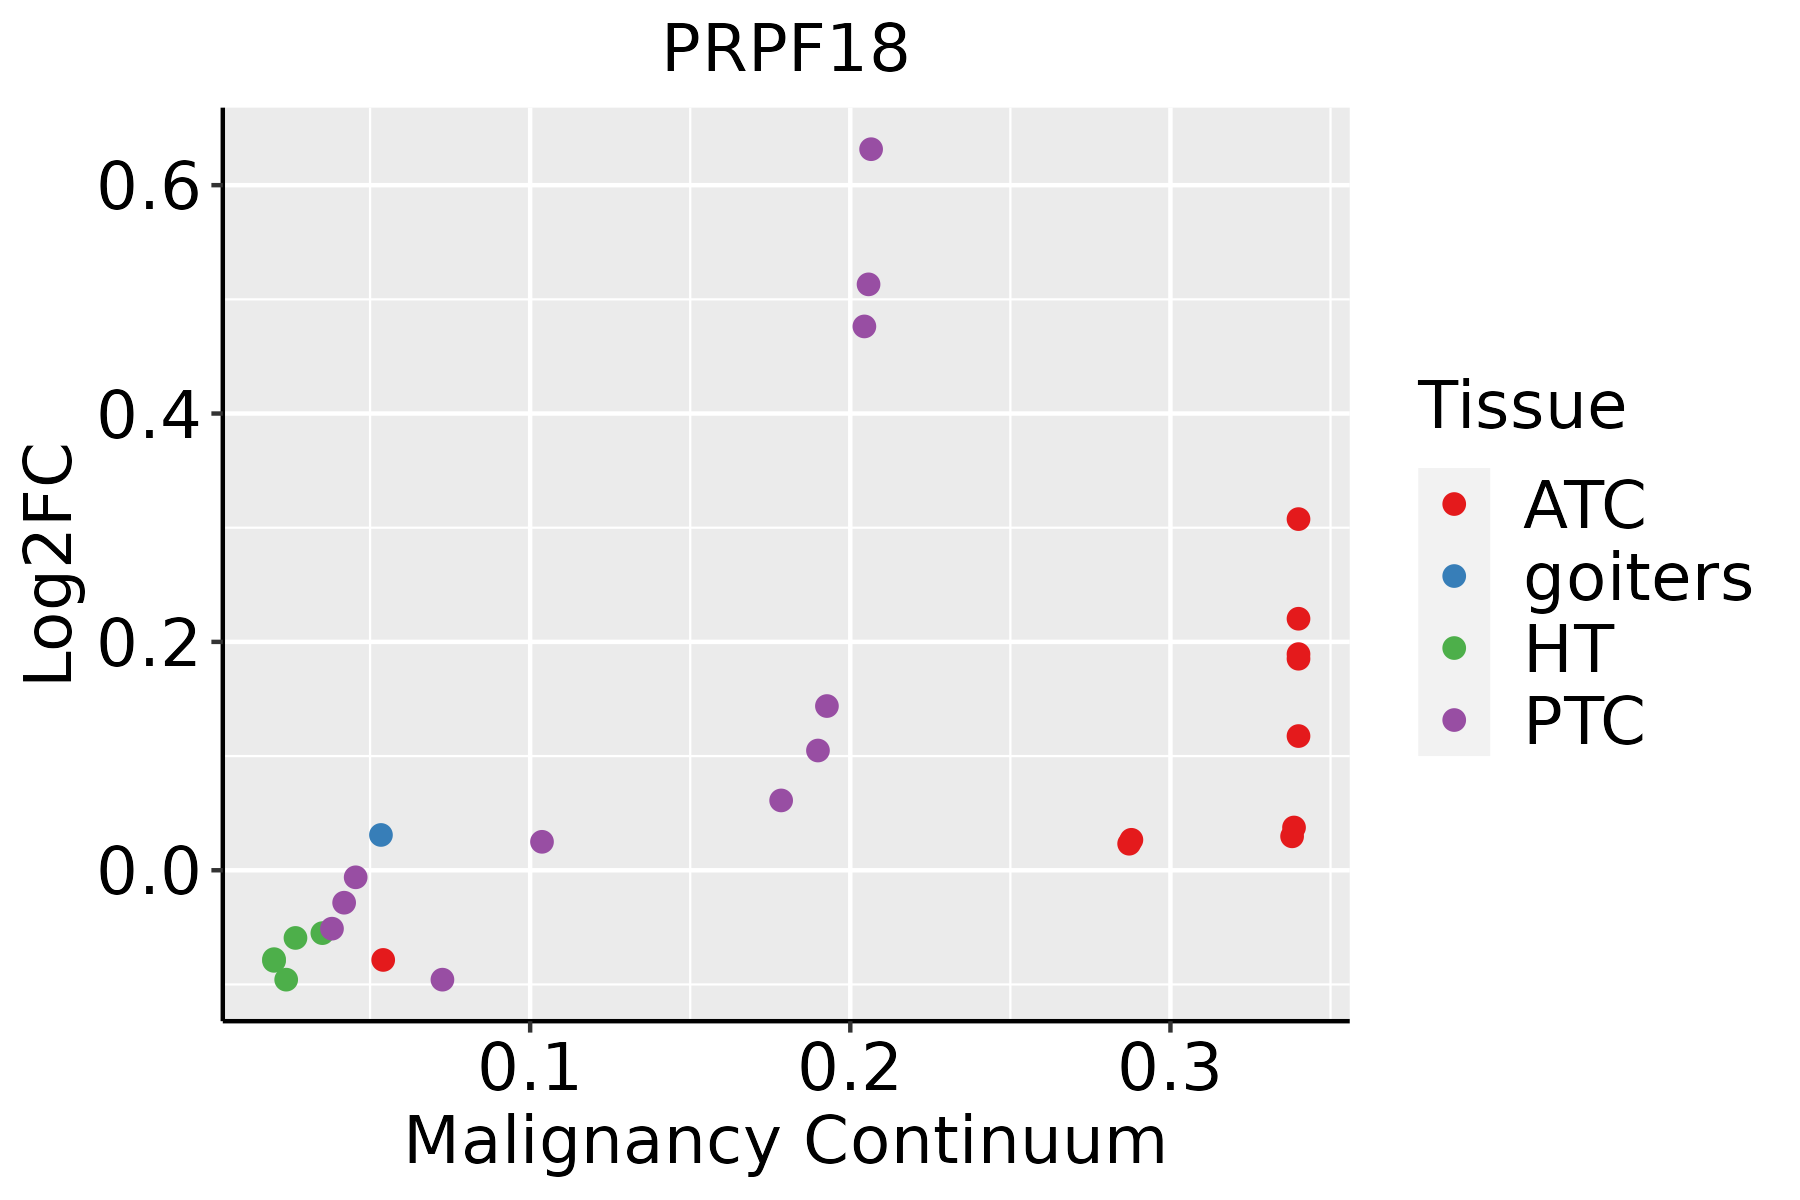 | ATC: Anaplastic thyroid cancer |
| HT: Hashimoto's thyroiditis | ||
| PTC: Papillary thyroid cancer |
| ∗log2FC in expression of this searched gene in stem-like cells from each diseased tissue sample relative to stem-like cells in normal samples in each tissue plotted against the malignancy continuum. Samples are colored based on if they are from different disease stage. |
Top |
Malignant transformation related pathway analysis |
| Find out the enriched GO biological processes and KEGG pathways involved in transition from healthy to precancer to cancer |
| Tissue | Disease Stage | Enriched GO biological Processes |
| Colorectum | AD |  |
| Colorectum | SER |  |
| Colorectum | MSS |  |
| Colorectum | MSI-H |  |
| Colorectum | FAP |  |
| ∗Top 15 enriched GO BP terms are showed in the bar plot of each disease state in each tissue. Each row represents a significant GO biological process which is colored according to the -log10(p.adjust). |
| Page: 1 2 3 4 5 6 7 8 9 |
| GO ID | Tissue | Disease Stage | Description | Gene Ratio | Bg Ratio | pvalue | p.adjust | Count |
| GO:0022613111 | Esophagus | ESCC | ribonucleoprotein complex biogenesis | 365/8552 | 463/18723 | 1.74e-49 | 1.11e-45 | 365 |
| GO:0008380111 | Esophagus | ESCC | RNA splicing | 336/8552 | 434/18723 | 1.74e-42 | 3.67e-39 | 336 |
| GO:0000375111 | Esophagus | ESCC | RNA splicing, via transesterification reactions | 248/8552 | 324/18723 | 3.05e-30 | 1.49e-27 | 248 |
| GO:0000377111 | Esophagus | ESCC | RNA splicing, via transesterification reactions with bulged adenosine as nucleophile | 244/8552 | 320/18723 | 2.52e-29 | 1.07e-26 | 244 |
| GO:0000398111 | Esophagus | ESCC | mRNA splicing, via spliceosome | 244/8552 | 320/18723 | 2.52e-29 | 1.07e-26 | 244 |
| GO:0006403110 | Esophagus | ESCC | RNA localization | 166/8552 | 201/18723 | 1.95e-27 | 6.18e-25 | 166 |
| GO:0006401110 | Esophagus | ESCC | RNA catabolic process | 204/8552 | 278/18723 | 3.39e-21 | 5.66e-19 | 204 |
| GO:0034655110 | Esophagus | ESCC | nucleobase-containing compound catabolic process | 272/8552 | 407/18723 | 2.92e-18 | 2.90e-16 | 272 |
| GO:0006402110 | Esophagus | ESCC | mRNA catabolic process | 170/8552 | 232/18723 | 8.70e-18 | 8.00e-16 | 170 |
| GO:0071826111 | Esophagus | ESCC | ribonucleoprotein complex subunit organization | 166/8552 | 227/18723 | 2.94e-17 | 2.42e-15 | 166 |
| GO:0022618111 | Esophagus | ESCC | ribonucleoprotein complex assembly | 159/8552 | 220/18723 | 8.19e-16 | 5.71e-14 | 159 |
| GO:004670018 | Esophagus | ESCC | heterocycle catabolic process | 286/8552 | 445/18723 | 1.12e-15 | 7.47e-14 | 286 |
| GO:004427019 | Esophagus | ESCC | cellular nitrogen compound catabolic process | 288/8552 | 451/18723 | 3.03e-15 | 1.79e-13 | 288 |
| GO:001943918 | Esophagus | ESCC | aromatic compound catabolic process | 295/8552 | 467/18723 | 1.09e-14 | 5.98e-13 | 295 |
| GO:190136118 | Esophagus | ESCC | organic cyclic compound catabolic process | 307/8552 | 495/18723 | 9.99e-14 | 4.80e-12 | 307 |
| GO:000095618 | Esophagus | ESCC | nuclear-transcribed mRNA catabolic process | 88/8552 | 112/18723 | 9.41e-13 | 4.14e-11 | 88 |
| GO:00710252 | Esophagus | ESCC | RNA surveillance | 14/8552 | 15/18723 | 1.47e-04 | 9.85e-04 | 14 |
| GO:00710273 | Esophagus | ESCC | nuclear RNA surveillance | 12/8552 | 13/18723 | 6.18e-04 | 3.32e-03 | 12 |
| GO:00710283 | Esophagus | ESCC | nuclear mRNA surveillance | 12/8552 | 13/18723 | 6.18e-04 | 3.32e-03 | 12 |
| GO:00082983 | Esophagus | ESCC | intracellular mRNA localization | 11/8552 | 13/18723 | 4.76e-03 | 1.85e-02 | 11 |
| Page: 1 2 3 4 5 6 7 |
| Pathway ID | Tissue | Disease Stage | Description | Gene Ratio | Bg Ratio | pvalue | p.adjust | qvalue | Count |
| hsa0304027 | Esophagus | ESCC | Spliceosome | 128/4205 | 217/8465 | 3.31e-03 | 8.79e-03 | 4.50e-03 | 128 |
| hsa0304037 | Esophagus | ESCC | Spliceosome | 128/4205 | 217/8465 | 3.31e-03 | 8.79e-03 | 4.50e-03 | 128 |
| hsa0304022 | Liver | HCC | Spliceosome | 122/4020 | 217/8465 | 5.55e-03 | 1.60e-02 | 8.91e-03 | 122 |
| hsa0304032 | Liver | HCC | Spliceosome | 122/4020 | 217/8465 | 5.55e-03 | 1.60e-02 | 8.91e-03 | 122 |
| hsa0304016 | Oral cavity | OSCC | Spliceosome | 123/3704 | 217/8465 | 7.21e-05 | 2.74e-04 | 1.40e-04 | 123 |
| hsa0304017 | Oral cavity | OSCC | Spliceosome | 123/3704 | 217/8465 | 7.21e-05 | 2.74e-04 | 1.40e-04 | 123 |
| hsa0304026 | Oral cavity | LP | Spliceosome | 106/2418 | 217/8465 | 1.30e-10 | 2.40e-09 | 1.55e-09 | 106 |
| hsa0304036 | Oral cavity | LP | Spliceosome | 106/2418 | 217/8465 | 1.30e-10 | 2.40e-09 | 1.55e-09 | 106 |
| Page: 1 |
Top |
Cell-cell communication analysis |
| Identification of potential cell-cell interactions between two cell types and their ligand-receptor pairs for different disease states |
| Ligand | Receptor | LRpair | Pathway | Tissue | Disease Stage |
| Page: 1 |
Top |
Single-cell gene regulatory network inference analysis |
| Find out the significant the regulons (TFs) and the target genes of each regulon across cell types for different disease states |
| TF | Cell Type | Tissue | Disease Stage | Target Gene | RSS | Regulon Activity |
| ∗The dot plots of a searched regulon are shown for all cell subpopulations in each disease state of each tissue based on the regulon specific score inferred using pySCENIC and by calculating the average expression. |
| Page: 1 |
Top |
Somatic mutation of malignant transformation related genes |
| Annotation of somatic variants for genes involved in malignant transformation |
| Hugo Symbol | Variant Class | Variant Classification | dbSNP RS | HGVSc | HGVSp | HGVSp Short | SWISSPROT | BIOTYPE | SIFT | PolyPhen | Tumor Sample Barcode | Tissue | Histology | Sex | Age | Stage | Therapy Types | Drugs | Outcome |
| PRPF18 | SNV | Missense_Mutation | c.137N>A | p.Gly46Asp | p.G46D | Q99633 | protein_coding | tolerated(0.08) | benign(0.215) | TCGA-A8-A09Z-01 | Breast | breast invasive carcinoma | Female | >=65 | I/II | Unknown | Unknown | SD | |
| PRPF18 | SNV | Missense_Mutation | c.381N>C | p.Leu127Phe | p.L127F | Q99633 | protein_coding | tolerated(1) | benign(0.005) | TCGA-EK-A2R8-01 | Cervix | cervical & endocervical cancer | Female | <65 | I/II | Unknown | Unknown | SD | |
| PRPF18 | SNV | Missense_Mutation | c.881N>A | p.Arg294Lys | p.R294K | Q99633 | protein_coding | deleterious(0.02) | probably_damaging(0.969) | TCGA-IR-A3LI-01 | Cervix | cervical & endocervical cancer | Female | <65 | I/II | Chemotherapy | cisplatin | CR | |
| PRPF18 | SNV | Missense_Mutation | rs372960380 | c.502N>C | p.Glu168Gln | p.E168Q | Q99633 | protein_coding | deleterious(0.05) | possibly_damaging(0.68) | TCGA-ZJ-AAXU-01 | Cervix | cervical & endocervical cancer | Female | <65 | I/II | Unknown | Unknown | SD |
| PRPF18 | SNV | Missense_Mutation | c.866N>G | p.His289Arg | p.H289R | Q99633 | protein_coding | deleterious(0) | probably_damaging(1) | TCGA-AA-3848-01 | Colorectum | colon adenocarcinoma | Female | >=65 | III/IV | Unknown | Unknown | PD | |
| PRPF18 | SNV | Missense_Mutation | c.203N>G | p.Leu68Arg | p.L68R | Q99633 | protein_coding | tolerated(0.55) | benign(0.005) | TCGA-AA-A010-01 | Colorectum | colon adenocarcinoma | Female | <65 | I/II | Chemotherapy | folinic | CR | |
| PRPF18 | SNV | Missense_Mutation | c.862N>T | p.Ile288Phe | p.I288F | Q99633 | protein_coding | deleterious(0) | probably_damaging(0.997) | TCGA-AD-6895-01 | Colorectum | colon adenocarcinoma | Male | >=65 | III/IV | Unknown | Unknown | SD | |
| PRPF18 | SNV | Missense_Mutation | c.752N>T | p.Thr251Met | p.T251M | Q99633 | protein_coding | deleterious(0.04) | probably_damaging(0.92) | TCGA-AZ-4313-01 | Colorectum | colon adenocarcinoma | Female | <65 | I/II | Unknown | Unknown | SD | |
| PRPF18 | SNV | Missense_Mutation | c.640N>A | p.Val214Met | p.V214M | Q99633 | protein_coding | tolerated(0.21) | benign(0.082) | TCGA-G4-6628-01 | Colorectum | colon adenocarcinoma | Male | >=65 | I/II | Unknown | Unknown | SD | |
| PRPF18 | SNV | Missense_Mutation | c.764N>C | p.Lys255Thr | p.K255T | Q99633 | protein_coding | tolerated(0.09) | possibly_damaging(0.716) | TCGA-AG-3892-01 | Colorectum | rectum adenocarcinoma | Female | <65 | I/II | Unknown | Unknown | SD |
| Page: 1 2 3 4 |
Top |
Related drugs of malignant transformation related genes |
| Identification of chemicals and drugs interact with genes involved in malignant transfromation |
| (DGIdb 4.0) |
| Entrez ID | Symbol | Category | Interaction Types | Drug Claim Name | Drug Name | PMIDs |
| Page: 1 |

Copyright 2023-Present -The University of Texas Health Science Center at Houston |