
|
|||||
|
 | |
| |
| |
| |
| |
| |
|
Gene: PROZ |
Gene summary for PROZ |
| Gene information | Species | Human | Gene symbol | PROZ | Gene ID | 8858 |
| Gene name | protein Z, vitamin K dependent plasma glycoprotein | |
| Gene Alias | PZ | |
| Cytomap | 13q34 | |
| Gene Type | protein-coding | GO ID | GO:0006508 | UniProtAcc | P22891 |
Top |
Malignant transformation analysis |
| Identification of the aberrant gene expression in precancerous and cancerous lesions by comparing the gene expression of stem-like cells in diseased tissues with normal stem cells |
| Entrez ID | Symbol | Replicates | Species | Organ | Tissue | Adj P-value | Log2FC | Malignancy |
| 8858 | PROZ | NAFLD1 | Human | Liver | NAFLD | 1.73e-06 | 6.84e-01 | -0.04 |
| 8858 | PROZ | HCC1_Meng | Human | Liver | HCC | 1.64e-13 | -1.30e-02 | 0.0246 |
| 8858 | PROZ | S014 | Human | Liver | HCC | 8.14e-05 | 3.37e-01 | 0.2254 |
| 8858 | PROZ | S015 | Human | Liver | HCC | 1.53e-10 | 6.77e-01 | 0.2375 |
| 8858 | PROZ | S016 | Human | Liver | HCC | 3.10e-07 | 4.42e-01 | 0.2243 |
| Page: 1 |
| Tissue | Expression Dynamics | Abbreviation |
| Liver | 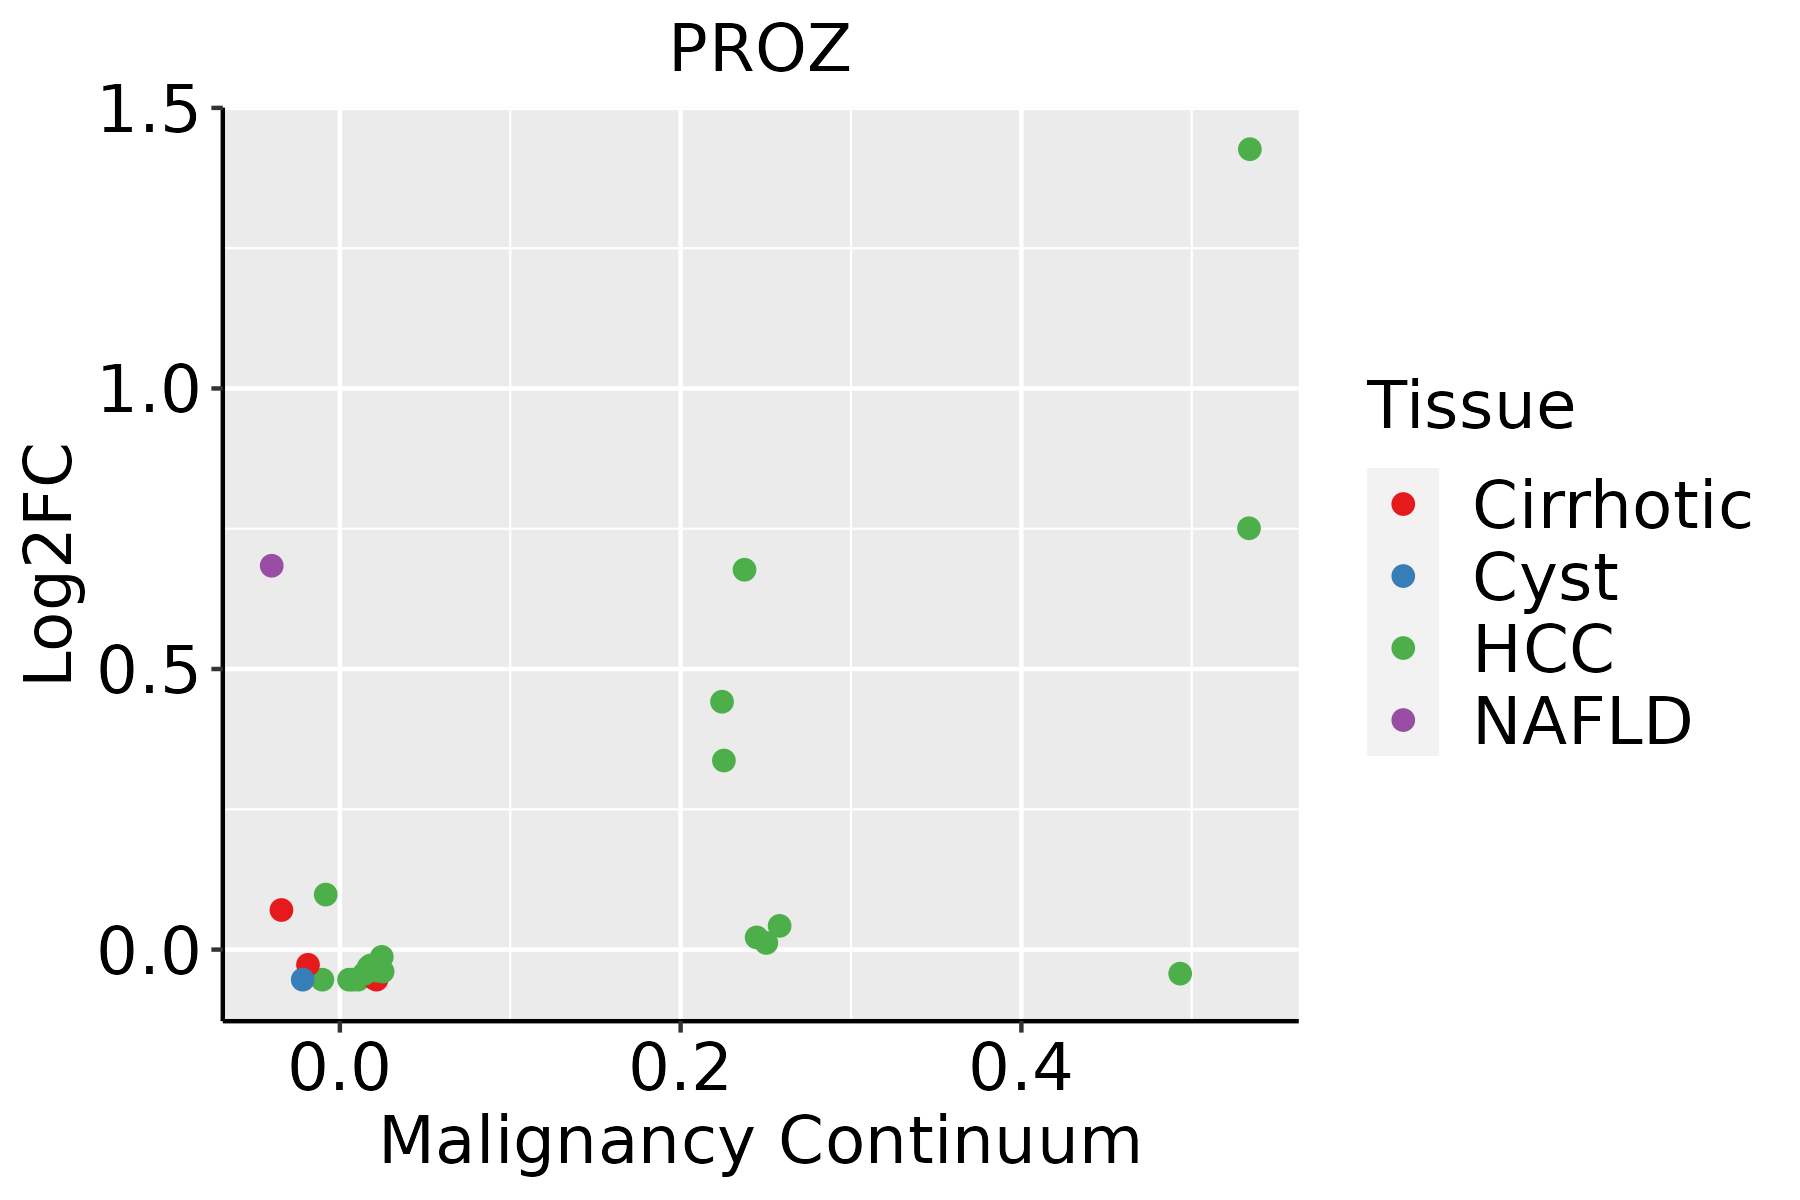 | HCC: Hepatocellular carcinoma |
| NAFLD: Non-alcoholic fatty liver disease |
| ∗log2FC in expression of this searched gene in stem-like cells from each diseased tissue sample relative to stem-like cells in normal samples in each tissue plotted against the malignancy continuum. Samples are colored based on if they are from different disease stage. |
Top |
Malignant transformation related pathway analysis |
| Find out the enriched GO biological processes and KEGG pathways involved in transition from healthy to precancer to cancer |
| Tissue | Disease Stage | Enriched GO biological Processes |
| Colorectum | AD |  |
| Colorectum | SER |  |
| Colorectum | MSS |  |
| Colorectum | MSI-H |  |
| Colorectum | FAP |  |
| ∗Top 15 enriched GO BP terms are showed in the bar plot of each disease state in each tissue. Each row represents a significant GO biological process which is colored according to the -log10(p.adjust). |
| Page: 1 2 3 4 5 6 7 8 9 |
| GO ID | Tissue | Disease Stage | Description | Gene Ratio | Bg Ratio | pvalue | p.adjust | Count |
| GO:00420607 | Liver | NAFLD | wound healing | 84/1882 | 422/18723 | 6.56e-10 | 1.37e-07 | 84 |
| GO:00075994 | Liver | NAFLD | hemostasis | 49/1882 | 222/18723 | 9.23e-08 | 7.59e-06 | 49 |
| GO:00075964 | Liver | NAFLD | blood coagulation | 48/1882 | 217/18723 | 1.16e-07 | 8.81e-06 | 48 |
| GO:00508174 | Liver | NAFLD | coagulation | 48/1882 | 222/18723 | 2.40e-07 | 1.61e-05 | 48 |
| GO:00508787 | Liver | NAFLD | regulation of body fluid levels | 60/1882 | 379/18723 | 2.61e-04 | 4.23e-03 | 60 |
| GO:004206022 | Liver | HCC | wound healing | 219/7958 | 422/18723 | 5.34e-05 | 5.04e-04 | 219 |
| GO:00075962 | Liver | HCC | blood coagulation | 118/7958 | 217/18723 | 2.63e-04 | 1.94e-03 | 118 |
| GO:00075992 | Liver | HCC | hemostasis | 119/7958 | 222/18723 | 5.25e-04 | 3.41e-03 | 119 |
| GO:00508172 | Liver | HCC | coagulation | 118/7958 | 222/18723 | 8.41e-04 | 5.03e-03 | 118 |
| GO:005087822 | Liver | HCC | regulation of body fluid levels | 191/7958 | 379/18723 | 1.06e-03 | 6.11e-03 | 191 |
| Page: 1 |
| Pathway ID | Tissue | Disease Stage | Description | Gene Ratio | Bg Ratio | pvalue | p.adjust | qvalue | Count |
| Page: 1 |
Top |
Cell-cell communication analysis |
| Identification of potential cell-cell interactions between two cell types and their ligand-receptor pairs for different disease states |
| Ligand | Receptor | LRpair | Pathway | Tissue | Disease Stage |
| Page: 1 |
Top |
Single-cell gene regulatory network inference analysis |
| Find out the significant the regulons (TFs) and the target genes of each regulon across cell types for different disease states |
| TF | Cell Type | Tissue | Disease Stage | Target Gene | RSS | Regulon Activity |
| ∗The dot plots of a searched regulon are shown for all cell subpopulations in each disease state of each tissue based on the regulon specific score inferred using pySCENIC and by calculating the average expression. |
| Page: 1 |
Top |
Somatic mutation of malignant transformation related genes |
| Annotation of somatic variants for genes involved in malignant transformation |
| Hugo Symbol | Variant Class | Variant Classification | dbSNP RS | HGVSc | HGVSp | HGVSp Short | SWISSPROT | BIOTYPE | SIFT | PolyPhen | Tumor Sample Barcode | Tissue | Histology | Sex | Age | Stage | Therapy Types | Drugs | Outcome |
| PROZ | SNV | Missense_Mutation | c.264A>C | p.Glu88Asp | p.E88D | P22891 | protein_coding | deleterious(0) | probably_damaging(0.999) | TCGA-A2-A0T2-01 | Breast | breast invasive carcinoma | Female | >=65 | III/IV | Chemotherapy | xeloda | PD | |
| PROZ | insertion | In_Frame_Ins | novel | c.298_299insGTTTCTTCTTTATGTGTTTTATCAAGATGTTAAATG | p.Thr100delinsSerPhePhePheMetCysPheIleLysMetLeuAsnAla | p.T100delinsSFFFMCFIKMLNA | P22891 | protein_coding | TCGA-A8-A0A4-01 | Breast | breast invasive carcinoma | Female | >=65 | I/II | Hormone Therapy | tamoxiphen | CR | ||
| PROZ | insertion | In_Frame_Ins | novel | c.881_882insTCCTGTTTGTATGCC | p.Gln294delinsHisProValCysMetPro | p.Q294delinsHPVCMP | P22891 | protein_coding | TCGA-AN-A041-01 | Breast | breast invasive carcinoma | Female | <65 | I/II | Unknown | Unknown | SD | ||
| PROZ | insertion | Nonsense_Mutation | novel | c.1173_1174insACATAAT | p.Val392ThrfsTer2 | p.V392Tfs*2 | P22891 | protein_coding | TCGA-AO-A0JF-01 | Breast | breast invasive carcinoma | Female | >=65 | I/II | Chemotherapy | doxorubicin | SD | ||
| PROZ | insertion | Frame_Shift_Ins | novel | c.528_529insTTAATTTTTATTTTATTTTTGAGAT | p.Gly177LeufsTer14 | p.G177Lfs*14 | P22891 | protein_coding | TCGA-BH-A0HK-01 | Breast | breast invasive carcinoma | Female | >=65 | I/II | Hormone Therapy | arimidex | SD | ||
| PROZ | SNV | Missense_Mutation | novel | c.418G>C | p.Glu140Gln | p.E140Q | P22891 | protein_coding | deleterious(0.01) | possibly_damaging(0.864) | TCGA-HM-A4S6-01 | Cervix | cervical & endocervical cancer | Female | <65 | III/IV | Chemotherapy | cisplatin | CR |
| PROZ | SNV | Missense_Mutation | novel | c.469G>A | p.Asp157Asn | p.D157N | P22891 | protein_coding | deleterious(0.03) | possibly_damaging(0.817) | TCGA-VS-A9V3-01 | Cervix | cervical & endocervical cancer | Female | <65 | I/II | Chemotherapy | cisplatin | PD |
| PROZ | SNV | Missense_Mutation | rs750249530 | c.1102N>A | p.Val368Met | p.V368M | P22891 | protein_coding | tolerated(0.12) | benign(0.009) | TCGA-5M-AAT6-01 | Colorectum | colon adenocarcinoma | Female | <65 | III/IV | Unknown | Unknown | PD |
| PROZ | SNV | Missense_Mutation | c.391T>C | p.Tyr131His | p.Y131H | P22891 | protein_coding | deleterious(0) | probably_damaging(0.986) | TCGA-AM-5821-01 | Colorectum | colon adenocarcinoma | Female | >=65 | I/II | Unknown | Unknown | SD | |
| PROZ | SNV | Missense_Mutation | c.256N>C | p.Val86Leu | p.V86L | P22891 | protein_coding | tolerated(0.11) | benign(0.038) | TCGA-NH-A50T-01 | Colorectum | colon adenocarcinoma | Female | >=65 | I/II | Unknown | Unknown | SD |
| Page: 1 2 3 4 5 |
Top |
Related drugs of malignant transformation related genes |
| Identification of chemicals and drugs interact with genes involved in malignant transfromation |
| (DGIdb 4.0) |
| Entrez ID | Symbol | Category | Interaction Types | Drug Claim Name | Drug Name | PMIDs |
| 8858 | PROZ | PROTEASE, DRUGGABLE GENOME | MENADIONE | MENADIONE |
| Page: 1 |

Copyright 2023-Present -The University of Texas Health Science Center at Houston |