
|
|||||
|
 | |
| |
| |
| |
| |
| |
|
Gene: PROSER2 |
Gene summary for PROSER2 |
| Gene information | Species | Human | Gene symbol | PROSER2 | Gene ID | 254427 |
| Gene name | proline and serine rich 2 | |
| Gene Alias | C10orf47 | |
| Cytomap | 10p14 | |
| Gene Type | protein-coding | GO ID | GO:0003674 | UniProtAcc | Q86WR7 |
Top |
Malignant transformation analysis |
| Identification of the aberrant gene expression in precancerous and cancerous lesions by comparing the gene expression of stem-like cells in diseased tissues with normal stem cells |
| Entrez ID | Symbol | Replicates | Species | Organ | Tissue | Adj P-value | Log2FC | Malignancy |
| 254427 | PROSER2 | C04 | Human | Oral cavity | OSCC | 1.29e-03 | 3.15e-01 | 0.2633 |
| 254427 | PROSER2 | C21 | Human | Oral cavity | OSCC | 6.10e-04 | 1.93e-01 | 0.2678 |
| 254427 | PROSER2 | C30 | Human | Oral cavity | OSCC | 7.55e-18 | 7.97e-01 | 0.3055 |
| 254427 | PROSER2 | C43 | Human | Oral cavity | OSCC | 3.07e-03 | 1.35e-01 | 0.1704 |
| 254427 | PROSER2 | C46 | Human | Oral cavity | OSCC | 9.26e-08 | 2.36e-01 | 0.1673 |
| 254427 | PROSER2 | C57 | Human | Oral cavity | OSCC | 7.22e-15 | 4.40e-01 | 0.1679 |
| 254427 | PROSER2 | C06 | Human | Oral cavity | OSCC | 3.15e-05 | 8.52e-01 | 0.2699 |
| 254427 | PROSER2 | C08 | Human | Oral cavity | OSCC | 2.80e-04 | 1.21e-01 | 0.1919 |
| 254427 | PROSER2 | LN46 | Human | Oral cavity | OSCC | 1.93e-10 | 4.69e-01 | 0.1666 |
| 254427 | PROSER2 | SYSMH1 | Human | Oral cavity | OSCC | 4.68e-03 | 1.69e-01 | 0.1127 |
| 254427 | PROSER2 | SYSMH2 | Human | Oral cavity | OSCC | 3.53e-05 | 2.60e-01 | 0.2326 |
| 254427 | PROSER2 | SYSMH3 | Human | Oral cavity | OSCC | 1.77e-17 | 4.65e-01 | 0.2442 |
| Page: 1 |
| Tissue | Expression Dynamics | Abbreviation |
| Oral Cavity | 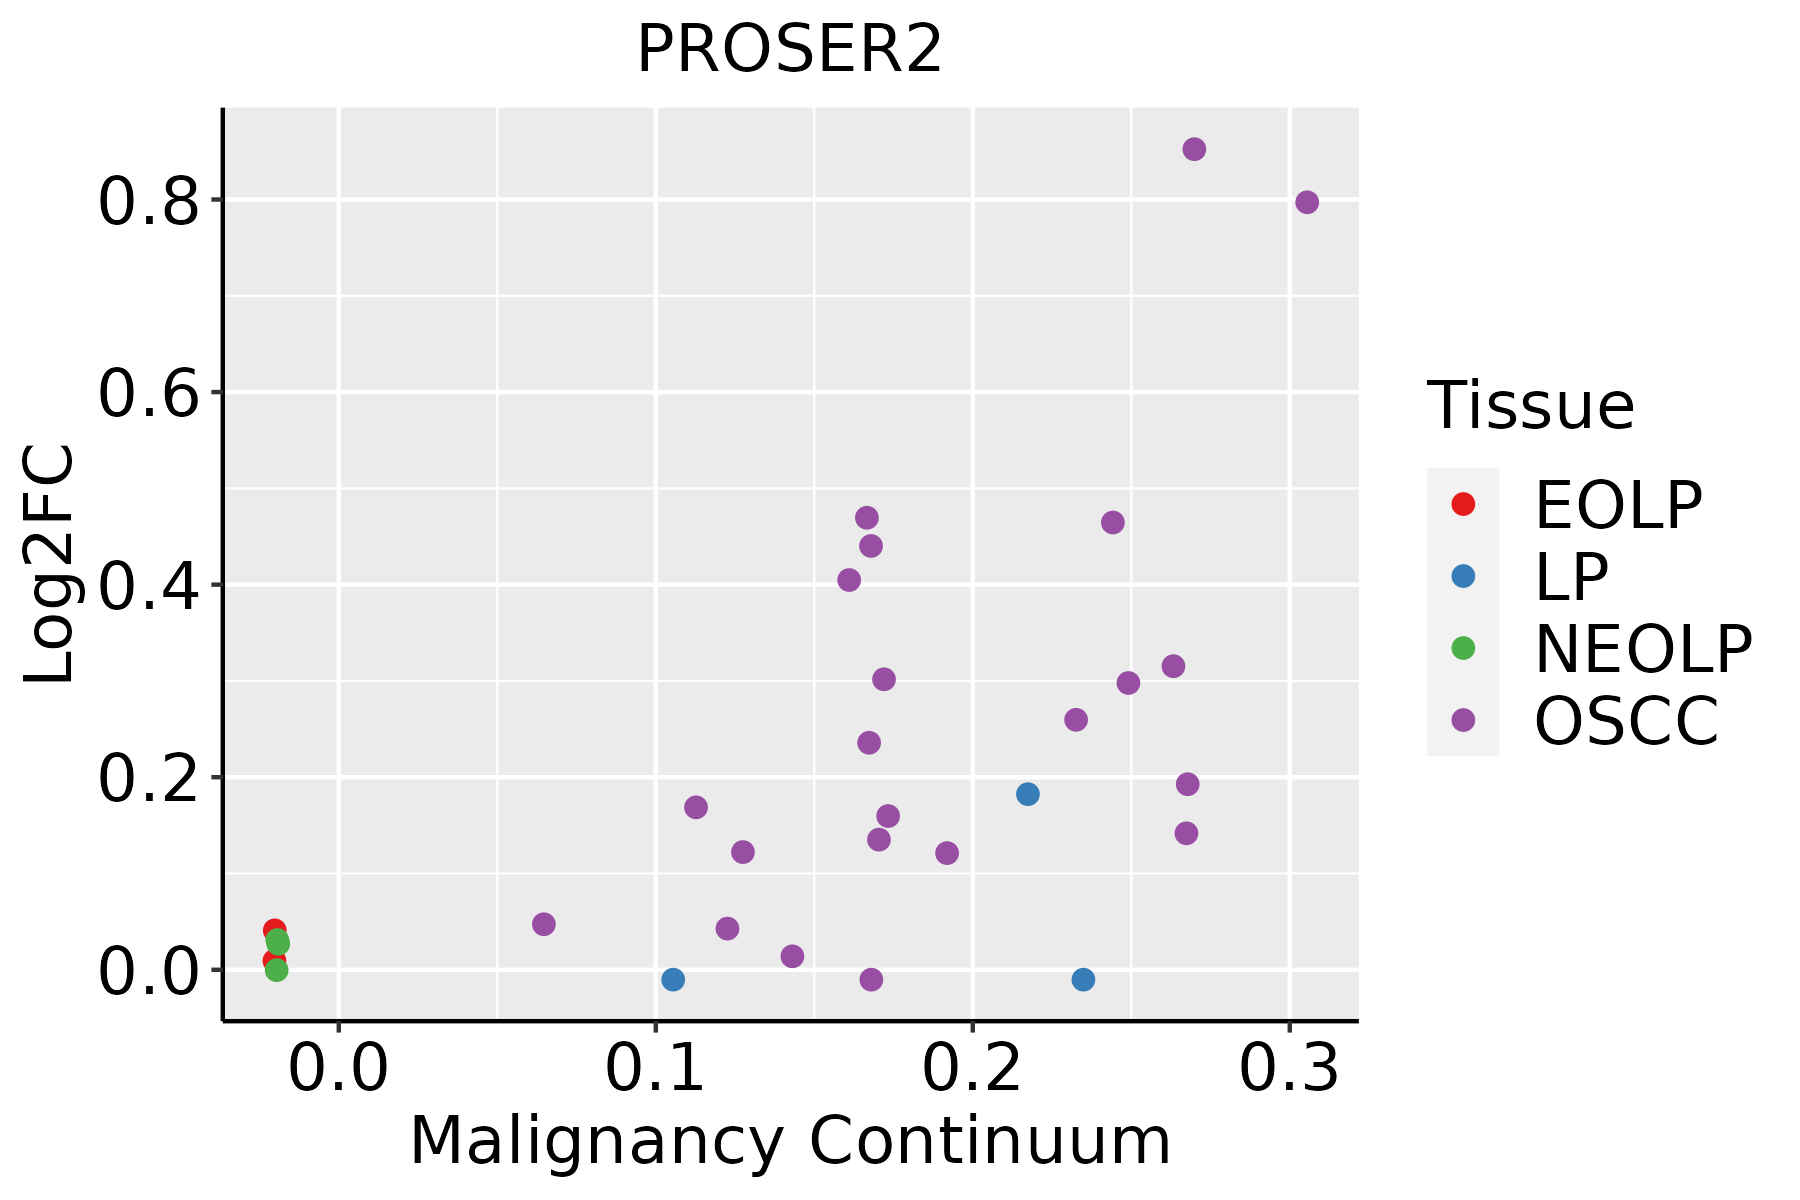 | EOLP: Erosive Oral lichen planus |
| LP: leukoplakia | ||
| NEOLP: Non-erosive oral lichen planus | ||
| OSCC: Oral squamous cell carcinoma |
| ∗log2FC in expression of this searched gene in stem-like cells from each diseased tissue sample relative to stem-like cells in normal samples in each tissue plotted against the malignancy continuum. Samples are colored based on if they are from different disease stage. |
Top |
Malignant transformation related pathway analysis |
| Find out the enriched GO biological processes and KEGG pathways involved in transition from healthy to precancer to cancer |
| Tissue | Disease Stage | Enriched GO biological Processes |
| Colorectum | AD |  |
| Colorectum | SER |  |
| Colorectum | MSS |  |
| Colorectum | MSI-H |  |
| Colorectum | FAP |  |
| ∗Top 15 enriched GO BP terms are showed in the bar plot of each disease state in each tissue. Each row represents a significant GO biological process which is colored according to the -log10(p.adjust). |
| Page: 1 2 3 4 5 6 7 8 9 |
| GO ID | Tissue | Disease Stage | Description | Gene Ratio | Bg Ratio | pvalue | p.adjust | Count |
| Page: 1 |
| Pathway ID | Tissue | Disease Stage | Description | Gene Ratio | Bg Ratio | pvalue | p.adjust | qvalue | Count |
| Page: 1 |
Top |
Cell-cell communication analysis |
| Identification of potential cell-cell interactions between two cell types and their ligand-receptor pairs for different disease states |
| Ligand | Receptor | LRpair | Pathway | Tissue | Disease Stage |
| Page: 1 |
Top |
Single-cell gene regulatory network inference analysis |
| Find out the significant the regulons (TFs) and the target genes of each regulon across cell types for different disease states |
| TF | Cell Type | Tissue | Disease Stage | Target Gene | RSS | Regulon Activity |
| ∗The dot plots of a searched regulon are shown for all cell subpopulations in each disease state of each tissue based on the regulon specific score inferred using pySCENIC and by calculating the average expression. |
| Page: 1 |
Top |
Somatic mutation of malignant transformation related genes |
| Annotation of somatic variants for genes involved in malignant transformation |
| Hugo Symbol | Variant Class | Variant Classification | dbSNP RS | HGVSc | HGVSp | HGVSp Short | SWISSPROT | BIOTYPE | SIFT | PolyPhen | Tumor Sample Barcode | Tissue | Histology | Sex | Age | Stage | Therapy Types | Drugs | Outcome |
| PROSER2 | SNV | Missense_Mutation | novel | c.367N>T | p.Leu123Phe | p.L123F | Q86WR7 | protein_coding | tolerated(0.44) | possibly_damaging(0.838) | TCGA-AN-A0FZ-01 | Breast | breast invasive carcinoma | Female | <65 | III/IV | Unknown | Unknown | SD |
| PROSER2 | insertion | Frame_Shift_Ins | novel | c.368_369insATGGAAAAACAAGTGTGTTGGA | p.Pro124TrpfsTer29 | p.P124Wfs*29 | Q86WR7 | protein_coding | TCGA-AN-A0FZ-01 | Breast | breast invasive carcinoma | Female | <65 | III/IV | Unknown | Unknown | SD | ||
| PROSER2 | deletion | Frame_Shift_Del | c.265_269delNNNNN | p.Cys90ProfsTer14 | p.C90Pfs*14 | Q86WR7 | protein_coding | TCGA-E2-A150-01 | Breast | breast invasive carcinoma | Female | <65 | I/II | Chemotherapy | doxorubicin | SD | |||
| PROSER2 | SNV | Missense_Mutation | novel | c.125N>A | p.Arg42Lys | p.R42K | Q86WR7 | protein_coding | tolerated(0.09) | probably_damaging(0.986) | TCGA-HM-A4S6-01 | Cervix | cervical & endocervical cancer | Female | <65 | III/IV | Chemotherapy | cisplatin | CR |
| PROSER2 | SNV | Missense_Mutation | rs150713045 | c.442N>T | p.Pro148Ser | p.P148S | Q86WR7 | protein_coding | tolerated(0.27) | benign(0.005) | TCGA-VS-A9UP-01 | Cervix | cervical & endocervical cancer | Female | <65 | I/II | Chemotherapy | cisplatin | PD |
| PROSER2 | SNV | Missense_Mutation | c.344N>A | p.Pro115His | p.P115H | Q86WR7 | protein_coding | deleterious(0) | probably_damaging(0.981) | TCGA-A6-5661-01 | Colorectum | colon adenocarcinoma | Female | >=65 | I/II | Unknown | Unknown | SD | |
| PROSER2 | SNV | Missense_Mutation | rs145971555 | c.88N>A | p.Gly30Ser | p.G30S | Q86WR7 | protein_coding | tolerated(0.08) | possibly_damaging(0.472) | TCGA-A6-5665-01 | Colorectum | colon adenocarcinoma | Female | >=65 | I/II | Unknown | Unknown | PD |
| PROSER2 | SNV | Missense_Mutation | c.788N>T | p.Ala263Val | p.A263V | Q86WR7 | protein_coding | tolerated(0.13) | benign(0.373) | TCGA-AA-3492-01 | Colorectum | colon adenocarcinoma | Female | >=65 | I/II | Unknown | Unknown | SD | |
| PROSER2 | SNV | Missense_Mutation | rs775619900 | c.118N>T | p.Arg40Cys | p.R40C | Q86WR7 | protein_coding | deleterious(0.03) | probably_damaging(0.987) | TCGA-AA-A03F-01 | Colorectum | colon adenocarcinoma | Female | >=65 | III/IV | Unknown | Unknown | PD |
| PROSER2 | SNV | Missense_Mutation | c.48N>G | p.Asp16Glu | p.D16E | Q86WR7 | protein_coding | tolerated(0.49) | possibly_damaging(0.808) | TCGA-DM-A28F-01 | Colorectum | colon adenocarcinoma | Male | >=65 | III/IV | Unknown | Unknown | SD |
| Page: 1 2 3 |
Top |
Related drugs of malignant transformation related genes |
| Identification of chemicals and drugs interact with genes involved in malignant transfromation |
| (DGIdb 4.0) |
| Entrez ID | Symbol | Category | Interaction Types | Drug Claim Name | Drug Name | PMIDs |
| Page: 1 |

Copyright 2023-Present -The University of Texas Health Science Center at Houston |