
|
|||||
|
 | |
| |
| |
| |
| |
| |
|
Gene: PROSC |
Gene summary for PROSC |
| Gene information | Species | Human | Gene symbol | PROSC | Gene ID | 11212 |
| Gene name | pyridoxal phosphate binding protein | |
| Gene Alias | EPVB6D | |
| Cytomap | 8p11.23 | |
| Gene Type | protein-coding | GO ID | GO:0008150 | UniProtAcc | O94903 |
Top |
Malignant transformation analysis |
| Identification of the aberrant gene expression in precancerous and cancerous lesions by comparing the gene expression of stem-like cells in diseased tissues with normal stem cells |
| Entrez ID | Symbol | Replicates | Species | Organ | Tissue | Adj P-value | Log2FC | Malignancy |
| 11212 | PROSC | P1T-E | Human | Esophagus | ESCC | 6.20e-08 | 4.62e-01 | 0.0875 |
| 11212 | PROSC | P2T-E | Human | Esophagus | ESCC | 6.92e-39 | 7.40e-01 | 0.1177 |
| 11212 | PROSC | P4T-E | Human | Esophagus | ESCC | 2.70e-29 | 8.50e-01 | 0.1323 |
| 11212 | PROSC | P5T-E | Human | Esophagus | ESCC | 3.56e-09 | 1.41e-01 | 0.1327 |
| 11212 | PROSC | P8T-E | Human | Esophagus | ESCC | 3.25e-23 | 5.11e-01 | 0.0889 |
| 11212 | PROSC | P9T-E | Human | Esophagus | ESCC | 2.34e-10 | 1.51e-01 | 0.1131 |
| 11212 | PROSC | P10T-E | Human | Esophagus | ESCC | 2.86e-36 | 7.32e-01 | 0.116 |
| 11212 | PROSC | P11T-E | Human | Esophagus | ESCC | 1.70e-14 | 3.82e-01 | 0.1426 |
| 11212 | PROSC | P12T-E | Human | Esophagus | ESCC | 3.85e-23 | 5.35e-01 | 0.1122 |
| 11212 | PROSC | P15T-E | Human | Esophagus | ESCC | 5.77e-55 | 1.42e+00 | 0.1149 |
| 11212 | PROSC | P16T-E | Human | Esophagus | ESCC | 1.14e-38 | 7.45e-01 | 0.1153 |
| 11212 | PROSC | P17T-E | Human | Esophagus | ESCC | 9.56e-11 | 3.21e-01 | 0.1278 |
| 11212 | PROSC | P19T-E | Human | Esophagus | ESCC | 9.03e-03 | 5.89e-01 | 0.1662 |
| 11212 | PROSC | P20T-E | Human | Esophagus | ESCC | 6.11e-40 | 9.60e-01 | 0.1124 |
| 11212 | PROSC | P21T-E | Human | Esophagus | ESCC | 8.33e-26 | 4.78e-01 | 0.1617 |
| 11212 | PROSC | P22T-E | Human | Esophagus | ESCC | 3.33e-19 | 3.70e-01 | 0.1236 |
| 11212 | PROSC | P23T-E | Human | Esophagus | ESCC | 1.73e-33 | 8.33e-01 | 0.108 |
| 11212 | PROSC | P24T-E | Human | Esophagus | ESCC | 1.44e-21 | 5.44e-01 | 0.1287 |
| 11212 | PROSC | P26T-E | Human | Esophagus | ESCC | 3.46e-13 | 3.17e-01 | 0.1276 |
| 11212 | PROSC | P27T-E | Human | Esophagus | ESCC | 8.76e-12 | 4.42e-01 | 0.1055 |
| Page: 1 2 3 4 5 |
| Tissue | Expression Dynamics | Abbreviation |
| Esophagus |  | ESCC: Esophageal squamous cell carcinoma |
| HGIN: High-grade intraepithelial neoplasias | ||
| LGIN: Low-grade intraepithelial neoplasias | ||
| Oral Cavity | 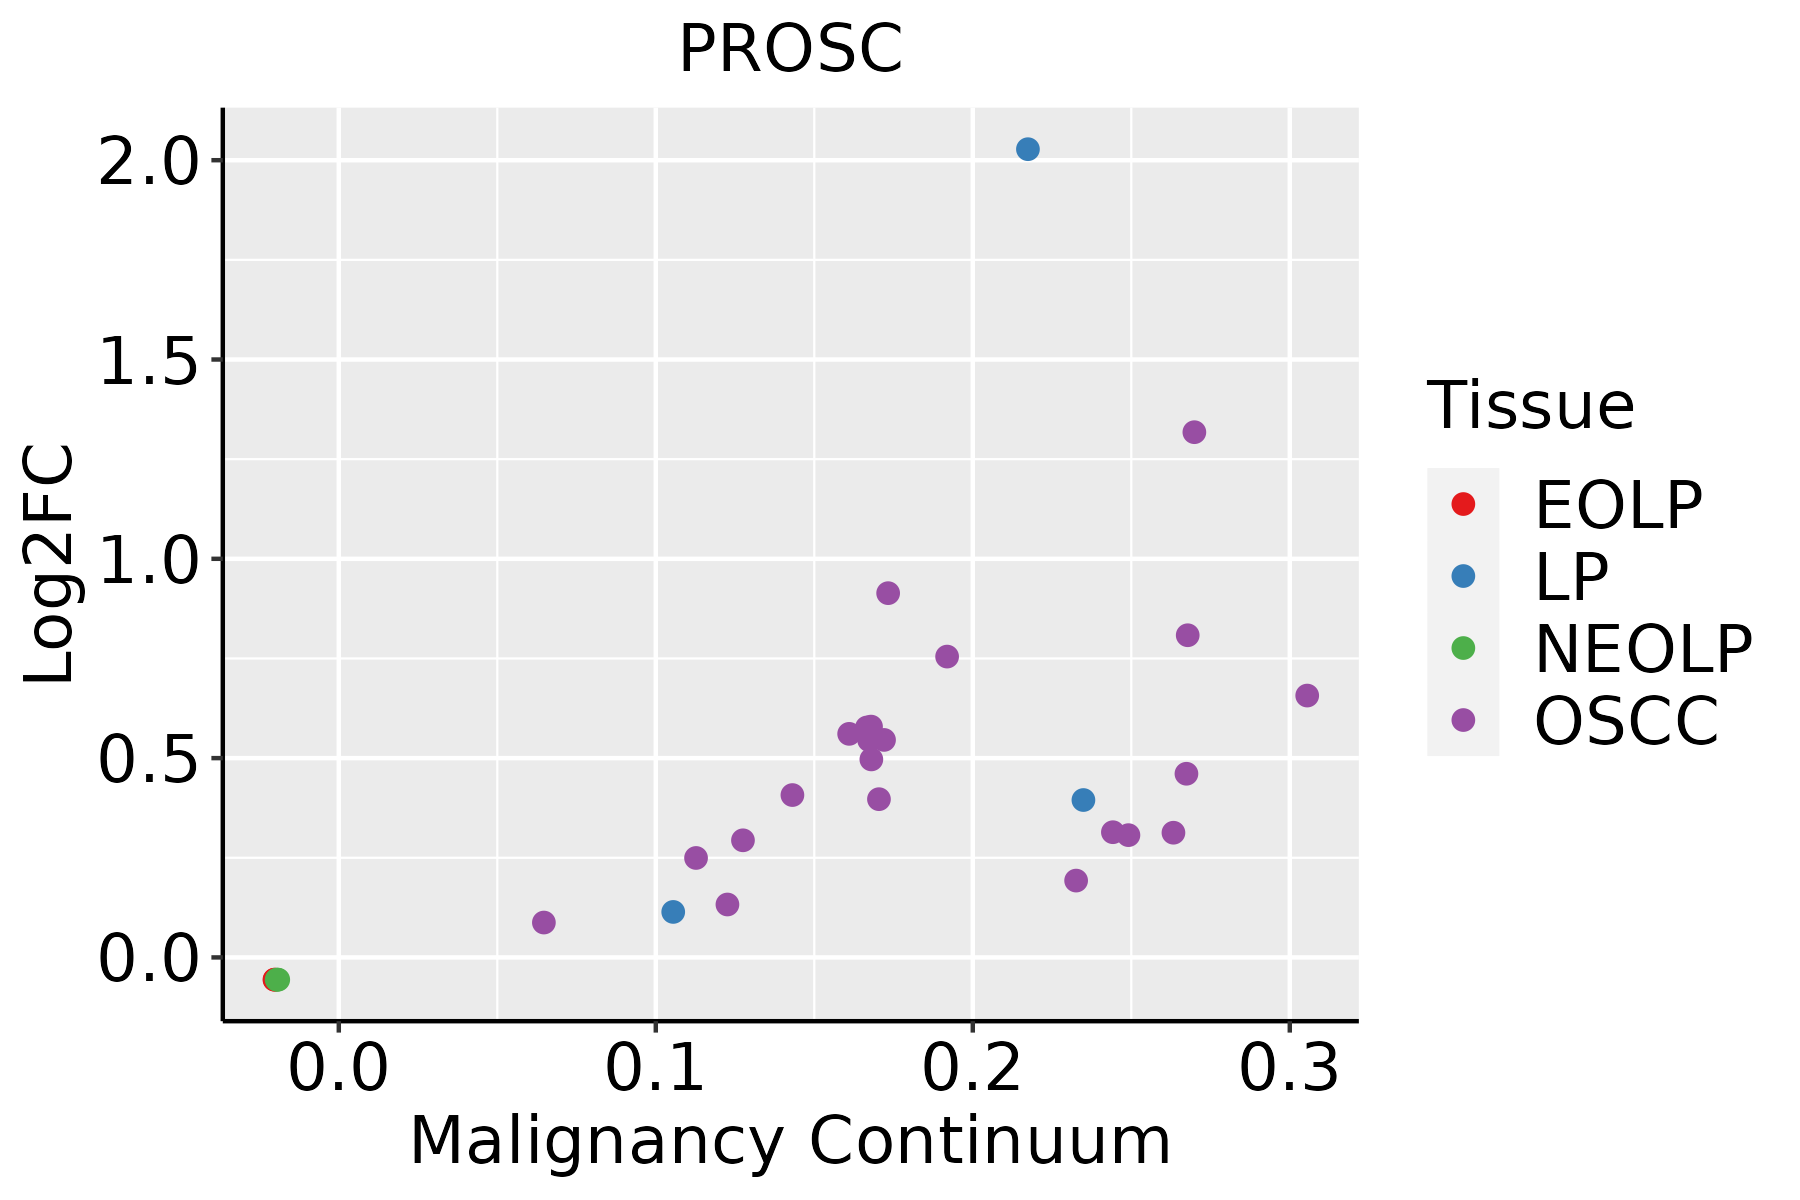 | EOLP: Erosive Oral lichen planus |
| LP: leukoplakia | ||
| NEOLP: Non-erosive oral lichen planus | ||
| OSCC: Oral squamous cell carcinoma | ||
| Prostate | 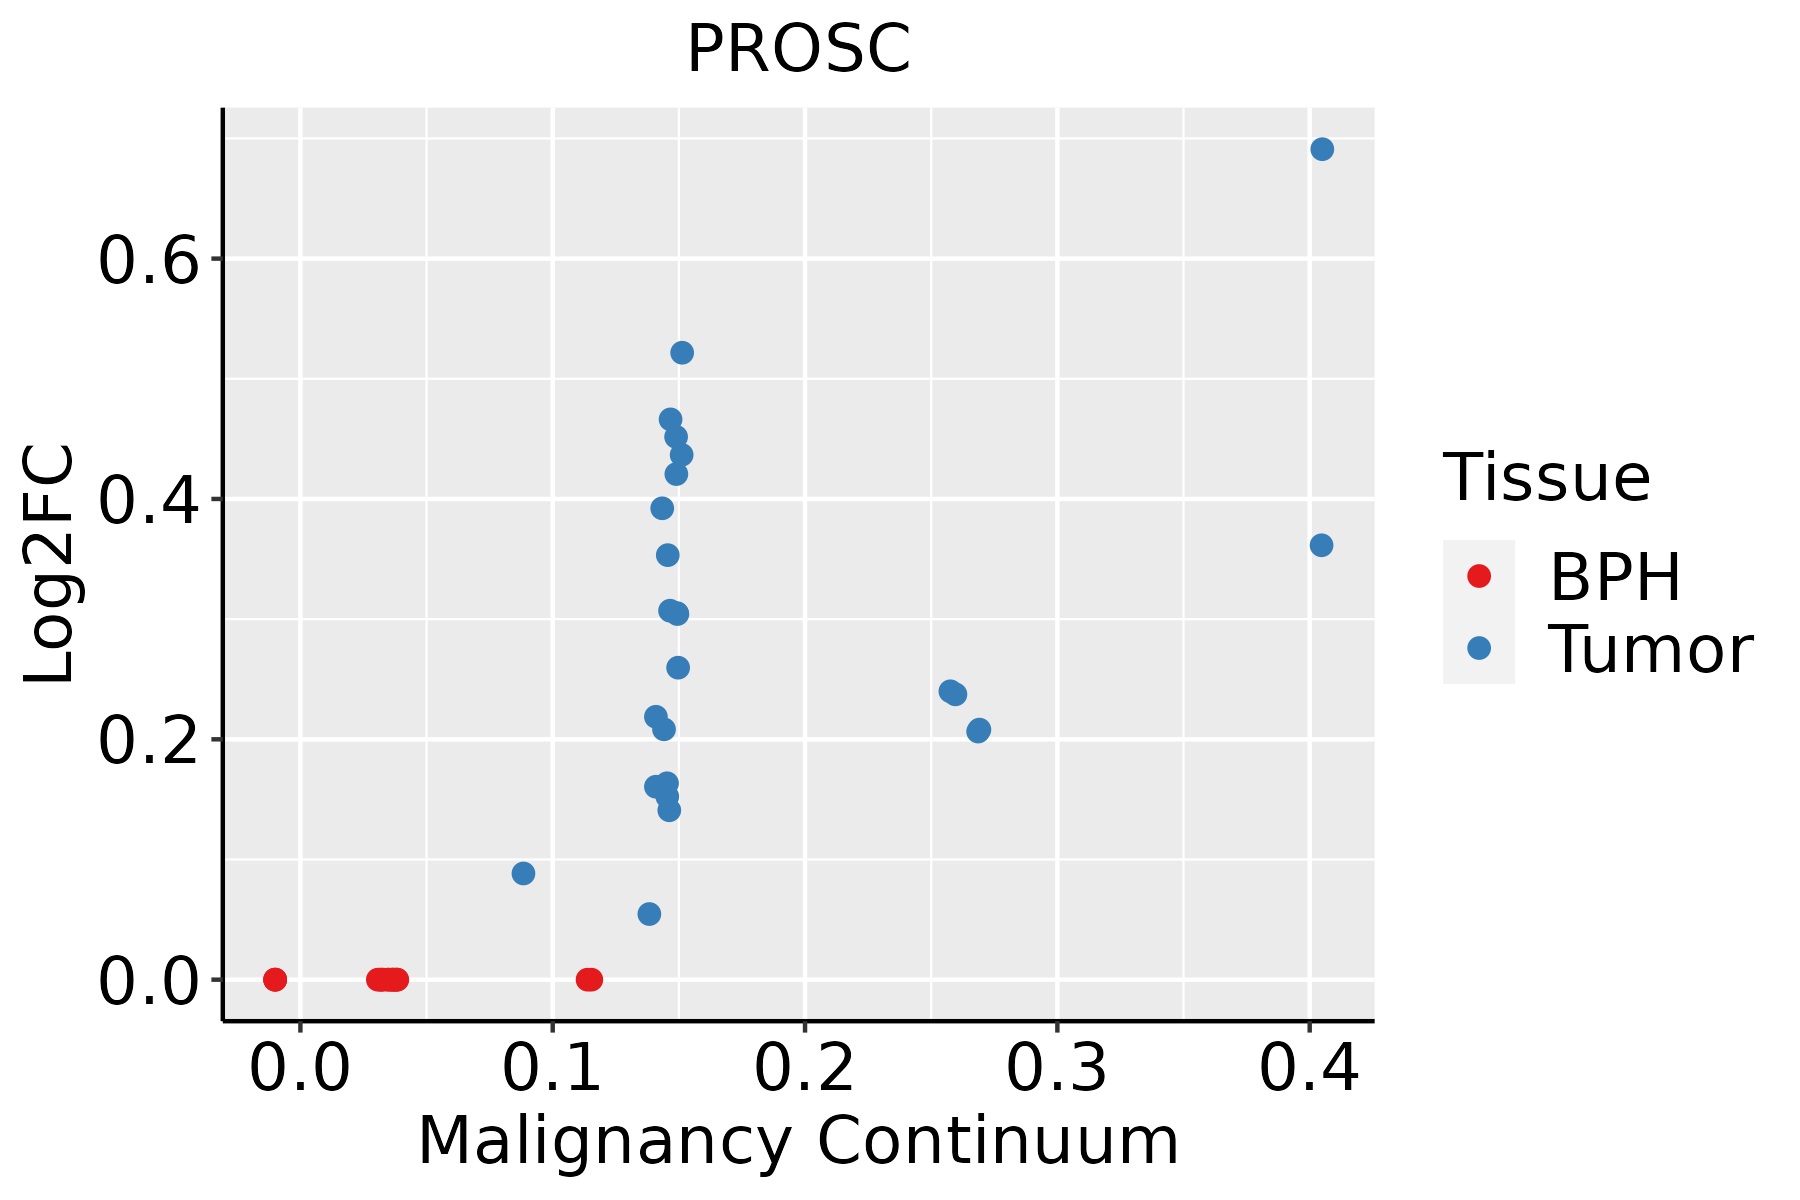 | BPH: Benign Prostatic Hyperplasia |
| Skin | 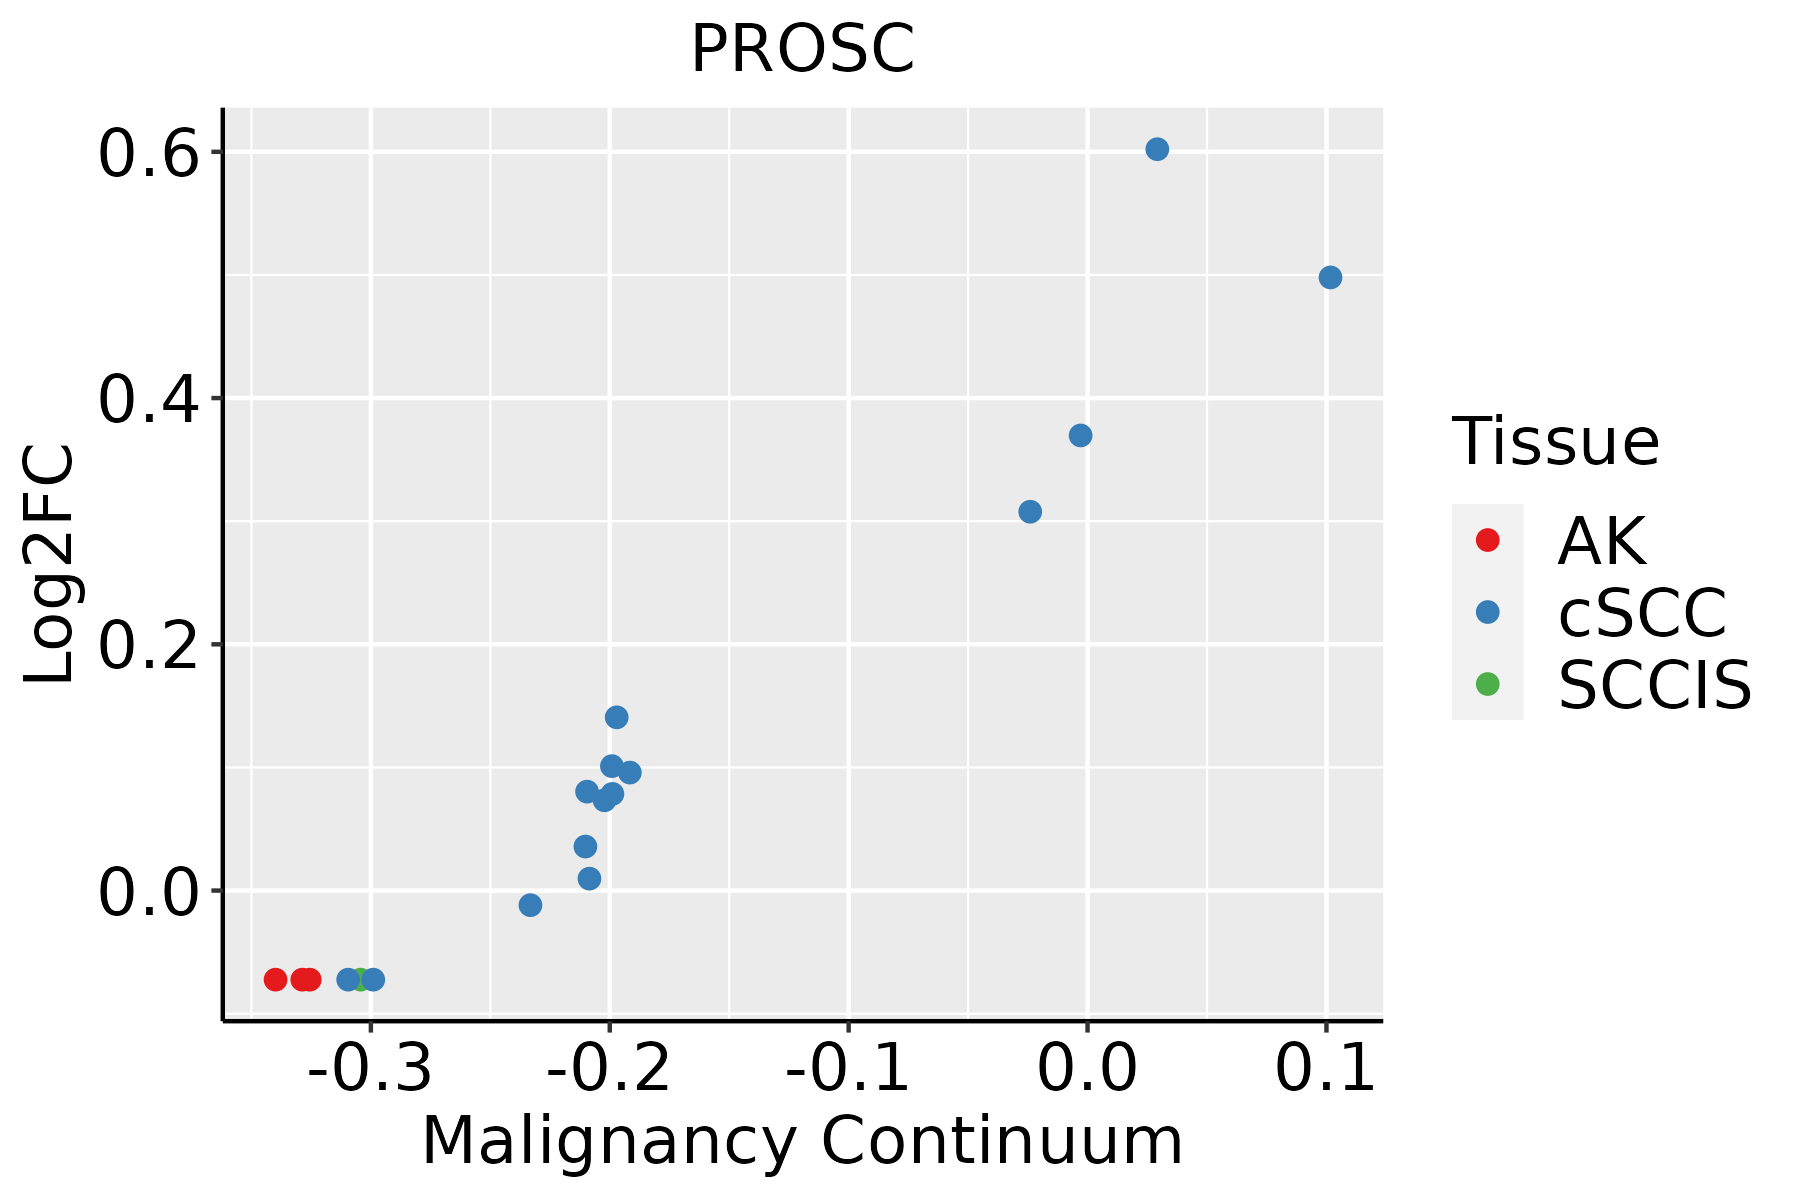 | AK: Actinic keratosis |
| cSCC: Cutaneous squamous cell carcinoma | ||
| SCCIS:squamous cell carcinoma in situ |
| ∗log2FC in expression of this searched gene in stem-like cells from each diseased tissue sample relative to stem-like cells in normal samples in each tissue plotted against the malignancy continuum. Samples are colored based on if they are from different disease stage. |
Top |
Malignant transformation related pathway analysis |
| Find out the enriched GO biological processes and KEGG pathways involved in transition from healthy to precancer to cancer |
| Tissue | Disease Stage | Enriched GO biological Processes |
| Colorectum | AD |  |
| Colorectum | SER |  |
| Colorectum | MSS |  |
| Colorectum | MSI-H |  |
| Colorectum | FAP |  |
| ∗Top 15 enriched GO BP terms are showed in the bar plot of each disease state in each tissue. Each row represents a significant GO biological process which is colored according to the -log10(p.adjust). |
| Page: 1 2 3 4 5 6 7 8 9 |
| GO ID | Tissue | Disease Stage | Description | Gene Ratio | Bg Ratio | pvalue | p.adjust | Count |
| Page: 1 |
| Pathway ID | Tissue | Disease Stage | Description | Gene Ratio | Bg Ratio | pvalue | p.adjust | qvalue | Count |
| Page: 1 |
Top |
Cell-cell communication analysis |
| Identification of potential cell-cell interactions between two cell types and their ligand-receptor pairs for different disease states |
| Ligand | Receptor | LRpair | Pathway | Tissue | Disease Stage |
| Page: 1 |
Top |
Single-cell gene regulatory network inference analysis |
| Find out the significant the regulons (TFs) and the target genes of each regulon across cell types for different disease states |
| TF | Cell Type | Tissue | Disease Stage | Target Gene | RSS | Regulon Activity |
| ∗The dot plots of a searched regulon are shown for all cell subpopulations in each disease state of each tissue based on the regulon specific score inferred using pySCENIC and by calculating the average expression. |
| Page: 1 |
Top |
Somatic mutation of malignant transformation related genes |
| Annotation of somatic variants for genes involved in malignant transformation |
| Hugo Symbol | Variant Class | Variant Classification | dbSNP RS | HGVSc | HGVSp | HGVSp Short | SWISSPROT | BIOTYPE | SIFT | PolyPhen | Tumor Sample Barcode | Tissue | Histology | Sex | Age | Stage | Therapy Types | Drugs | Outcome |
| PROSC | SNV | Missense_Mutation | c.395N>C | p.Arg132Thr | p.R132T | O94903 | protein_coding | tolerated(0.07) | benign(0.01) | TCGA-D8-A1J8-01 | Breast | breast invasive carcinoma | Female | >=65 | I/II | Hormone Therapy | nolvadex | SD | |
| PROSC | SNV | Missense_Mutation | c.409N>A | p.Glu137Lys | p.E137K | O94903 | protein_coding | tolerated(0.22) | benign(0.038) | TCGA-C5-A1BL-01 | Cervix | cervical & endocervical cancer | Female | <65 | I/II | Unknown | Unknown | SD | |
| PROSC | SNV | Missense_Mutation | c.613C>T | p.Arg205Trp | p.R205W | O94903 | protein_coding | deleterious(0) | probably_damaging(0.988) | TCGA-Q1-A6DW-01 | Cervix | cervical & endocervical cancer | Female | <65 | I/II | Chemotherapy | cisplatin | SD | |
| PROSC | SNV | Missense_Mutation | c.21G>A | p.Met7Ile | p.M7I | O94903 | protein_coding | tolerated(0.05) | benign(0.081) | TCGA-AD-6895-01 | Colorectum | colon adenocarcinoma | Male | >=65 | III/IV | Unknown | Unknown | SD | |
| PROSC | SNV | Missense_Mutation | c.677N>T | p.Ser226Phe | p.S226F | O94903 | protein_coding | deleterious(0) | probably_damaging(0.995) | TCGA-G4-6311-01 | Colorectum | colon adenocarcinoma | Male | >=65 | III/IV | Chemotherapy | oxaliplatin | SD | |
| PROSC | SNV | Missense_Mutation | novel | c.100N>T | p.Asp34Tyr | p.D34Y | O94903 | protein_coding | deleterious(0.01) | possibly_damaging(0.537) | TCGA-A5-A0G1-01 | Endometrium | uterine corpus endometrioid carcinoma | Female | >=65 | I/II | Unknown | Unknown | SD |
| PROSC | SNV | Missense_Mutation | rs765044174 | c.748N>T | p.Arg250Trp | p.R250W | O94903 | protein_coding | deleterious(0) | probably_damaging(1) | TCGA-AJ-A3BH-01 | Endometrium | uterine corpus endometrioid carcinoma | Female | Unknown | I/II | Unknown | Unknown | SD |
| PROSC | SNV | Missense_Mutation | novel | c.494N>C | p.Val165Ala | p.V165A | O94903 | protein_coding | tolerated(0.44) | benign(0.023) | TCGA-B5-A11E-01 | Endometrium | uterine corpus endometrioid carcinoma | Female | <65 | I/II | Unknown | Unknown | SD |
| PROSC | SNV | Missense_Mutation | novel | c.689N>G | p.Gln230Arg | p.Q230R | O94903 | protein_coding | deleterious(0.03) | benign(0.027) | TCGA-B5-A1MX-01 | Endometrium | uterine corpus endometrioid carcinoma | Female | <65 | I/II | Hormone Therapy | megace | SD |
| PROSC | SNV | Missense_Mutation | novel | c.617A>G | p.Glu206Gly | p.E206G | O94903 | protein_coding | tolerated(0.09) | benign(0.033) | TCGA-DI-A1BU-01 | Endometrium | uterine corpus endometrioid carcinoma | Female | <65 | I/II | Chemotherapy | paclitaxel | SD |
| Page: 1 2 3 |
Top |
Related drugs of malignant transformation related genes |
| Identification of chemicals and drugs interact with genes involved in malignant transfromation |
| (DGIdb 4.0) |
| Entrez ID | Symbol | Category | Interaction Types | Drug Claim Name | Drug Name | PMIDs |
| Page: 1 |

Copyright 2023-Present -The University of Texas Health Science Center at Houston |