
|
|||||
|
 | |
| |
| |
| |
| |
| |
|
Gene: PROS1 |
Gene summary for PROS1 |
| Gene information | Species | Human | Gene symbol | PROS1 | Gene ID | 5627 |
| Gene name | protein S | |
| Gene Alias | PROS | |
| Cytomap | 3q11.1 | |
| Gene Type | protein-coding | GO ID | GO:0006508 | UniProtAcc | A0A0S2Z4K3 |
Top |
Malignant transformation analysis |
| Identification of the aberrant gene expression in precancerous and cancerous lesions by comparing the gene expression of stem-like cells in diseased tissues with normal stem cells |
| Entrez ID | Symbol | Replicates | Species | Organ | Tissue | Adj P-value | Log2FC | Malignancy |
| 5627 | PROS1 | NAFLD1 | Human | Liver | NAFLD | 3.26e-10 | 1.06e+00 | -0.04 |
| 5627 | PROS1 | S43 | Human | Liver | Cirrhotic | 5.33e-10 | 5.26e-02 | -0.0187 |
| 5627 | PROS1 | HCC1_Meng | Human | Liver | HCC | 1.71e-81 | 4.33e-01 | 0.0246 |
| 5627 | PROS1 | HCC2_Meng | Human | Liver | HCC | 1.86e-15 | -2.56e-01 | 0.0107 |
| 5627 | PROS1 | cirrhotic1 | Human | Liver | Cirrhotic | 1.01e-05 | -2.28e-01 | 0.0202 |
| 5627 | PROS1 | cirrhotic2 | Human | Liver | Cirrhotic | 1.18e-05 | -9.85e-02 | 0.0201 |
| 5627 | PROS1 | HCC1 | Human | Liver | HCC | 2.39e-04 | 4.11e+00 | 0.5336 |
| 5627 | PROS1 | HCC2 | Human | Liver | HCC | 8.30e-06 | 3.81e+00 | 0.5341 |
| 5627 | PROS1 | Pt13.b | Human | Liver | HCC | 2.05e-06 | -6.83e-02 | 0.0251 |
| 5627 | PROS1 | S015 | Human | Liver | HCC | 2.60e-02 | 6.44e-01 | 0.2375 |
| 5627 | PROS1 | S028 | Human | Liver | HCC | 2.63e-18 | 1.11e+00 | 0.2503 |
| 5627 | PROS1 | S029 | Human | Liver | HCC | 5.67e-19 | 1.27e+00 | 0.2581 |
| 5627 | PROS1 | male-WTA | Human | Thyroid | PTC | 5.36e-55 | 6.86e-01 | 0.1037 |
| 5627 | PROS1 | female-WTA | Human | Thyroid | PTC | 6.34e-05 | 3.26e-01 | 0.0726 |
| 5627 | PROS1 | PTC01 | Human | Thyroid | PTC | 4.98e-54 | 1.03e+00 | 0.1899 |
| 5627 | PROS1 | PTC03 | Human | Thyroid | PTC | 5.01e-06 | 3.98e-01 | 0.1784 |
| 5627 | PROS1 | PTC04 | Human | Thyroid | PTC | 4.37e-34 | 8.26e-01 | 0.1927 |
| 5627 | PROS1 | PTC05 | Human | Thyroid | PTC | 3.20e-58 | 2.47e+00 | 0.2065 |
| 5627 | PROS1 | PTC06 | Human | Thyroid | PTC | 1.21e-89 | 2.19e+00 | 0.2057 |
| 5627 | PROS1 | PTC07 | Human | Thyroid | PTC | 1.65e-119 | 2.03e+00 | 0.2044 |
| Page: 1 2 |
| Tissue | Expression Dynamics | Abbreviation |
| Liver | 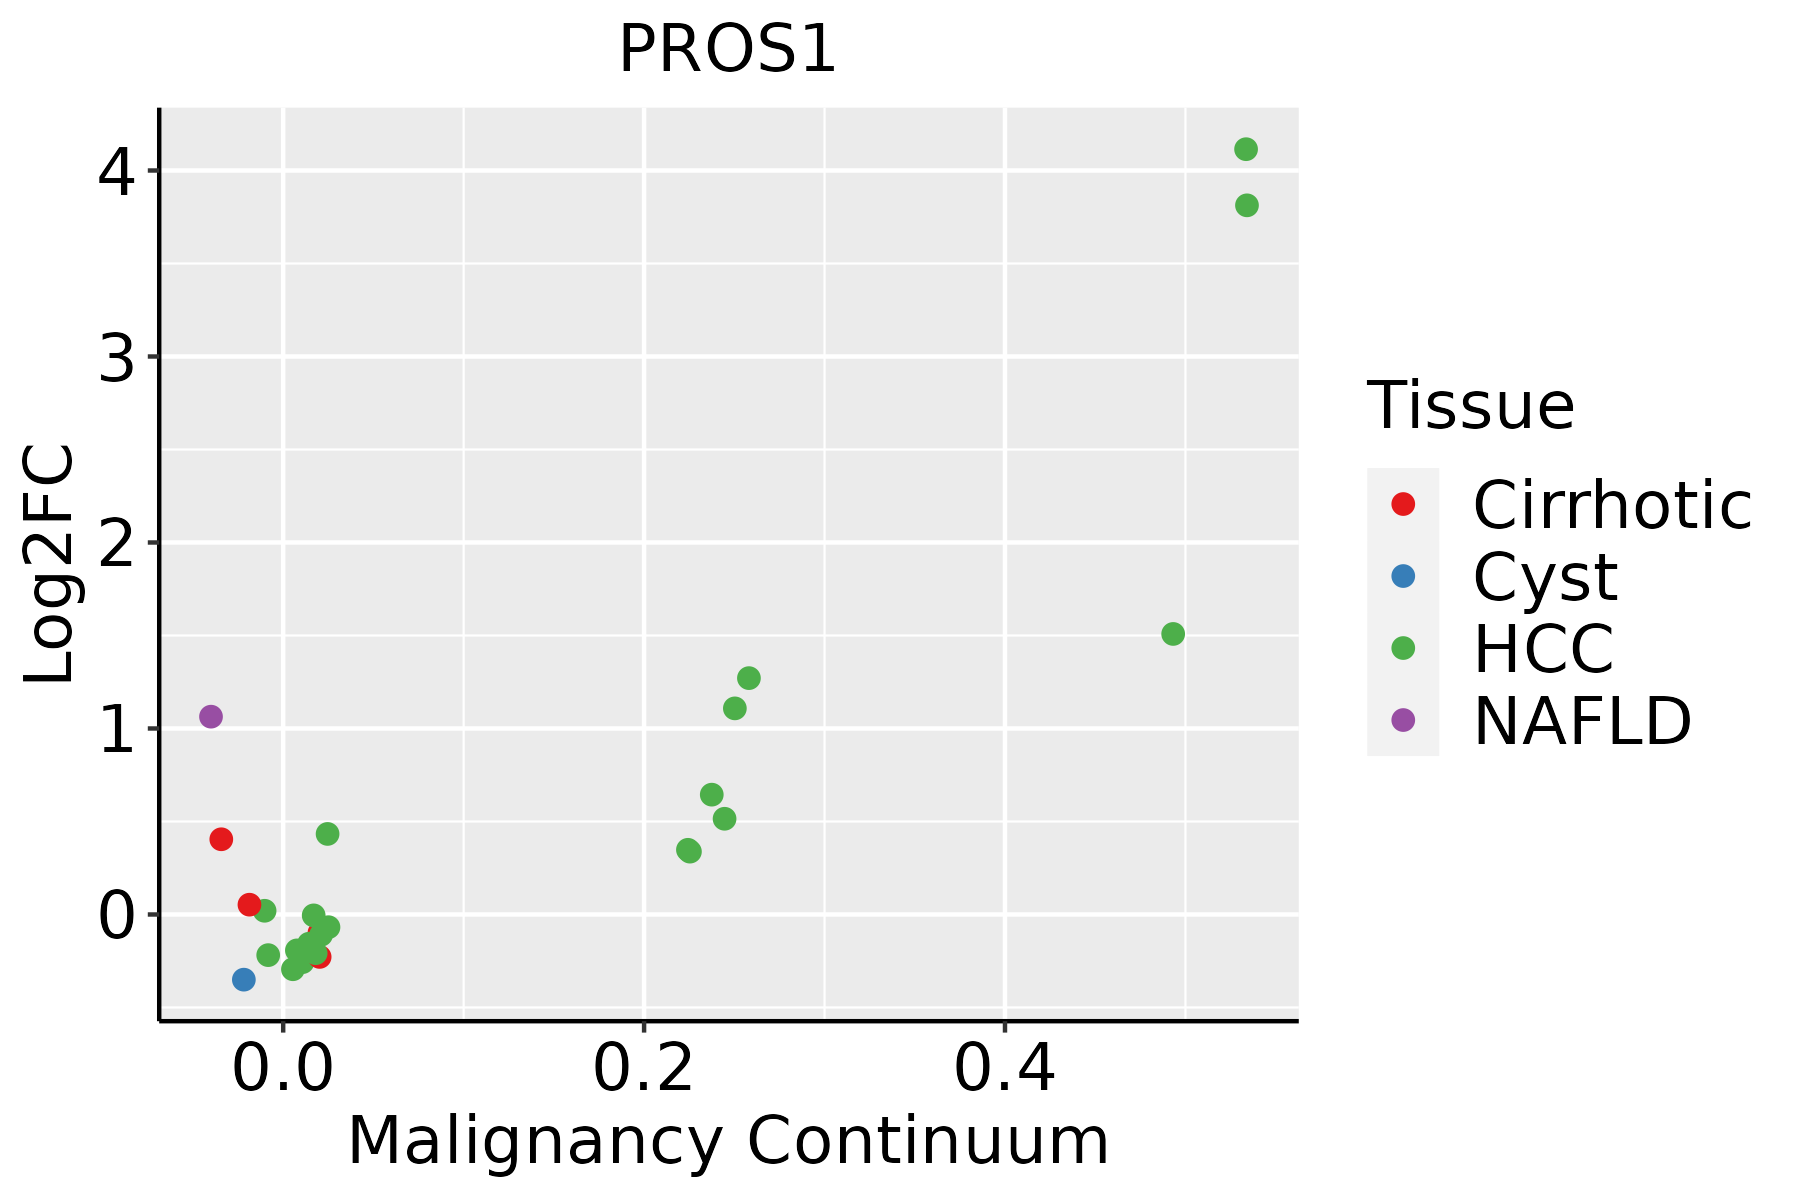 | HCC: Hepatocellular carcinoma |
| NAFLD: Non-alcoholic fatty liver disease | ||
| Thyroid |  | ATC: Anaplastic thyroid cancer |
| HT: Hashimoto's thyroiditis | ||
| PTC: Papillary thyroid cancer |
| ∗log2FC in expression of this searched gene in stem-like cells from each diseased tissue sample relative to stem-like cells in normal samples in each tissue plotted against the malignancy continuum. Samples are colored based on if they are from different disease stage. |
Top |
Malignant transformation related pathway analysis |
| Find out the enriched GO biological processes and KEGG pathways involved in transition from healthy to precancer to cancer |
| Tissue | Disease Stage | Enriched GO biological Processes |
| Colorectum | AD |  |
| Colorectum | SER |  |
| Colorectum | MSS |  |
| Colorectum | MSI-H |  |
| Colorectum | FAP |  |
| ∗Top 15 enriched GO BP terms are showed in the bar plot of each disease state in each tissue. Each row represents a significant GO biological process which is colored according to the -log10(p.adjust). |
| Page: 1 2 3 4 5 6 7 8 9 |
| GO ID | Tissue | Disease Stage | Description | Gene Ratio | Bg Ratio | pvalue | p.adjust | Count |
| GO:00610417 | Liver | NAFLD | regulation of wound healing | 39/1882 | 134/18723 | 5.52e-10 | 1.28e-07 | 39 |
| GO:00420607 | Liver | NAFLD | wound healing | 84/1882 | 422/18723 | 6.56e-10 | 1.37e-07 | 84 |
| GO:0042730 | Liver | NAFLD | fibrinolysis | 15/1882 | 25/18723 | 1.26e-09 | 2.30e-07 | 15 |
| GO:0030195 | Liver | NAFLD | negative regulation of blood coagulation | 21/1882 | 49/18723 | 2.42e-09 | 4.05e-07 | 21 |
| GO:1900047 | Liver | NAFLD | negative regulation of hemostasis | 21/1882 | 50/18723 | 3.78e-09 | 5.40e-07 | 21 |
| GO:0030193 | Liver | NAFLD | regulation of blood coagulation | 24/1882 | 66/18723 | 9.30e-09 | 1.26e-06 | 24 |
| GO:0050819 | Liver | NAFLD | negative regulation of coagulation | 21/1882 | 53/18723 | 1.33e-08 | 1.69e-06 | 21 |
| GO:1900046 | Liver | NAFLD | regulation of hemostasis | 24/1882 | 68/18723 | 1.84e-08 | 2.09e-06 | 24 |
| GO:0061045 | Liver | NAFLD | negative regulation of wound healing | 26/1882 | 78/18723 | 1.86e-08 | 2.09e-06 | 26 |
| GO:19030347 | Liver | NAFLD | regulation of response to wounding | 41/1882 | 167/18723 | 4.70e-08 | 4.58e-06 | 41 |
| GO:0050818 | Liver | NAFLD | regulation of coagulation | 24/1882 | 71/18723 | 4.80e-08 | 4.60e-06 | 24 |
| GO:00075994 | Liver | NAFLD | hemostasis | 49/1882 | 222/18723 | 9.23e-08 | 7.59e-06 | 49 |
| GO:00075964 | Liver | NAFLD | blood coagulation | 48/1882 | 217/18723 | 1.16e-07 | 8.81e-06 | 48 |
| GO:00508174 | Liver | NAFLD | coagulation | 48/1882 | 222/18723 | 2.40e-07 | 1.61e-05 | 48 |
| GO:00458617 | Liver | NAFLD | negative regulation of proteolysis | 66/1882 | 351/18723 | 4.02e-07 | 2.58e-05 | 66 |
| GO:1903035 | Liver | NAFLD | negative regulation of response to wounding | 26/1882 | 94/18723 | 1.18e-06 | 5.66e-05 | 26 |
| GO:00513467 | Liver | NAFLD | negative regulation of hydrolase activity | 62/1882 | 379/18723 | 8.11e-05 | 1.66e-03 | 62 |
| GO:00525477 | Liver | NAFLD | regulation of peptidase activity | 72/1882 | 461/18723 | 1.03e-04 | 2.03e-03 | 72 |
| GO:00525487 | Liver | NAFLD | regulation of endopeptidase activity | 67/1882 | 432/18723 | 2.17e-04 | 3.70e-03 | 67 |
| GO:00508787 | Liver | NAFLD | regulation of body fluid levels | 60/1882 | 379/18723 | 2.61e-04 | 4.23e-03 | 60 |
| Page: 1 2 3 4 5 |
| Pathway ID | Tissue | Disease Stage | Description | Gene Ratio | Bg Ratio | pvalue | p.adjust | qvalue | Count |
| hsa04610 | Liver | NAFLD | Complement and coagulation cascades | 35/1043 | 86/8465 | 2.48e-11 | 2.04e-09 | 1.64e-09 | 35 |
| hsa046101 | Liver | NAFLD | Complement and coagulation cascades | 35/1043 | 86/8465 | 2.48e-11 | 2.04e-09 | 1.64e-09 | 35 |
| hsa046102 | Liver | Cirrhotic | Complement and coagulation cascades | 48/2530 | 86/8465 | 4.41e-07 | 5.44e-06 | 3.35e-06 | 48 |
| hsa046103 | Liver | Cirrhotic | Complement and coagulation cascades | 48/2530 | 86/8465 | 4.41e-07 | 5.44e-06 | 3.35e-06 | 48 |
| hsa046104 | Liver | HCC | Complement and coagulation cascades | 57/4020 | 86/8465 | 3.19e-04 | 1.45e-03 | 8.04e-04 | 57 |
| hsa046105 | Liver | HCC | Complement and coagulation cascades | 57/4020 | 86/8465 | 3.19e-04 | 1.45e-03 | 8.04e-04 | 57 |
| Page: 1 |
Top |
Cell-cell communication analysis |
| Identification of potential cell-cell interactions between two cell types and their ligand-receptor pairs for different disease states |
| Ligand | Receptor | LRpair | Pathway | Tissue | Disease Stage |
| PROS1 | AXL | PROS1_AXL | PROS | Breast | ADJ |
| PROS1 | AXL | PROS1_AXL | PROS | Breast | DCIS |
| PROS1 | AXL | PROS1_AXL | PROS | Breast | Healthy |
| PROS1 | AXL | PROS1_AXL | PROS | Cervix | ADJ |
| PROS1 | AXL | PROS1_AXL | PROS | Cervix | CC |
| PROS1 | AXL | PROS1_AXL | PROS | Cervix | Healthy |
| PROS1 | AXL | PROS1_AXL | PROS | Endometrium | ADJ |
| PROS1 | AXL | PROS1_AXL | PROS | Endometrium | AEH |
| PROS1 | AXL | PROS1_AXL | PROS | Esophagus | ESCC |
| PROS1 | AXL | PROS1_AXL | PROS | GC | ADJ |
| PROS1 | AXL | PROS1_AXL | PROS | HNSCC | Healthy |
| PROS1 | AXL | PROS1_AXL | PROS | HNSCC | OSCC |
| PROS1 | AXL | PROS1_AXL | PROS | HNSCC | Precancer |
| PROS1 | AXL | PROS1_AXL | PROS | Liver | HCC |
| PROS1 | AXL | PROS1_AXL | PROS | Liver | Healthy |
| PROS1 | AXL | PROS1_AXL | PROS | Liver | Precancer |
| PROS1 | AXL | PROS1_AXL | PROS | Lung | AAH |
| PROS1 | AXL | PROS1_AXL | PROS | Lung | ADJ |
| PROS1 | AXL | PROS1_AXL | PROS | Lung | AIS |
| PROS1 | AXL | PROS1_AXL | PROS | Lung | IAC |
| Page: 1 2 |
Top |
Single-cell gene regulatory network inference analysis |
| Find out the significant the regulons (TFs) and the target genes of each regulon across cell types for different disease states |
| TF | Cell Type | Tissue | Disease Stage | Target Gene | RSS | Regulon Activity |
| ∗The dot plots of a searched regulon are shown for all cell subpopulations in each disease state of each tissue based on the regulon specific score inferred using pySCENIC and by calculating the average expression. |
| Page: 1 |
Top |
Somatic mutation of malignant transformation related genes |
| Annotation of somatic variants for genes involved in malignant transformation |
| Hugo Symbol | Variant Class | Variant Classification | dbSNP RS | HGVSc | HGVSp | HGVSp Short | SWISSPROT | BIOTYPE | SIFT | PolyPhen | Tumor Sample Barcode | Tissue | Histology | Sex | Age | Stage | Therapy Types | Drugs | Outcome |
| PROS1 | SNV | Missense_Mutation | novel | c.646N>A | p.Val216Met | p.V216M | P07225 | protein_coding | tolerated(0.22) | possibly_damaging(0.546) | TCGA-A2-A3XS-01 | Breast | breast invasive carcinoma | Female | <65 | III/IV | Chemotherapy | cytoxan | PD |
| PROS1 | SNV | Missense_Mutation | novel | c.778N>A | p.Pro260Thr | p.P260T | P07225 | protein_coding | deleterious(0.02) | possibly_damaging(0.749) | TCGA-AC-A2BK-01 | Breast | breast invasive carcinoma | Female | >=65 | III/IV | Chemotherapy | cytoxan | CR |
| PROS1 | SNV | Missense_Mutation | novel | c.1226N>C | p.Lys409Thr | p.K409T | P07225 | protein_coding | tolerated(0.31) | benign(0.422) | TCGA-AN-A046-01 | Breast | breast invasive carcinoma | Female | >=65 | I/II | Unknown | Unknown | SD |
| PROS1 | SNV | Missense_Mutation | rs387906674 | c.1063C>T | p.Arg355Cys | p.R355C | P07225 | protein_coding | deleterious(0) | probably_damaging(0.999) | TCGA-AO-A0JC-01 | Breast | breast invasive carcinoma | Female | <65 | I/II | Chemotherapy | fluorouracil | SD |
| PROS1 | SNV | Missense_Mutation | c.832N>C | p.Asp278His | p.D278H | P07225 | protein_coding | deleterious(0) | probably_damaging(0.927) | TCGA-BH-A18I-01 | Breast | breast invasive carcinoma | Female | <65 | I/II | Chemotherapy | taxotere | CR | |
| PROS1 | SNV | Missense_Mutation | c.308N>T | p.Ser103Leu | p.S103L | P07225 | protein_coding | tolerated(0.07) | probably_damaging(0.987) | TCGA-C8-A12Q-01 | Breast | breast invasive carcinoma | Female | >=65 | III/IV | Unknown | Unknown | PD | |
| PROS1 | SNV | Missense_Mutation | novel | c.25N>A | p.Gly9Arg | p.G9R | P07225 | protein_coding | tolerated_low_confidence(0.44) | benign(0) | TCGA-C8-A8HP-01 | Breast | breast invasive carcinoma | Female | <65 | III/IV | Chemotherapy | 5-fluorouracil | CR |
| PROS1 | SNV | Missense_Mutation | novel | c.514N>T | p.Ser172Cys | p.S172C | P07225 | protein_coding | deleterious(0) | possibly_damaging(0.841) | TCGA-E9-A1ND-01 | Breast | breast invasive carcinoma | Female | >=65 | I/II | Hormone Therapy | aromasin | SD |
| PROS1 | insertion | Frame_Shift_Ins | novel | c.1697_1698insATTAGGTTGGATAGGTGGGGAAA | p.Ser566ArgfsTer35 | p.S566Rfs*35 | P07225 | protein_coding | TCGA-A8-A07G-01 | Breast | breast invasive carcinoma | Female | >=65 | I/II | Chemotherapy | 5-fluorouracil | CR | ||
| PROS1 | insertion | Frame_Shift_Ins | novel | c.20_21insA | p.Cys8LeufsTer31 | p.C8Lfs*31 | P07225 | protein_coding | TCGA-AC-A3QQ-01 | Breast | breast invasive carcinoma | Female | <65 | I/II | Unknown | Unknown | SD |
| Page: 1 2 3 4 5 6 7 8 9 10 11 12 13 14 |
Top |
Related drugs of malignant transformation related genes |
| Identification of chemicals and drugs interact with genes involved in malignant transfromation |
| (DGIdb 4.0) |
| Entrez ID | Symbol | Category | Interaction Types | Drug Claim Name | Drug Name | PMIDs |
| 5627 | PROS1 | DRUGGABLE GENOME | Warfarin | WARFARIN | ||
| 5627 | PROS1 | DRUGGABLE GENOME | Lusutrombopag | LUSUTROMBOPAG | ||
| 5627 | PROS1 | DRUGGABLE GENOME | avatrombopag | AVATROMBOPAG | ||
| 5627 | PROS1 | DRUGGABLE GENOME | Avatrombopag | AVATROMBOPAG | ||
| 5627 | PROS1 | DRUGGABLE GENOME | ethinyl estradiol / norelgestromin | |||
| 5627 | PROS1 | DRUGGABLE GENOME | MENADIONE | MENADIONE | ||
| 5627 | PROS1 | DRUGGABLE GENOME | Estradiol | ESTRADIOL | ||
| 5627 | PROS1 | DRUGGABLE GENOME | estradiol / progesterone | |||
| 5627 | PROS1 | DRUGGABLE GENOME | lusutrombopag | LUSUTROMBOPAG | ||
| 5627 | PROS1 | DRUGGABLE GENOME | warfarin | WARFARIN |
| Page: 1 2 |

Copyright 2023-Present -The University of Texas Health Science Center at Houston |