
|
|||||
|
 | |
| |
| |
| |
| |
| |
|
Gene: PROM2 |
Gene summary for PROM2 |
| Gene information | Species | Human | Gene symbol | PROM2 | Gene ID | 150696 |
| Gene name | prominin 2 | |
| Gene Alias | PROML2 | |
| Cytomap | 2q11.1 | |
| Gene Type | protein-coding | GO ID | GO:0001932 | UniProtAcc | Q8N271 |
Top |
Malignant transformation analysis |
| Identification of the aberrant gene expression in precancerous and cancerous lesions by comparing the gene expression of stem-like cells in diseased tissues with normal stem cells |
| Entrez ID | Symbol | Replicates | Species | Organ | Tissue | Adj P-value | Log2FC | Malignancy |
| 150696 | PROM2 | LZE4T | Human | Esophagus | ESCC | 1.05e-04 | 2.08e-01 | 0.0811 |
| 150696 | PROM2 | LZE8T | Human | Esophagus | ESCC | 2.72e-04 | 2.56e-01 | 0.067 |
| 150696 | PROM2 | P1T-E | Human | Esophagus | ESCC | 2.50e-04 | 4.35e-01 | 0.0875 |
| 150696 | PROM2 | P2T-E | Human | Esophagus | ESCC | 1.23e-20 | 2.66e-01 | 0.1177 |
| 150696 | PROM2 | P5T-E | Human | Esophagus | ESCC | 1.37e-12 | 1.91e-01 | 0.1327 |
| 150696 | PROM2 | P8T-E | Human | Esophagus | ESCC | 3.11e-09 | 2.36e-01 | 0.0889 |
| 150696 | PROM2 | P11T-E | Human | Esophagus | ESCC | 1.95e-09 | 6.87e-01 | 0.1426 |
| 150696 | PROM2 | P12T-E | Human | Esophagus | ESCC | 1.28e-02 | -3.90e-02 | 0.1122 |
| 150696 | PROM2 | P15T-E | Human | Esophagus | ESCC | 4.10e-08 | 1.29e-01 | 0.1149 |
| 150696 | PROM2 | P16T-E | Human | Esophagus | ESCC | 9.07e-07 | 3.19e-02 | 0.1153 |
| 150696 | PROM2 | P17T-E | Human | Esophagus | ESCC | 1.57e-10 | 3.79e-01 | 0.1278 |
| 150696 | PROM2 | P20T-E | Human | Esophagus | ESCC | 1.92e-09 | 1.30e-01 | 0.1124 |
| 150696 | PROM2 | P21T-E | Human | Esophagus | ESCC | 2.20e-12 | 1.40e-01 | 0.1617 |
| 150696 | PROM2 | P22T-E | Human | Esophagus | ESCC | 1.26e-12 | 1.55e-01 | 0.1236 |
| 150696 | PROM2 | P23T-E | Human | Esophagus | ESCC | 1.44e-07 | 1.45e-01 | 0.108 |
| 150696 | PROM2 | P24T-E | Human | Esophagus | ESCC | 1.32e-07 | 5.22e-02 | 0.1287 |
| 150696 | PROM2 | P26T-E | Human | Esophagus | ESCC | 6.12e-17 | 1.95e-01 | 0.1276 |
| 150696 | PROM2 | P27T-E | Human | Esophagus | ESCC | 9.47e-16 | 1.25e-01 | 0.1055 |
| 150696 | PROM2 | P28T-E | Human | Esophagus | ESCC | 6.47e-19 | 1.87e-01 | 0.1149 |
| 150696 | PROM2 | P30T-E | Human | Esophagus | ESCC | 8.16e-08 | 5.50e-01 | 0.137 |
| Page: 1 2 3 4 |
| Tissue | Expression Dynamics | Abbreviation |
| Esophagus | 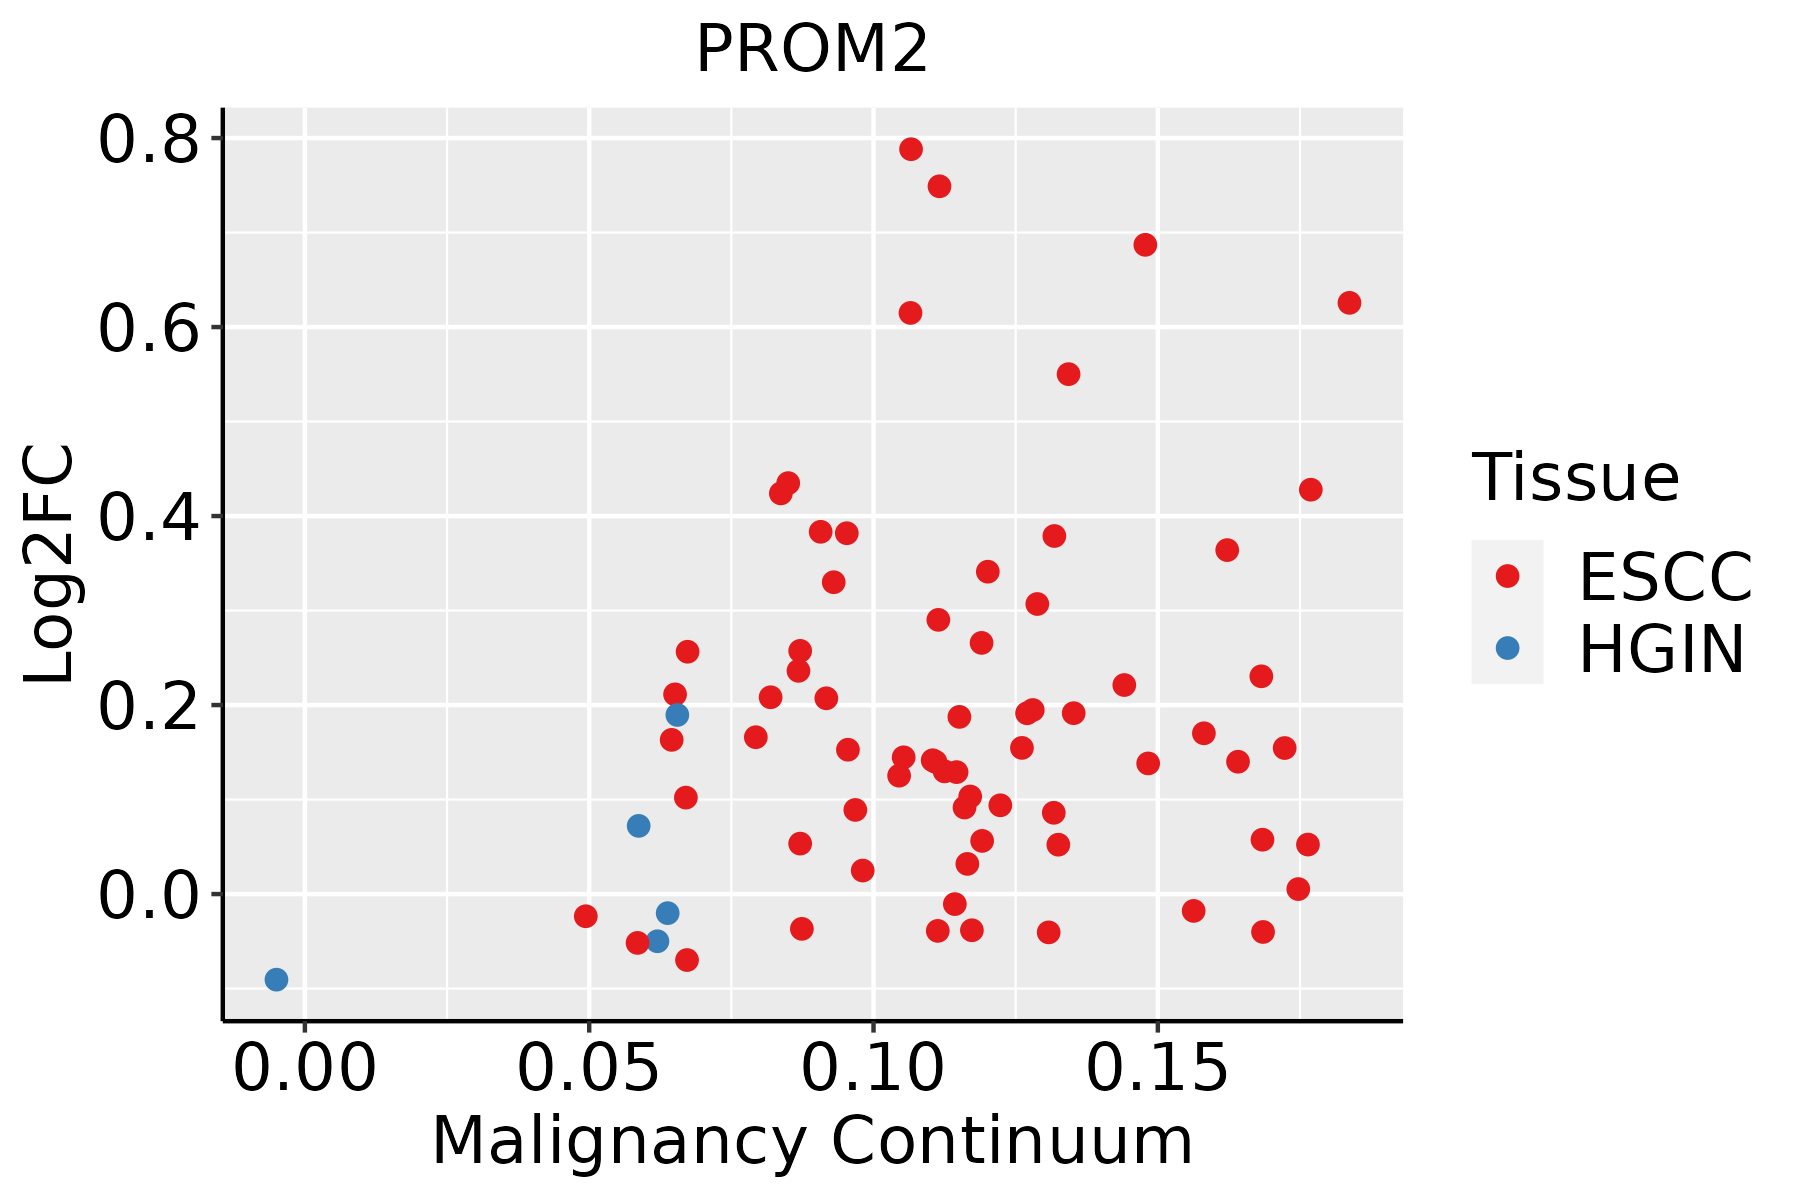 | ESCC: Esophageal squamous cell carcinoma |
| HGIN: High-grade intraepithelial neoplasias | ||
| LGIN: Low-grade intraepithelial neoplasias | ||
| Oral Cavity | 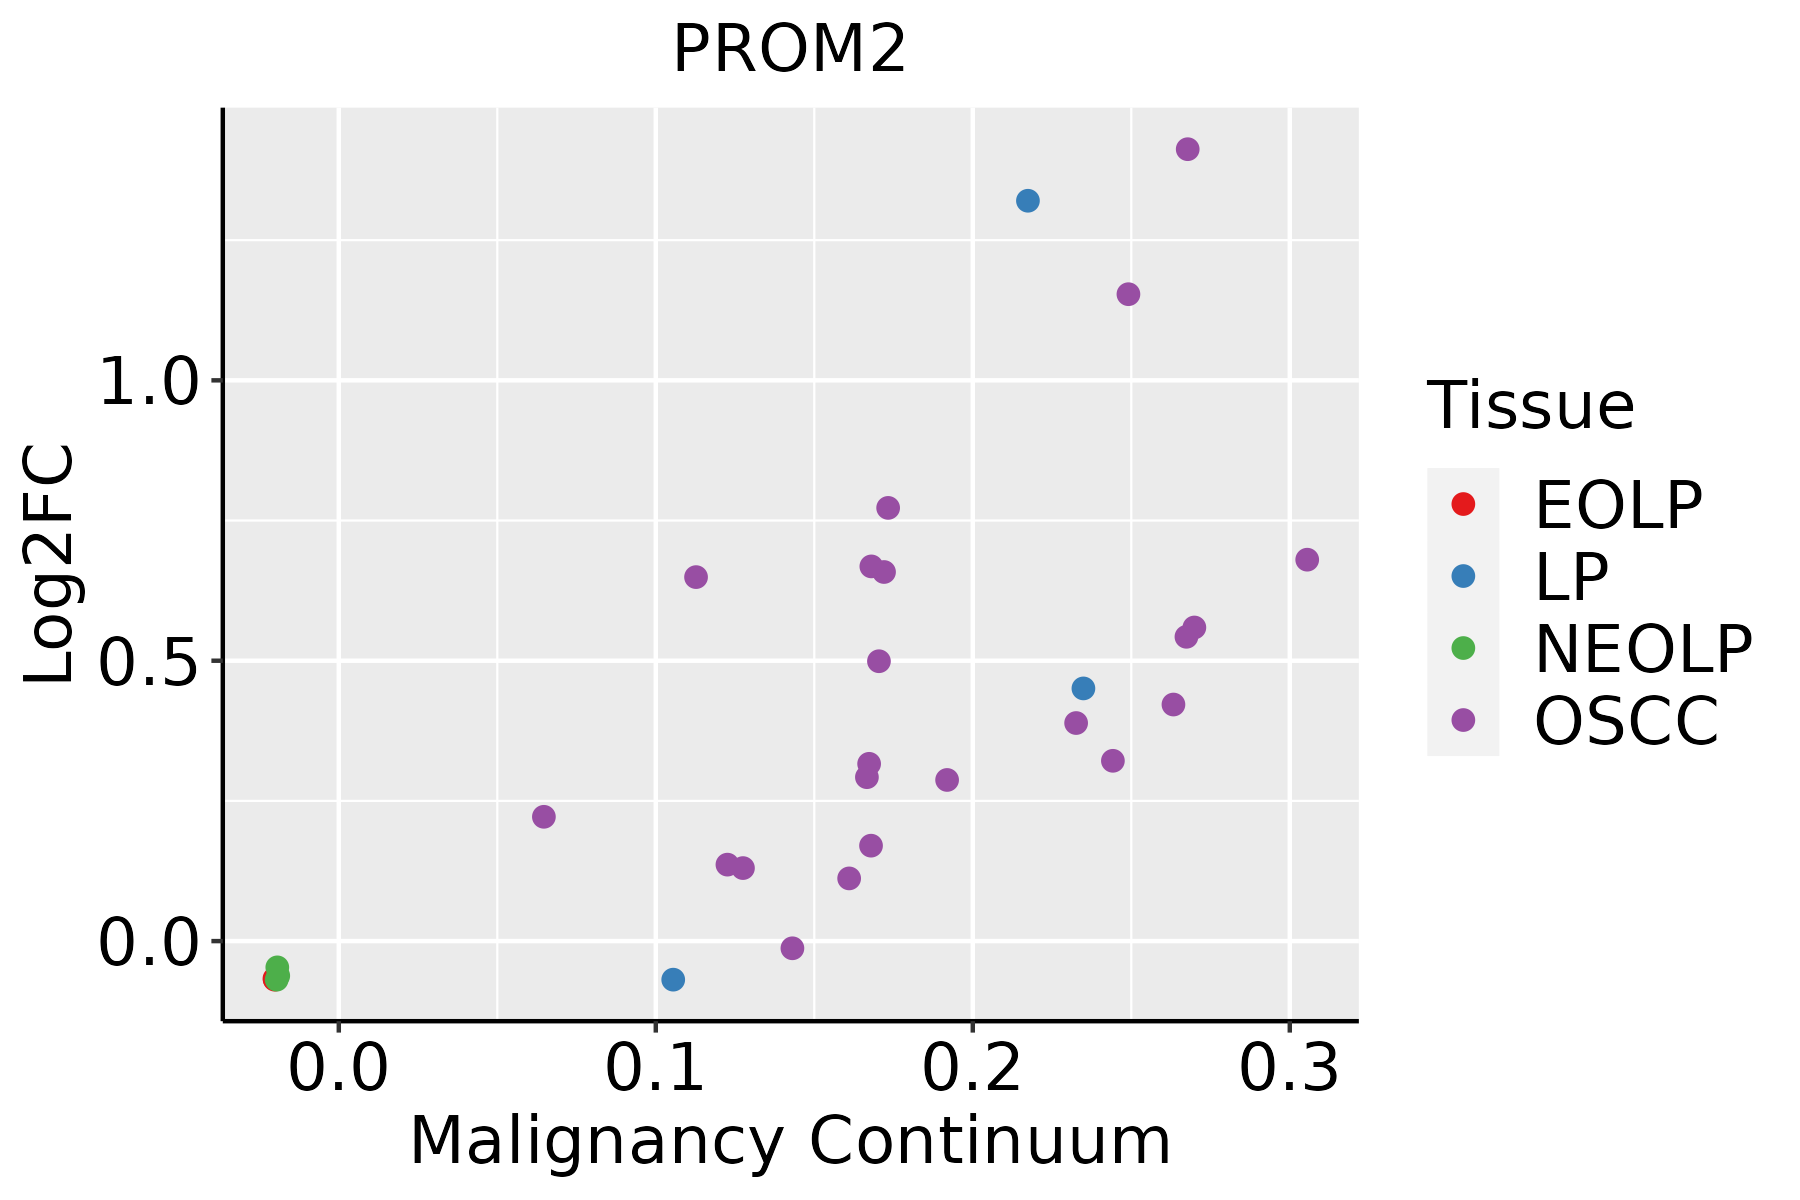 | EOLP: Erosive Oral lichen planus |
| LP: leukoplakia | ||
| NEOLP: Non-erosive oral lichen planus | ||
| OSCC: Oral squamous cell carcinoma | ||
| Thyroid |  | ATC: Anaplastic thyroid cancer |
| HT: Hashimoto's thyroiditis | ||
| PTC: Papillary thyroid cancer |
| ∗log2FC in expression of this searched gene in stem-like cells from each diseased tissue sample relative to stem-like cells in normal samples in each tissue plotted against the malignancy continuum. Samples are colored based on if they are from different disease stage. |
Top |
Malignant transformation related pathway analysis |
| Find out the enriched GO biological processes and KEGG pathways involved in transition from healthy to precancer to cancer |
| Tissue | Disease Stage | Enriched GO biological Processes |
| Colorectum | AD |  |
| Colorectum | SER |  |
| Colorectum | MSS |  |
| Colorectum | MSI-H |  |
| Colorectum | FAP |  |
| ∗Top 15 enriched GO BP terms are showed in the bar plot of each disease state in each tissue. Each row represents a significant GO biological process which is colored according to the -log10(p.adjust). |
| Page: 1 2 3 4 5 6 7 8 9 |
| GO ID | Tissue | Disease Stage | Description | Gene Ratio | Bg Ratio | pvalue | p.adjust | Count |
| GO:003010018 | Esophagus | ESCC | regulation of endocytosis | 135/8552 | 211/18723 | 5.75e-08 | 1.02e-06 | 135 |
| GO:003134616 | Esophagus | ESCC | positive regulation of cell projection organization | 201/8552 | 353/18723 | 1.19e-05 | 1.11e-04 | 201 |
| GO:00485483 | Esophagus | ESCC | regulation of pinocytosis | 11/8552 | 12/18723 | 1.26e-03 | 6.06e-03 | 11 |
| GO:004308715 | Esophagus | ESCC | regulation of GTPase activity | 183/8552 | 348/18723 | 5.34e-03 | 2.00e-02 | 183 |
| GO:00725841 | Esophagus | ESCC | caveolin-mediated endocytosis | 10/8552 | 12/18723 | 8.94e-03 | 3.12e-02 | 10 |
| GO:00069073 | Esophagus | ESCC | pinocytosis | 16/8552 | 22/18723 | 9.46e-03 | 3.28e-02 | 16 |
| GO:003010016 | Oral cavity | OSCC | regulation of endocytosis | 121/7305 | 211/18723 | 4.74e-08 | 8.80e-07 | 121 |
| GO:003134610 | Oral cavity | OSCC | positive regulation of cell projection organization | 176/7305 | 353/18723 | 1.94e-05 | 1.87e-04 | 176 |
| GO:004308710 | Oral cavity | OSCC | regulation of GTPase activity | 165/7305 | 348/18723 | 7.94e-04 | 4.27e-03 | 165 |
| GO:00069072 | Oral cavity | OSCC | pinocytosis | 16/7305 | 22/18723 | 1.40e-03 | 6.79e-03 | 16 |
| GO:00485482 | Oral cavity | OSCC | regulation of pinocytosis | 9/7305 | 12/18723 | 1.27e-02 | 4.24e-02 | 9 |
| GO:0072584 | Oral cavity | OSCC | caveolin-mediated endocytosis | 9/7305 | 12/18723 | 1.27e-02 | 4.24e-02 | 9 |
| GO:003010017 | Oral cavity | LP | regulation of endocytosis | 81/4623 | 211/18723 | 6.57e-06 | 1.29e-04 | 81 |
| GO:000690711 | Oral cavity | LP | pinocytosis | 12/4623 | 22/18723 | 2.55e-03 | 1.80e-02 | 12 |
| GO:003134615 | Oral cavity | LP | positive regulation of cell projection organization | 109/4623 | 353/18723 | 4.59e-03 | 2.93e-02 | 109 |
| GO:0031346110 | Thyroid | PTC | positive regulation of cell projection organization | 173/5968 | 353/18723 | 1.09e-11 | 4.40e-10 | 173 |
| GO:003010020 | Thyroid | PTC | regulation of endocytosis | 108/5968 | 211/18723 | 3.92e-09 | 1.04e-07 | 108 |
| GO:004308718 | Thyroid | PTC | regulation of GTPase activity | 148/5968 | 348/18723 | 1.63e-05 | 1.71e-04 | 148 |
| GO:00069074 | Thyroid | PTC | pinocytosis | 14/5968 | 22/18723 | 2.16e-03 | 1.15e-02 | 14 |
| GO:00510518 | Thyroid | PTC | negative regulation of transport | 176/5968 | 470/18723 | 5.44e-03 | 2.49e-02 | 176 |
| Page: 1 |
| Pathway ID | Tissue | Disease Stage | Description | Gene Ratio | Bg Ratio | pvalue | p.adjust | qvalue | Count |
| Page: 1 |
Top |
Cell-cell communication analysis |
| Identification of potential cell-cell interactions between two cell types and their ligand-receptor pairs for different disease states |
| Ligand | Receptor | LRpair | Pathway | Tissue | Disease Stage |
| Page: 1 |
Top |
Single-cell gene regulatory network inference analysis |
| Find out the significant the regulons (TFs) and the target genes of each regulon across cell types for different disease states |
| TF | Cell Type | Tissue | Disease Stage | Target Gene | RSS | Regulon Activity |
| ∗The dot plots of a searched regulon are shown for all cell subpopulations in each disease state of each tissue based on the regulon specific score inferred using pySCENIC and by calculating the average expression. |
| Page: 1 |
Top |
Somatic mutation of malignant transformation related genes |
| Annotation of somatic variants for genes involved in malignant transformation |
| Hugo Symbol | Variant Class | Variant Classification | dbSNP RS | HGVSc | HGVSp | HGVSp Short | SWISSPROT | BIOTYPE | SIFT | PolyPhen | Tumor Sample Barcode | Tissue | Histology | Sex | Age | Stage | Therapy Types | Drugs | Outcome |
| PROM2 | SNV | Missense_Mutation | c.619N>A | p.Glu207Lys | p.E207K | Q8N271 | protein_coding | tolerated(0.46) | benign(0.018) | TCGA-AC-A23H-01 | Breast | breast invasive carcinoma | Female | >=65 | I/II | Unknown | Unknown | PD | |
| PROM2 | SNV | Missense_Mutation | rs776077038 | c.1402G>A | p.Glu468Lys | p.E468K | Q8N271 | protein_coding | tolerated(0.07) | benign(0.095) | TCGA-BH-A0W7-01 | Breast | breast invasive carcinoma | Female | <65 | I/II | Chemotherapy | taxotere | CR |
| PROM2 | SNV | Missense_Mutation | novel | c.1931N>C | p.Gly644Ala | p.G644A | Q8N271 | protein_coding | tolerated(0.13) | benign(0.074) | TCGA-HN-A2NL-01 | Breast | breast invasive carcinoma | Female | <65 | I/II | Chemotherapy | cyclophosphamide | SD |
| PROM2 | deletion | In_Frame_Del | c.872_889delGGGACCGCCTCCTTGAGC | p.Arg291_Glu296del | p.R291_E296del | Q8N271 | protein_coding | TCGA-A2-A04T-01 | Breast | breast invasive carcinoma | Female | <65 | I/II | Chemotherapy | cyclophosphamide | SD | |||
| PROM2 | deletion | Frame_Shift_Del | novel | c.510delC | p.Cys171ValfsTer61 | p.C171Vfs*61 | Q8N271 | protein_coding | TCGA-D8-A27V-01 | Breast | breast invasive carcinoma | Female | <65 | I/II | Hormone Therapy | tamoxiphen | SD | ||
| PROM2 | SNV | Missense_Mutation | novel | c.1816C>A | p.Leu606Met | p.L606M | Q8N271 | protein_coding | deleterious(0) | probably_damaging(0.976) | TCGA-2W-A8YY-01 | Cervix | cervical & endocervical cancer | Female | <65 | I/II | Chemotherapy | cisplatin | CR |
| PROM2 | SNV | Missense_Mutation | c.215N>G | p.Ser72Trp | p.S72W | Q8N271 | protein_coding | deleterious(0.01) | probably_damaging(0.925) | TCGA-DR-A0ZM-01 | Cervix | cervical & endocervical cancer | Female | <65 | III/IV | Unspecific | Cisplatin | SD | |
| PROM2 | SNV | Missense_Mutation | novel | c.359T>G | p.Val120Gly | p.V120G | Q8N271 | protein_coding | deleterious(0) | possibly_damaging(0.637) | TCGA-DS-A1OB-01 | Cervix | cervical & endocervical cancer | Female | <65 | I/II | Chemotherapy | carboplatin | PD |
| PROM2 | SNV | Missense_Mutation | rs553459907 | c.1744C>T | p.Arg582Trp | p.R582W | Q8N271 | protein_coding | deleterious(0) | benign(0) | TCGA-EX-A1H6-01 | Cervix | cervical & endocervical cancer | Female | <65 | I/II | Unknown | Unknown | SD |
| PROM2 | SNV | Missense_Mutation | c.85G>C | p.Asp29His | p.D29H | Q8N271 | protein_coding | deleterious_low_confidence(0.01) | possibly_damaging(0.854) | TCGA-IR-A3LA-01 | Cervix | cervical & endocervical cancer | Female | <65 | I/II | Chemotherapy | cisplatin | CR |
| Page: 1 2 3 4 5 6 7 8 |
Top |
Related drugs of malignant transformation related genes |
| Identification of chemicals and drugs interact with genes involved in malignant transfromation |
| (DGIdb 4.0) |
| Entrez ID | Symbol | Category | Interaction Types | Drug Claim Name | Drug Name | PMIDs |
| Page: 1 |

Copyright 2023-Present -The University of Texas Health Science Center at Houston |