
|
|||||
|
 | |
| |
| |
| |
| |
| |
|
Gene: PROM1 |
Gene summary for PROM1 |
| Gene information | Species | Human | Gene symbol | PROM1 | Gene ID | 8842 |
| Gene name | prominin 1 | |
| Gene Alias | AC133 | |
| Cytomap | 4p15.32 | |
| Gene Type | protein-coding | GO ID | GO:0001654 | UniProtAcc | A0A0A0N0M1 |
Top |
Malignant transformation analysis |
| Identification of the aberrant gene expression in precancerous and cancerous lesions by comparing the gene expression of stem-like cells in diseased tissues with normal stem cells |
| Entrez ID | Symbol | Replicates | Species | Organ | Tissue | Adj P-value | Log2FC | Malignancy |
| 8842 | PROM1 | HTA11_347_2000001011 | Human | Colorectum | AD | 5.58e-06 | 5.16e-01 | -0.1954 |
| 8842 | PROM1 | HTA11_99999970781_79442 | Human | Colorectum | MSS | 1.49e-07 | 6.63e-01 | 0.294 |
| 8842 | PROM1 | HTA11_99999965062_69753 | Human | Colorectum | MSI-H | 6.96e-08 | 1.38e+00 | 0.3487 |
| 8842 | PROM1 | A002-C-010 | Human | Colorectum | FAP | 4.26e-07 | -2.87e-01 | 0.242 |
| 8842 | PROM1 | A001-C-207 | Human | Colorectum | FAP | 7.47e-03 | -3.00e-01 | 0.1278 |
| 8842 | PROM1 | A015-C-203 | Human | Colorectum | FAP | 1.40e-28 | -5.82e-01 | -0.1294 |
| 8842 | PROM1 | A015-C-204 | Human | Colorectum | FAP | 2.40e-02 | -1.67e-01 | -0.0228 |
| 8842 | PROM1 | A014-C-040 | Human | Colorectum | FAP | 2.47e-03 | -5.01e-01 | -0.1184 |
| 8842 | PROM1 | A002-C-201 | Human | Colorectum | FAP | 2.80e-10 | -3.34e-01 | 0.0324 |
| 8842 | PROM1 | A002-C-203 | Human | Colorectum | FAP | 8.70e-04 | -8.02e-02 | 0.2786 |
| 8842 | PROM1 | A001-C-119 | Human | Colorectum | FAP | 7.18e-04 | -1.86e-01 | -0.1557 |
| 8842 | PROM1 | A001-C-108 | Human | Colorectum | FAP | 4.70e-14 | -2.55e-01 | -0.0272 |
| 8842 | PROM1 | A002-C-205 | Human | Colorectum | FAP | 4.05e-18 | -4.56e-01 | -0.1236 |
| 8842 | PROM1 | A001-C-104 | Human | Colorectum | FAP | 7.43e-03 | -1.28e-01 | 0.0184 |
| 8842 | PROM1 | A015-C-005 | Human | Colorectum | FAP | 7.28e-04 | -3.52e-01 | -0.0336 |
| 8842 | PROM1 | A015-C-006 | Human | Colorectum | FAP | 6.52e-12 | -5.18e-01 | -0.0994 |
| 8842 | PROM1 | A015-C-106 | Human | Colorectum | FAP | 6.59e-13 | -3.34e-01 | -0.0511 |
| 8842 | PROM1 | A002-C-114 | Human | Colorectum | FAP | 1.20e-18 | -6.17e-01 | -0.1561 |
| 8842 | PROM1 | A015-C-104 | Human | Colorectum | FAP | 1.10e-30 | -5.27e-01 | -0.1899 |
| 8842 | PROM1 | A001-C-014 | Human | Colorectum | FAP | 5.27e-10 | -2.26e-01 | 0.0135 |
| Page: 1 2 3 |
| Tissue | Expression Dynamics | Abbreviation |
| Colorectum (GSE201348) |  | FAP: Familial adenomatous polyposis |
| CRC: Colorectal cancer | ||
| Colorectum (HTA11) | 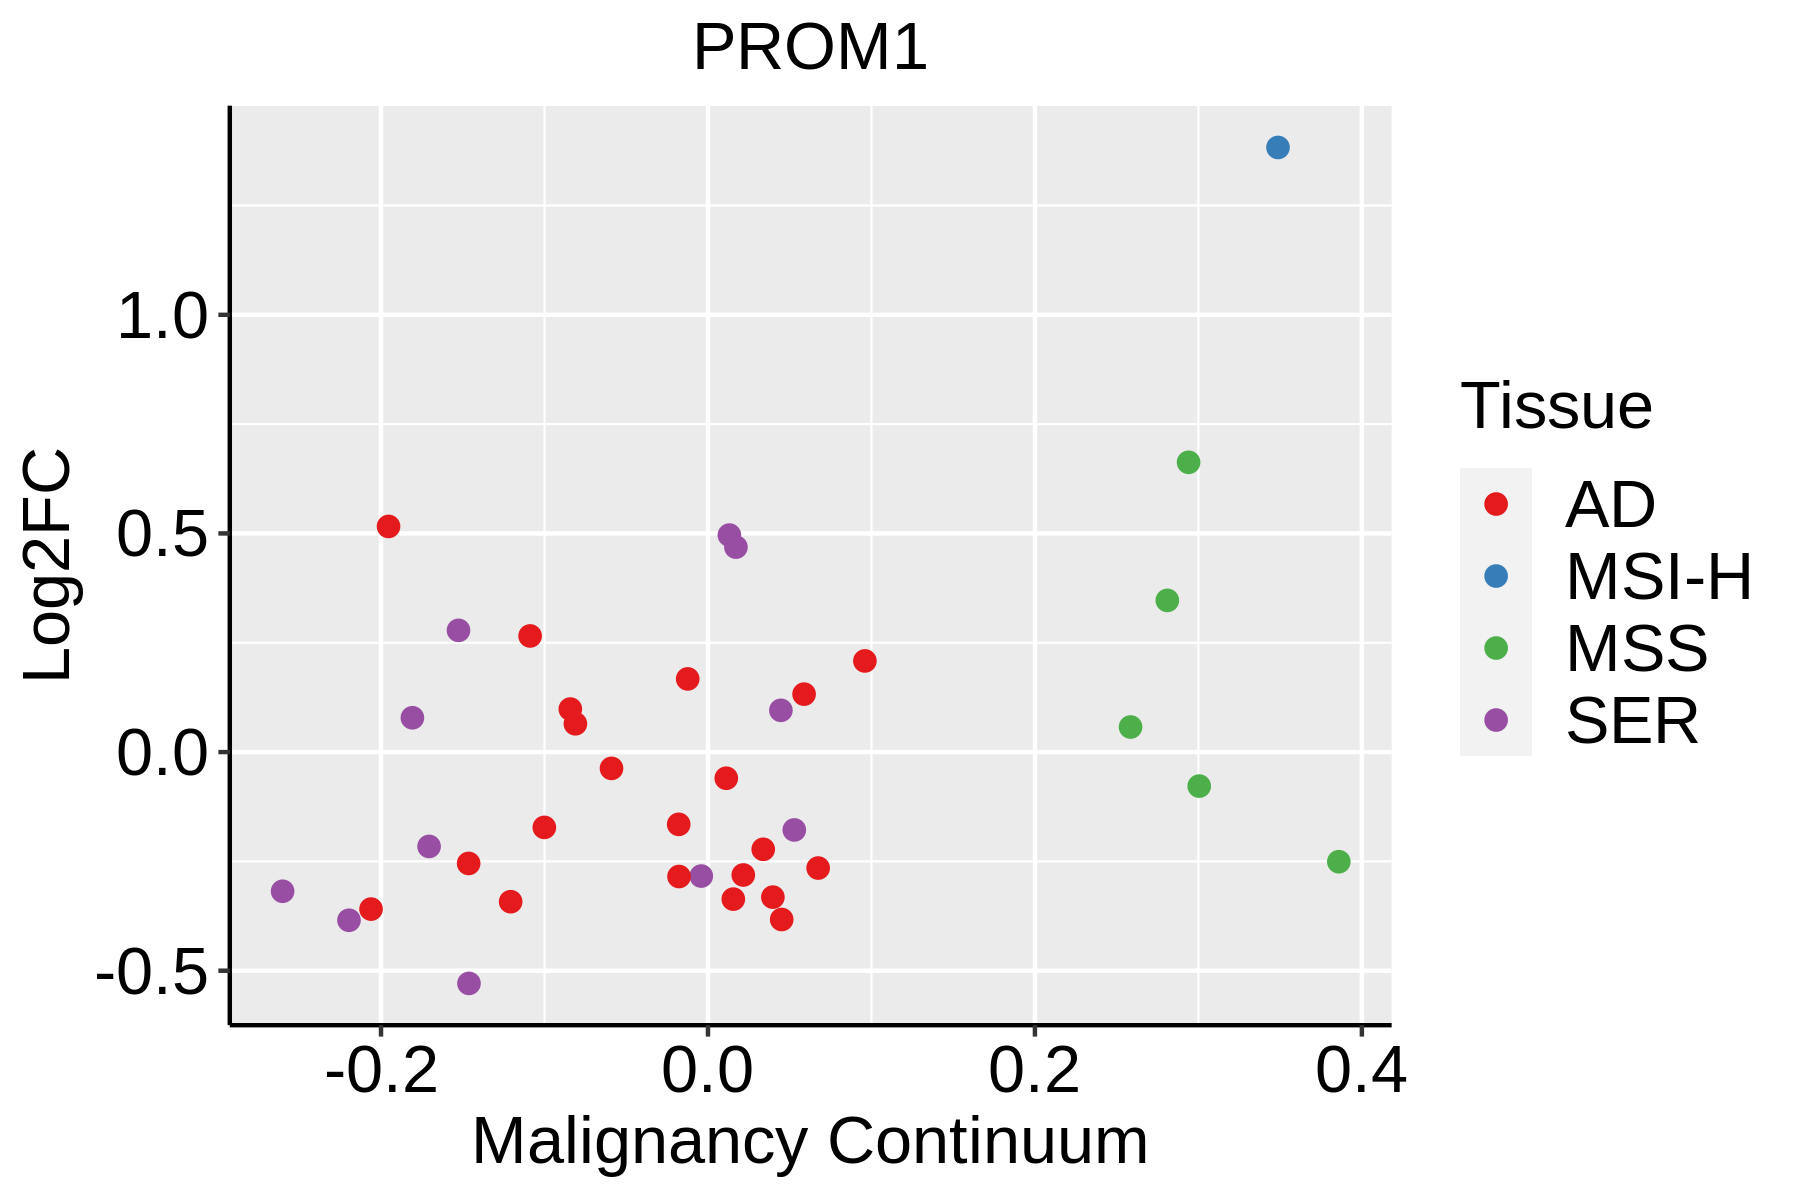 | AD: Adenomas |
| SER: Sessile serrated lesions | ||
| MSI-H: Microsatellite-high colorectal cancer | ||
| MSS: Microsatellite stable colorectal cancer | ||
| Esophagus | 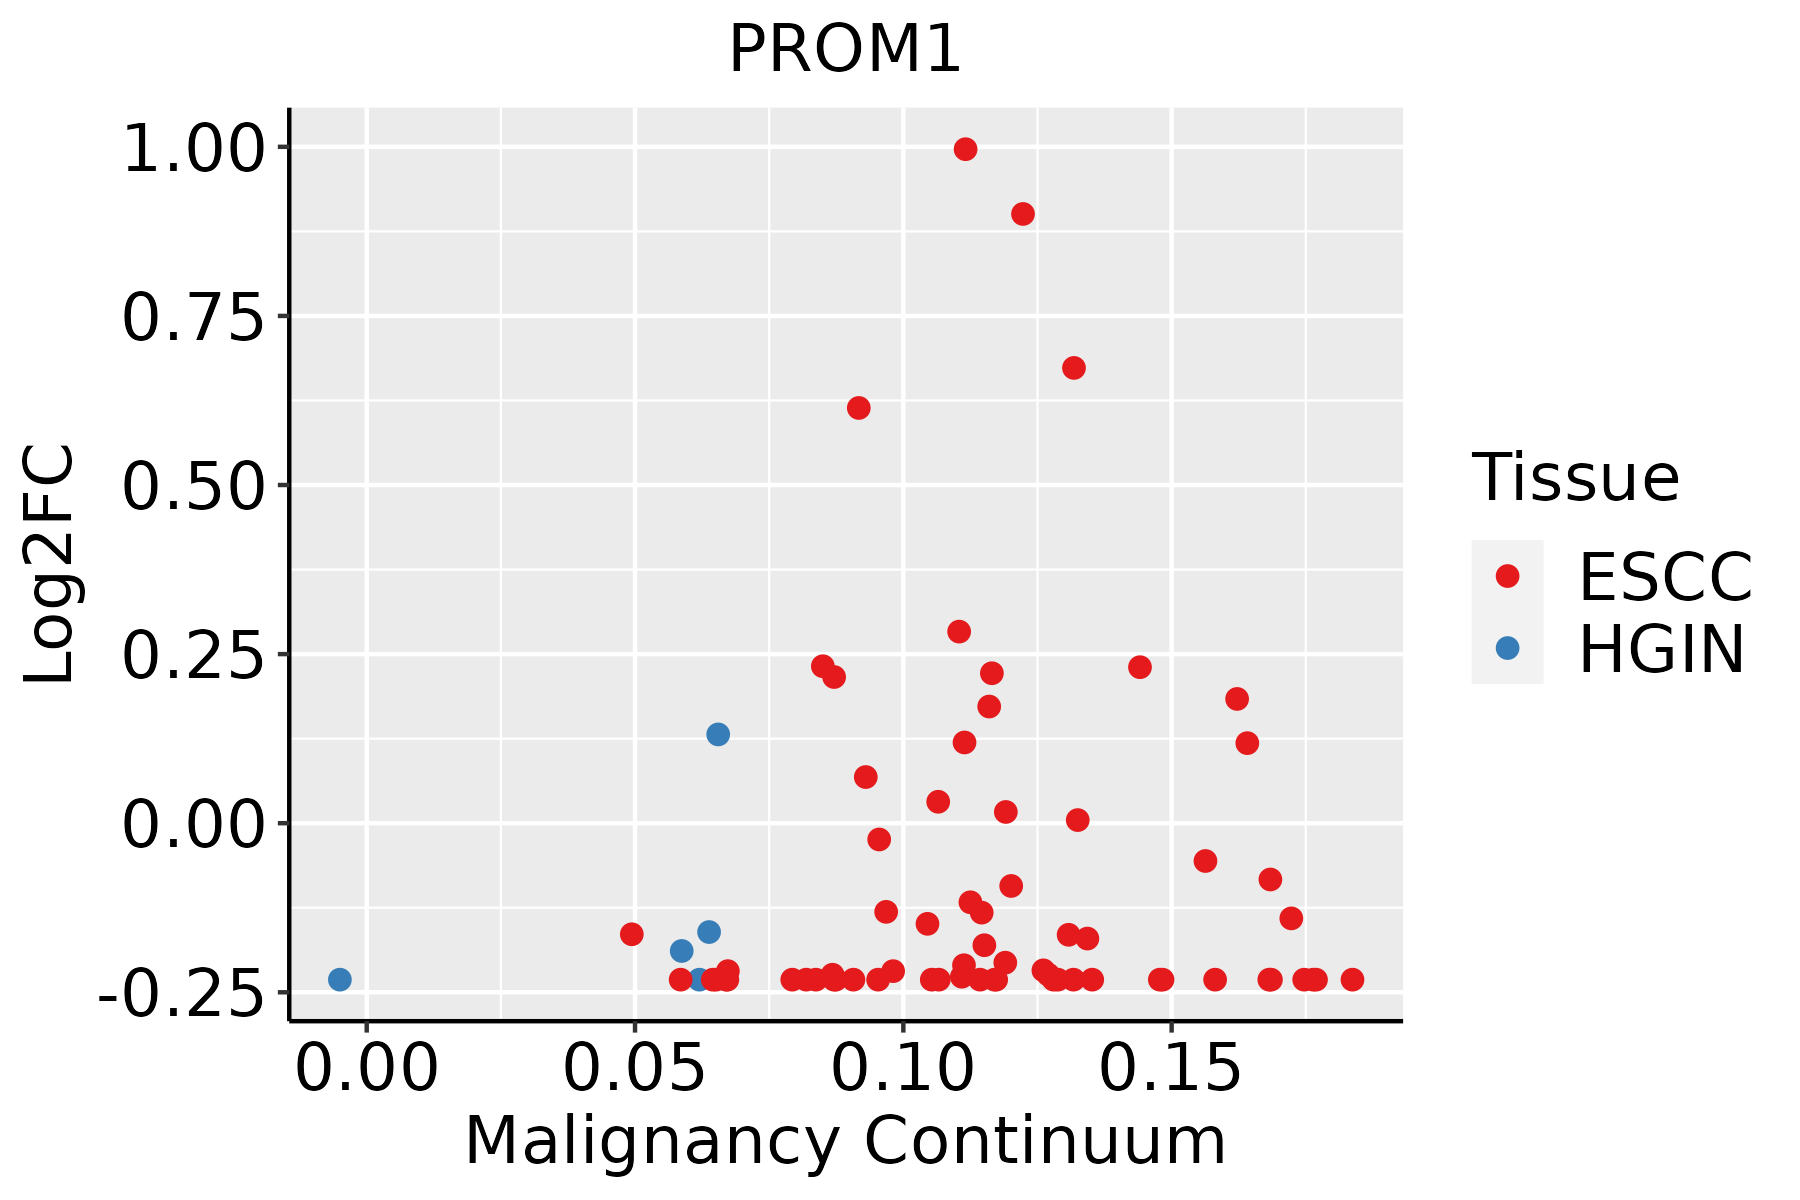 | ESCC: Esophageal squamous cell carcinoma |
| HGIN: High-grade intraepithelial neoplasias | ||
| LGIN: Low-grade intraepithelial neoplasias |
| ∗log2FC in expression of this searched gene in stem-like cells from each diseased tissue sample relative to stem-like cells in normal samples in each tissue plotted against the malignancy continuum. Samples are colored based on if they are from different disease stage. |
Top |
Malignant transformation related pathway analysis |
| Find out the enriched GO biological processes and KEGG pathways involved in transition from healthy to precancer to cancer |
| Tissue | Disease Stage | Enriched GO biological Processes |
| Colorectum | AD |  |
| Colorectum | SER |  |
| Colorectum | MSS |  |
| Colorectum | MSI-H |  |
| Colorectum | FAP |  |
| ∗Top 15 enriched GO BP terms are showed in the bar plot of each disease state in each tissue. Each row represents a significant GO biological process which is colored according to the -log10(p.adjust). |
| Page: 1 2 3 4 5 6 7 8 9 |
| GO ID | Tissue | Disease Stage | Description | Gene Ratio | Bg Ratio | pvalue | p.adjust | Count |
| GO:0060249 | Colorectum | AD | anatomical structure homeostasis | 94/3918 | 314/18723 | 9.37e-05 | 1.42e-03 | 94 |
| GO:0001894 | Colorectum | AD | tissue homeostasis | 81/3918 | 268/18723 | 1.96e-04 | 2.62e-03 | 81 |
| GO:0061318 | Colorectum | AD | renal filtration cell differentiation | 10/3918 | 20/18723 | 3.67e-03 | 2.60e-02 | 10 |
| GO:0072112 | Colorectum | AD | glomerular visceral epithelial cell differentiation | 10/3918 | 20/18723 | 3.67e-03 | 2.60e-02 | 10 |
| GO:0072073 | Colorectum | AD | kidney epithelium development | 42/3918 | 136/18723 | 4.02e-03 | 2.80e-02 | 42 |
| GO:0072311 | Colorectum | AD | glomerular epithelial cell differentiation | 10/3918 | 21/18723 | 5.71e-03 | 3.64e-02 | 10 |
| GO:00602492 | Colorectum | MSS | anatomical structure homeostasis | 84/3467 | 314/18723 | 1.87e-04 | 2.64e-03 | 84 |
| GO:00018942 | Colorectum | MSS | tissue homeostasis | 72/3467 | 268/18723 | 4.53e-04 | 5.40e-03 | 72 |
| GO:00720731 | Colorectum | MSS | kidney epithelium development | 38/3467 | 136/18723 | 4.53e-03 | 3.19e-02 | 38 |
| GO:0001655 | Colorectum | MSS | urogenital system development | 81/3467 | 338/18723 | 6.88e-03 | 4.43e-02 | 81 |
| GO:0072160 | Colorectum | MSS | nephron tubule epithelial cell differentiation | 7/3467 | 14/18723 | 7.51e-03 | 4.72e-02 | 7 |
| GO:00602493 | Colorectum | MSI-H | anatomical structure homeostasis | 38/1319 | 314/18723 | 7.73e-04 | 1.44e-02 | 38 |
| GO:00018943 | Colorectum | MSI-H | tissue homeostasis | 33/1319 | 268/18723 | 1.24e-03 | 2.00e-02 | 33 |
| GO:00018944 | Colorectum | FAP | tissue homeostasis | 61/2622 | 268/18723 | 6.71e-05 | 1.28e-03 | 61 |
| GO:00602494 | Colorectum | FAP | anatomical structure homeostasis | 69/2622 | 314/18723 | 7.51e-05 | 1.37e-03 | 69 |
| GO:00721601 | Colorectum | FAP | nephron tubule epithelial cell differentiation | 8/2622 | 14/18723 | 1.99e-04 | 2.89e-03 | 8 |
| GO:00720732 | Colorectum | FAP | kidney epithelium development | 35/2622 | 136/18723 | 2.03e-04 | 2.92e-03 | 35 |
| GO:00016551 | Colorectum | FAP | urogenital system development | 70/2622 | 338/18723 | 4.26e-04 | 5.11e-03 | 70 |
| GO:0072001 | Colorectum | FAP | renal system development | 63/2622 | 302/18723 | 6.59e-04 | 7.19e-03 | 63 |
| GO:0001822 | Colorectum | FAP | kidney development | 61/2622 | 293/18723 | 8.38e-04 | 8.72e-03 | 61 |
| Page: 1 2 3 |
| Pathway ID | Tissue | Disease Stage | Description | Gene Ratio | Bg Ratio | pvalue | p.adjust | qvalue | Count |
| hsa05202 | Colorectum | FAP | Transcriptional misregulation in cancer | 45/1404 | 193/8465 | 9.19e-03 | 3.33e-02 | 2.03e-02 | 45 |
| hsa052021 | Colorectum | FAP | Transcriptional misregulation in cancer | 45/1404 | 193/8465 | 9.19e-03 | 3.33e-02 | 2.03e-02 | 45 |
| hsa052028 | Esophagus | ESCC | Transcriptional misregulation in cancer | 116/4205 | 193/8465 | 2.08e-03 | 5.95e-03 | 3.05e-03 | 116 |
| hsa0520213 | Esophagus | ESCC | Transcriptional misregulation in cancer | 116/4205 | 193/8465 | 2.08e-03 | 5.95e-03 | 3.05e-03 | 116 |
| Page: 1 |
Top |
Cell-cell communication analysis |
| Identification of potential cell-cell interactions between two cell types and their ligand-receptor pairs for different disease states |
| Ligand | Receptor | LRpair | Pathway | Tissue | Disease Stage |
| Page: 1 |
Top |
Single-cell gene regulatory network inference analysis |
| Find out the significant the regulons (TFs) and the target genes of each regulon across cell types for different disease states |
| TF | Cell Type | Tissue | Disease Stage | Target Gene | RSS | Regulon Activity |
| ∗The dot plots of a searched regulon are shown for all cell subpopulations in each disease state of each tissue based on the regulon specific score inferred using pySCENIC and by calculating the average expression. |
| Page: 1 |
Top |
Somatic mutation of malignant transformation related genes |
| Annotation of somatic variants for genes involved in malignant transformation |
| Hugo Symbol | Variant Class | Variant Classification | dbSNP RS | HGVSc | HGVSp | HGVSp Short | SWISSPROT | BIOTYPE | SIFT | PolyPhen | Tumor Sample Barcode | Tissue | Histology | Sex | Age | Stage | Therapy Types | Drugs | Outcome |
| PROM1 | SNV | Missense_Mutation | c.2059C>G | p.Pro687Ala | p.P687A | O43490 | protein_coding | deleterious(0.02) | probably_damaging(0.984) | TCGA-AN-A0FL-01 | Breast | breast invasive carcinoma | Female | <65 | I/II | Unknown | Unknown | SD | |
| PROM1 | SNV | Missense_Mutation | c.2277C>G | p.Phe759Leu | p.F759L | O43490 | protein_coding | tolerated(0.64) | benign(0.011) | TCGA-BH-A0HK-01 | Breast | breast invasive carcinoma | Female | >=65 | I/II | Hormone Therapy | arimidex | SD | |
| PROM1 | SNV | Missense_Mutation | c.1146N>G | p.Ile382Met | p.I382M | O43490 | protein_coding | deleterious(0.05) | benign(0.326) | TCGA-BH-A0HP-01 | Breast | breast invasive carcinoma | Female | >=65 | III/IV | Chemotherapy | doxorubicin | SD | |
| PROM1 | insertion | Nonsense_Mutation | novel | c.1088_1089insAGAATATTAATTTTA | p.Ser363_Leu364insGluTyrTerPheTyr | p.S363_L364insEY*FY | O43490 | protein_coding | TCGA-A2-A0EQ-01 | Breast | breast invasive carcinoma | Female | <65 | I/II | Chemotherapy | adriamycin | SD | ||
| PROM1 | insertion | Frame_Shift_Ins | novel | c.1087_1088insTTCCAAAATACATTCAA | p.Ser363PhefsTer23 | p.S363Ffs*23 | O43490 | protein_coding | TCGA-A2-A0EQ-01 | Breast | breast invasive carcinoma | Female | <65 | I/II | Chemotherapy | adriamycin | SD | ||
| PROM1 | insertion | Nonsense_Mutation | novel | c.641_642insG | p.Tyr214Ter | p.Y214* | O43490 | protein_coding | TCGA-A2-A0EX-01 | Breast | breast invasive carcinoma | Female | <65 | I/II | Hormone Therapy | tamoxiphen | SD | ||
| PROM1 | insertion | Frame_Shift_Ins | novel | c.640_641insGGGTTTTGCAGCAGGAGGGGCTTGAGGCAGTGTGGAG | p.Tyr214TrpfsTer42 | p.Y214Wfs*42 | O43490 | protein_coding | TCGA-A2-A0EX-01 | Breast | breast invasive carcinoma | Female | <65 | I/II | Hormone Therapy | tamoxiphen | SD | ||
| PROM1 | insertion | Frame_Shift_Ins | novel | c.2536_2537insT | p.Tyr846LeufsTer3 | p.Y846Lfs*3 | O43490 | protein_coding | TCGA-BH-A1FC-01 | Breast | breast invasive carcinoma | Female | >=65 | I/II | Unknown | Unknown | SD | ||
| PROM1 | deletion | Frame_Shift_Del | c.230delN | p.Arg77LysfsTer20 | p.R77Kfs*20 | O43490 | protein_coding | TCGA-C8-A26X-01 | Breast | breast invasive carcinoma | Female | <65 | I/II | Chemotherapy | 5-fluorouracil | CR | |||
| PROM1 | deletion | Frame_Shift_Del | novel | c.1641delN | p.Phe547LeufsTer6 | p.F547Lfs*6 | O43490 | protein_coding | TCGA-EW-A2FV-01 | Breast | breast invasive carcinoma | Female | <65 | III/IV | Chemotherapy | docetaxel | SD |
| Page: 1 2 3 4 5 6 7 8 |
Top |
Related drugs of malignant transformation related genes |
| Identification of chemicals and drugs interact with genes involved in malignant transfromation |
| (DGIdb 4.0) |
| Entrez ID | Symbol | Category | Interaction Types | Drug Claim Name | Drug Name | PMIDs |
| 8842 | PROM1 | CELL SURFACE, DRUGGABLE GENOME | CAR-T cells targeting CD133 | |||
| 8842 | PROM1 | CELL SURFACE, DRUGGABLE GENOME | ICT-121 | 25691822 | ||
| 8842 | PROM1 | CELL SURFACE, DRUGGABLE GENOME | Anti-CD133-CAR vector-transduced T cells |
| Page: 1 |

Copyright 2023-Present -The University of Texas Health Science Center at Houston |