
|
|||||
|
 | |
| |
| |
| |
| |
| |
|
Gene: PROCR |
Gene summary for PROCR |
| Gene information | Species | Human | Gene symbol | PROCR | Gene ID | 10544 |
| Gene name | protein C receptor | |
| Gene Alias | CCCA | |
| Cytomap | 20q11.22 | |
| Gene Type | protein-coding | GO ID | GO:0006950 | UniProtAcc | Q9UNN8 |
Top |
Malignant transformation analysis |
| Identification of the aberrant gene expression in precancerous and cancerous lesions by comparing the gene expression of stem-like cells in diseased tissues with normal stem cells |
| Entrez ID | Symbol | Replicates | Species | Organ | Tissue | Adj P-value | Log2FC | Malignancy |
| 10544 | PROCR | LZE4T | Human | Esophagus | ESCC | 2.21e-05 | 1.39e-01 | 0.0811 |
| 10544 | PROCR | P4T-E | Human | Esophagus | ESCC | 1.43e-13 | 4.08e-01 | 0.1323 |
| 10544 | PROCR | P5T-E | Human | Esophagus | ESCC | 2.33e-12 | 1.86e-01 | 0.1327 |
| 10544 | PROCR | P8T-E | Human | Esophagus | ESCC | 2.95e-07 | 1.89e-01 | 0.0889 |
| 10544 | PROCR | P9T-E | Human | Esophagus | ESCC | 2.35e-24 | 4.89e-01 | 0.1131 |
| 10544 | PROCR | P10T-E | Human | Esophagus | ESCC | 1.97e-06 | 1.72e-01 | 0.116 |
| 10544 | PROCR | P11T-E | Human | Esophagus | ESCC | 1.11e-09 | 4.43e-01 | 0.1426 |
| 10544 | PROCR | P15T-E | Human | Esophagus | ESCC | 4.85e-12 | 3.36e-01 | 0.1149 |
| 10544 | PROCR | P17T-E | Human | Esophagus | ESCC | 3.96e-02 | 1.23e-01 | 0.1278 |
| 10544 | PROCR | P20T-E | Human | Esophagus | ESCC | 1.45e-09 | 1.18e-01 | 0.1124 |
| 10544 | PROCR | P21T-E | Human | Esophagus | ESCC | 2.79e-69 | 1.96e+00 | 0.1617 |
| 10544 | PROCR | P22T-E | Human | Esophagus | ESCC | 1.10e-05 | 5.24e-02 | 0.1236 |
| 10544 | PROCR | P23T-E | Human | Esophagus | ESCC | 5.83e-06 | 2.27e-01 | 0.108 |
| 10544 | PROCR | P24T-E | Human | Esophagus | ESCC | 1.40e-10 | 2.28e-01 | 0.1287 |
| 10544 | PROCR | P26T-E | Human | Esophagus | ESCC | 2.49e-73 | 1.37e+00 | 0.1276 |
| 10544 | PROCR | P27T-E | Human | Esophagus | ESCC | 3.38e-06 | -2.77e-03 | 0.1055 |
| 10544 | PROCR | P28T-E | Human | Esophagus | ESCC | 3.57e-08 | 2.54e-01 | 0.1149 |
| 10544 | PROCR | P31T-E | Human | Esophagus | ESCC | 6.14e-06 | 1.46e-01 | 0.1251 |
| 10544 | PROCR | P32T-E | Human | Esophagus | ESCC | 6.45e-58 | 1.49e+00 | 0.1666 |
| 10544 | PROCR | P36T-E | Human | Esophagus | ESCC | 1.16e-07 | 2.62e-01 | 0.1187 |
| Page: 1 2 3 4 |
| Tissue | Expression Dynamics | Abbreviation |
| Esophagus | 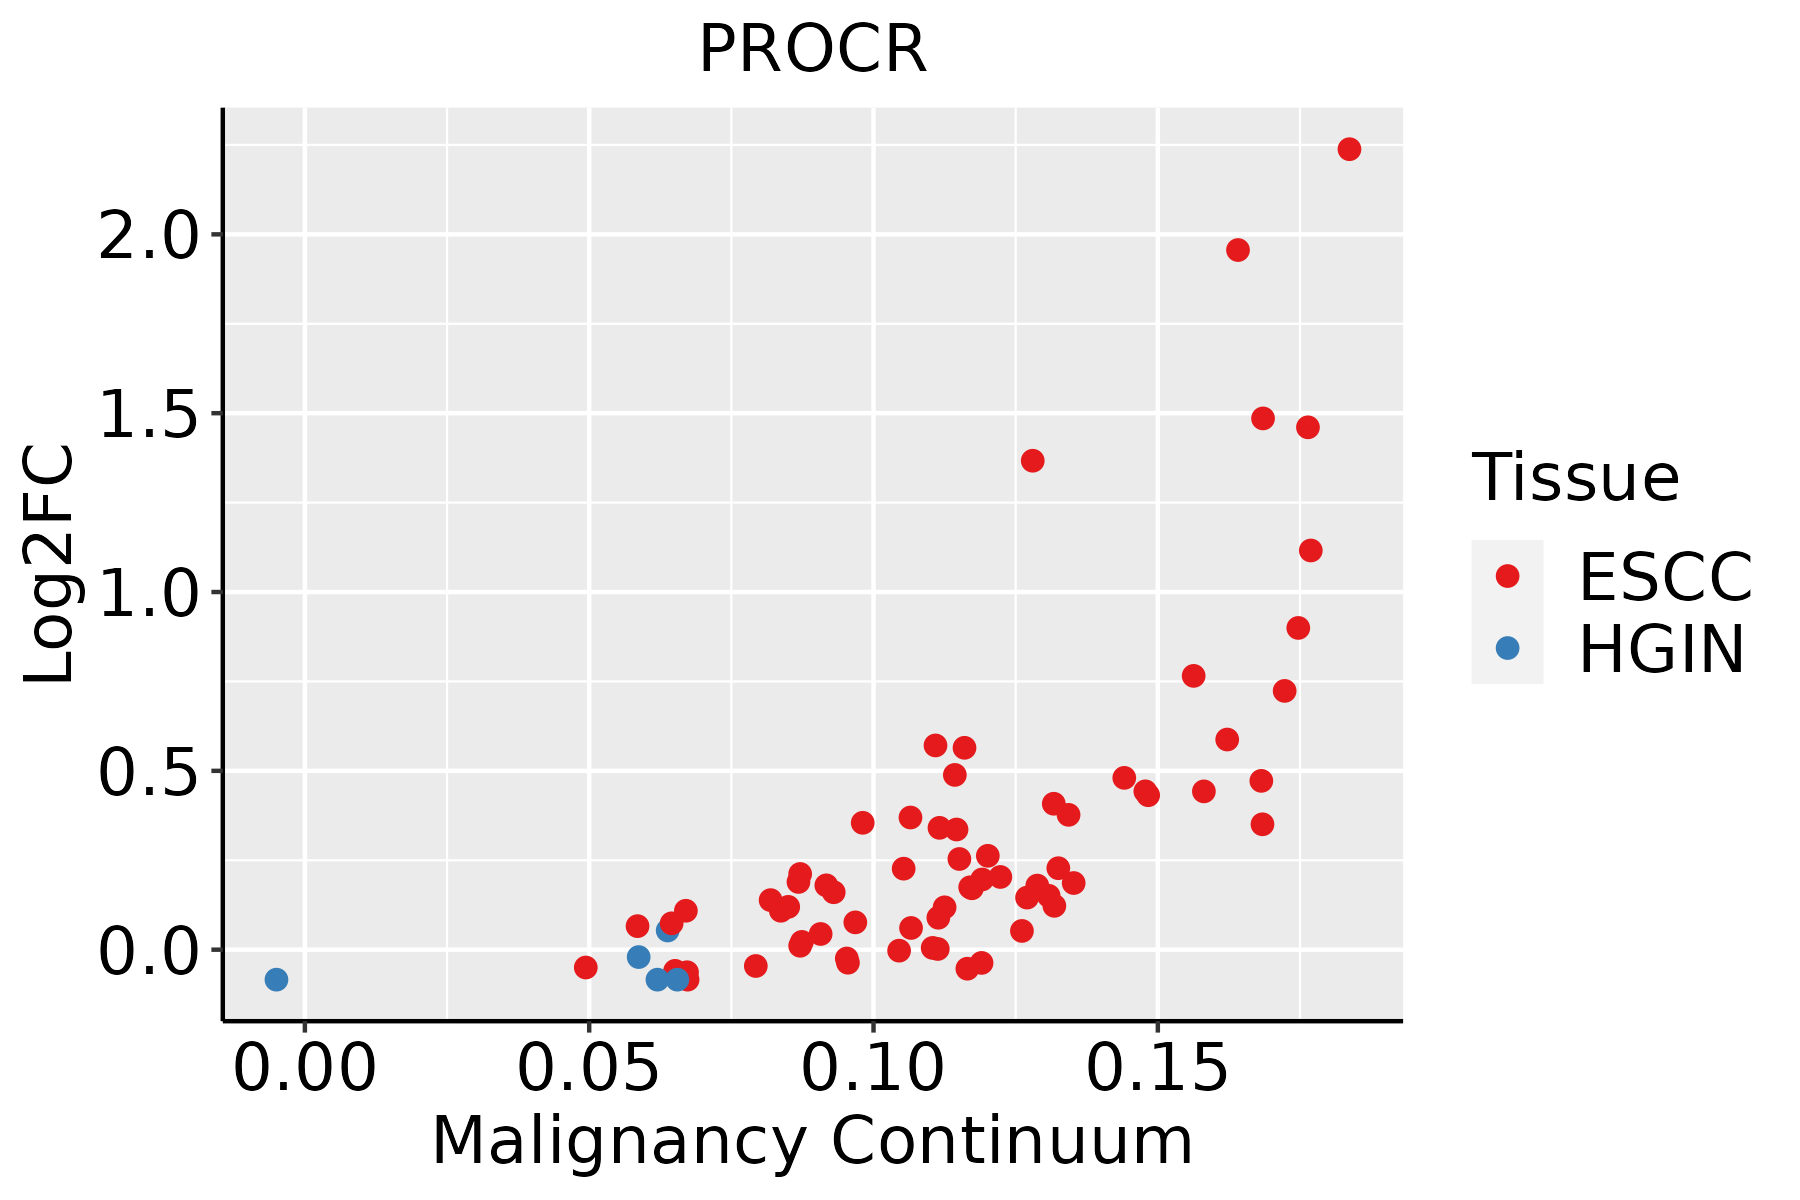 | ESCC: Esophageal squamous cell carcinoma |
| HGIN: High-grade intraepithelial neoplasias | ||
| LGIN: Low-grade intraepithelial neoplasias | ||
| Oral Cavity |  | EOLP: Erosive Oral lichen planus |
| LP: leukoplakia | ||
| NEOLP: Non-erosive oral lichen planus | ||
| OSCC: Oral squamous cell carcinoma | ||
| Skin |  | AK: Actinic keratosis |
| cSCC: Cutaneous squamous cell carcinoma | ||
| SCCIS:squamous cell carcinoma in situ | ||
| Thyroid |  | ATC: Anaplastic thyroid cancer |
| HT: Hashimoto's thyroiditis | ||
| PTC: Papillary thyroid cancer |
| ∗log2FC in expression of this searched gene in stem-like cells from each diseased tissue sample relative to stem-like cells in normal samples in each tissue plotted against the malignancy continuum. Samples are colored based on if they are from different disease stage. |
Top |
Malignant transformation related pathway analysis |
| Find out the enriched GO biological processes and KEGG pathways involved in transition from healthy to precancer to cancer |
| Tissue | Disease Stage | Enriched GO biological Processes |
| Colorectum | AD |  |
| Colorectum | SER |  |
| Colorectum | MSS |  |
| Colorectum | MSI-H |  |
| Colorectum | FAP |  |
| ∗Top 15 enriched GO BP terms are showed in the bar plot of each disease state in each tissue. Each row represents a significant GO biological process which is colored according to the -log10(p.adjust). |
| Page: 1 2 3 4 5 6 7 8 9 |
| GO ID | Tissue | Disease Stage | Description | Gene Ratio | Bg Ratio | pvalue | p.adjust | Count |
| GO:004206027 | Esophagus | ESCC | wound healing | 243/8552 | 422/18723 | 4.62e-07 | 6.25e-06 | 243 |
| GO:004206020 | Oral cavity | OSCC | wound healing | 237/7305 | 422/18723 | 4.51e-13 | 2.18e-11 | 237 |
| GO:005087819 | Oral cavity | OSCC | regulation of body fluid levels | 179/7305 | 379/18723 | 6.19e-04 | 3.50e-03 | 179 |
| GO:00075969 | Oral cavity | OSCC | blood coagulation | 102/7305 | 217/18723 | 9.69e-03 | 3.43e-02 | 102 |
| GO:00075999 | Oral cavity | OSCC | hemostasis | 103/7305 | 222/18723 | 1.45e-02 | 4.73e-02 | 103 |
| GO:00508179 | Oral cavity | OSCC | coagulation | 103/7305 | 222/18723 | 1.45e-02 | 4.73e-02 | 103 |
| GO:0042060110 | Oral cavity | LP | wound healing | 139/4623 | 422/18723 | 7.10e-05 | 9.48e-04 | 139 |
| GO:004206026 | Oral cavity | EOLP | wound healing | 99/2218 | 422/18723 | 1.18e-11 | 1.85e-09 | 99 |
| GO:005081715 | Oral cavity | EOLP | coagulation | 43/2218 | 222/18723 | 7.59e-04 | 6.09e-03 | 43 |
| GO:000759615 | Oral cavity | EOLP | blood coagulation | 42/2218 | 217/18723 | 8.81e-04 | 6.76e-03 | 42 |
| GO:000759915 | Oral cavity | EOLP | hemostasis | 42/2218 | 222/18723 | 1.40e-03 | 9.58e-03 | 42 |
| GO:0050878110 | Oral cavity | EOLP | regulation of body fluid levels | 63/2218 | 379/18723 | 3.36e-03 | 1.94e-02 | 63 |
| GO:004206033 | Oral cavity | NEOLP | wound healing | 106/2005 | 422/18723 | 1.93e-17 | 1.91e-14 | 106 |
| GO:005081722 | Oral cavity | NEOLP | coagulation | 48/2005 | 222/18723 | 1.51e-06 | 3.77e-05 | 48 |
| GO:000759621 | Oral cavity | NEOLP | blood coagulation | 47/2005 | 217/18723 | 1.84e-06 | 4.44e-05 | 47 |
| GO:000759921 | Oral cavity | NEOLP | hemostasis | 47/2005 | 222/18723 | 3.57e-06 | 7.85e-05 | 47 |
| GO:005087825 | Oral cavity | NEOLP | regulation of body fluid levels | 70/2005 | 379/18723 | 3.62e-06 | 7.94e-05 | 70 |
| GO:00508184 | Oral cavity | NEOLP | regulation of coagulation | 16/2005 | 71/18723 | 2.95e-03 | 1.81e-02 | 16 |
| GO:004206029 | Skin | cSCC | wound healing | 152/4864 | 422/18723 | 2.66e-06 | 4.26e-05 | 152 |
| GO:004206034 | Thyroid | ATC | wound healing | 210/6293 | 422/18723 | 3.33e-12 | 1.37e-10 | 210 |
| Page: 1 2 |
| Pathway ID | Tissue | Disease Stage | Description | Gene Ratio | Bg Ratio | pvalue | p.adjust | qvalue | Count |
| Page: 1 |
Top |
Cell-cell communication analysis |
| Identification of potential cell-cell interactions between two cell types and their ligand-receptor pairs for different disease states |
| Ligand | Receptor | LRpair | Pathway | Tissue | Disease Stage |
| Page: 1 |
Top |
Single-cell gene regulatory network inference analysis |
| Find out the significant the regulons (TFs) and the target genes of each regulon across cell types for different disease states |
| TF | Cell Type | Tissue | Disease Stage | Target Gene | RSS | Regulon Activity |
| ∗The dot plots of a searched regulon are shown for all cell subpopulations in each disease state of each tissue based on the regulon specific score inferred using pySCENIC and by calculating the average expression. |
| Page: 1 |
Top |
Somatic mutation of malignant transformation related genes |
| Annotation of somatic variants for genes involved in malignant transformation |
| Hugo Symbol | Variant Class | Variant Classification | dbSNP RS | HGVSc | HGVSp | HGVSp Short | SWISSPROT | BIOTYPE | SIFT | PolyPhen | Tumor Sample Barcode | Tissue | Histology | Sex | Age | Stage | Therapy Types | Drugs | Outcome |
| PROCR | SNV | Missense_Mutation | novel | c.201N>G | p.Ile67Met | p.I67M | Q9UNN8 | protein_coding | deleterious(0) | probably_damaging(0.962) | TCGA-3C-AALI-01 | Breast | breast invasive carcinoma | Female | <65 | I/II | Unspecific | Poly E | Complete Response |
| PROCR | SNV | Missense_Mutation | novel | c.545T>G | p.Leu182Arg | p.L182R | Q9UNN8 | protein_coding | deleterious(0) | probably_damaging(0.999) | TCGA-A2-A3Y0-01 | Breast | breast invasive carcinoma | Female | <65 | I/II | Chemotherapy | adriamycin | CR |
| PROCR | SNV | Missense_Mutation | rs762831201 | c.611N>A | p.Thr204Lys | p.T204K | Q9UNN8 | protein_coding | tolerated(0.19) | possibly_damaging(0.555) | TCGA-A8-A06R-01 | Breast | breast invasive carcinoma | Female | >=65 | I/II | Chemotherapy | 5-fluorouracil | CR |
| PROCR | SNV | Missense_Mutation | c.6G>T | p.Leu2Phe | p.L2F | Q9UNN8 | protein_coding | tolerated_low_confidence(0.2) | possibly_damaging(0.605) | TCGA-AC-A23H-01 | Breast | breast invasive carcinoma | Female | >=65 | I/II | Unknown | Unknown | PD | |
| PROCR | SNV | Missense_Mutation | c.390N>A | p.Phe130Leu | p.F130L | Q9UNN8 | protein_coding | deleterious(0) | possibly_damaging(0.776) | TCGA-AN-A0AJ-01 | Breast | breast invasive carcinoma | Female | >=65 | I/II | Unknown | Unknown | SD | |
| PROCR | SNV | Missense_Mutation | rs762831201 | c.611N>A | p.Thr204Lys | p.T204K | Q9UNN8 | protein_coding | tolerated(0.19) | possibly_damaging(0.555) | TCGA-AR-A1AP-01 | Breast | breast invasive carcinoma | Female | >=65 | I/II | Hormone Therapy | anastrozole | SD |
| PROCR | SNV | Missense_Mutation | rs762831201 | c.611C>A | p.Thr204Lys | p.T204K | Q9UNN8 | protein_coding | tolerated(0.19) | possibly_damaging(0.555) | TCGA-BH-A1EN-01 | Breast | breast invasive carcinoma | Female | >=65 | I/II | Unknown | Unknown | SD |
| PROCR | SNV | Missense_Mutation | rs762831201 | c.611N>A | p.Thr204Lys | p.T204K | Q9UNN8 | protein_coding | tolerated(0.19) | possibly_damaging(0.555) | TCGA-C8-A12X-01 | Breast | breast invasive carcinoma | Female | <65 | I/II | Unknown | Unknown | SD |
| PROCR | SNV | Missense_Mutation | rs762831201 | c.611C>A | p.Thr204Lys | p.T204K | Q9UNN8 | protein_coding | tolerated(0.19) | possibly_damaging(0.555) | TCGA-D8-A1XG-01 | Breast | breast invasive carcinoma | Female | >=65 | III/IV | Unknown | Unknown | SD |
| PROCR | SNV | Missense_Mutation | c.517N>T | p.Arg173Cys | p.R173C | Q9UNN8 | protein_coding | deleterious(0) | probably_damaging(0.962) | TCGA-EK-A3GK-01 | Cervix | cervical & endocervical cancer | Female | <65 | I/II | Unknown | Unknown | SD |
| Page: 1 2 3 4 |
Top |
Related drugs of malignant transformation related genes |
| Identification of chemicals and drugs interact with genes involved in malignant transfromation |
| (DGIdb 4.0) |
| Entrez ID | Symbol | Category | Interaction Types | Drug Claim Name | Drug Name | PMIDs |
| 10544 | PROCR | DRUGGABLE GENOME, CELL SURFACE | GED-APC |
| Page: 1 |

Copyright 2023-Present -The University of Texas Health Science Center at Houston |