
|
|||||
|
 | |
| |
| |
| |
| |
| |
|
Gene: PRMT7 |
Gene summary for PRMT7 |
| Gene information | Species | Human | Gene symbol | PRMT7 | Gene ID | 54496 |
| Gene name | protein arginine methyltransferase 7 | |
| Gene Alias | SBIDDS | |
| Cytomap | 16q22.1 | |
| Gene Type | protein-coding | GO ID | GO:0000003 | UniProtAcc | Q9NVM4 |
Top |
Malignant transformation analysis |
| Identification of the aberrant gene expression in precancerous and cancerous lesions by comparing the gene expression of stem-like cells in diseased tissues with normal stem cells |
| Entrez ID | Symbol | Replicates | Species | Organ | Tissue | Adj P-value | Log2FC | Malignancy |
| 54496 | PRMT7 | LZE4T | Human | Esophagus | ESCC | 3.91e-08 | 2.00e-01 | 0.0811 |
| 54496 | PRMT7 | LZE7T | Human | Esophagus | ESCC | 6.08e-08 | 5.17e-01 | 0.0667 |
| 54496 | PRMT7 | LZE8T | Human | Esophagus | ESCC | 7.15e-08 | 1.90e-01 | 0.067 |
| 54496 | PRMT7 | LZE24T | Human | Esophagus | ESCC | 2.20e-05 | 2.20e-01 | 0.0596 |
| 54496 | PRMT7 | LZE21T | Human | Esophagus | ESCC | 2.31e-03 | 1.74e-01 | 0.0655 |
| 54496 | PRMT7 | P1T-E | Human | Esophagus | ESCC | 6.07e-12 | 3.66e-01 | 0.0875 |
| 54496 | PRMT7 | P2T-E | Human | Esophagus | ESCC | 2.32e-21 | 5.47e-01 | 0.1177 |
| 54496 | PRMT7 | P4T-E | Human | Esophagus | ESCC | 1.99e-12 | 2.59e-01 | 0.1323 |
| 54496 | PRMT7 | P5T-E | Human | Esophagus | ESCC | 3.91e-10 | 1.33e-01 | 0.1327 |
| 54496 | PRMT7 | P8T-E | Human | Esophagus | ESCC | 3.99e-18 | 2.83e-01 | 0.0889 |
| 54496 | PRMT7 | P9T-E | Human | Esophagus | ESCC | 6.93e-04 | 5.48e-02 | 0.1131 |
| 54496 | PRMT7 | P10T-E | Human | Esophagus | ESCC | 6.06e-07 | 1.29e-01 | 0.116 |
| 54496 | PRMT7 | P11T-E | Human | Esophagus | ESCC | 2.25e-10 | 3.57e-01 | 0.1426 |
| 54496 | PRMT7 | P12T-E | Human | Esophagus | ESCC | 1.12e-13 | 2.15e-01 | 0.1122 |
| 54496 | PRMT7 | P15T-E | Human | Esophagus | ESCC | 1.15e-12 | 1.71e-01 | 0.1149 |
| 54496 | PRMT7 | P16T-E | Human | Esophagus | ESCC | 4.36e-11 | 2.10e-01 | 0.1153 |
| 54496 | PRMT7 | P17T-E | Human | Esophagus | ESCC | 1.96e-02 | 1.42e-01 | 0.1278 |
| 54496 | PRMT7 | P19T-E | Human | Esophagus | ESCC | 1.13e-02 | 2.50e-01 | 0.1662 |
| 54496 | PRMT7 | P20T-E | Human | Esophagus | ESCC | 5.15e-11 | 2.24e-01 | 0.1124 |
| 54496 | PRMT7 | P21T-E | Human | Esophagus | ESCC | 1.98e-14 | 2.51e-01 | 0.1617 |
| Page: 1 2 3 4 |
| Tissue | Expression Dynamics | Abbreviation |
| Esophagus | 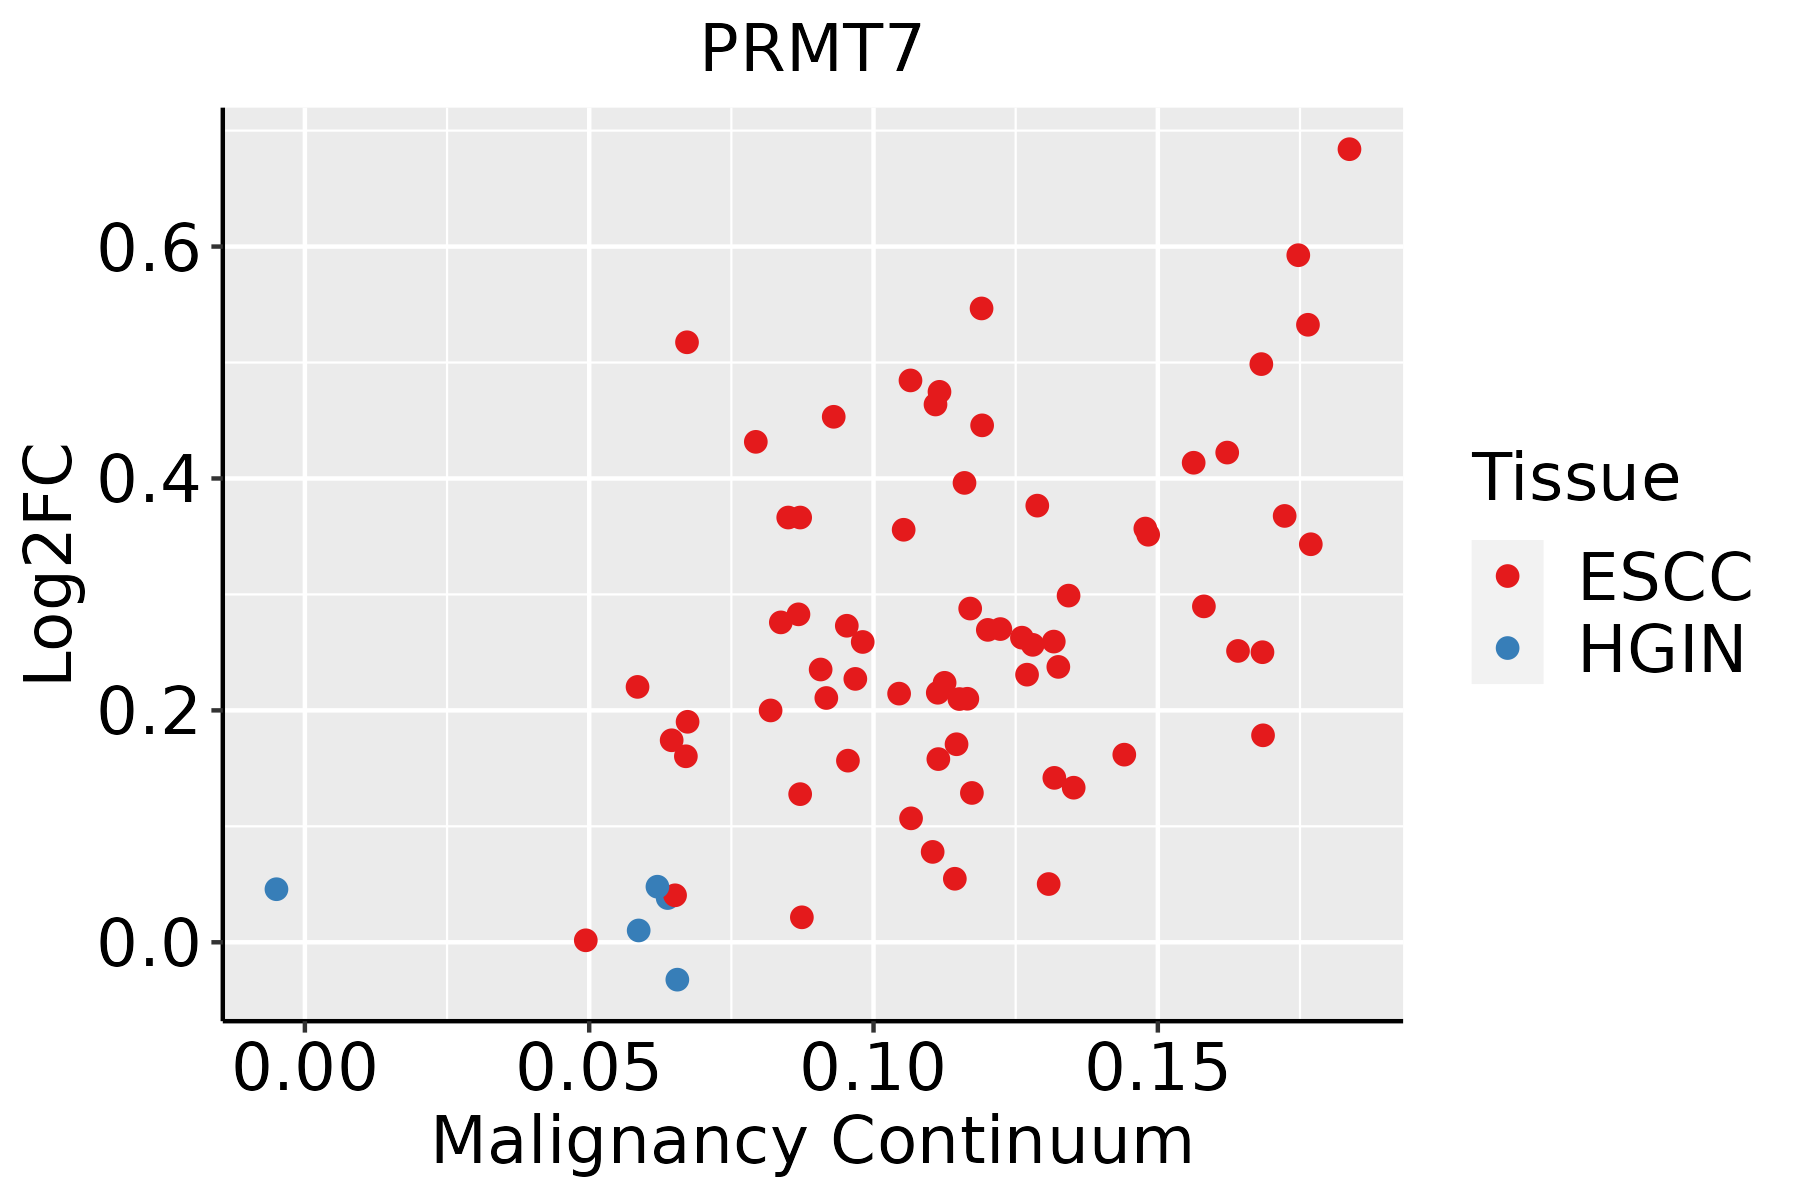 | ESCC: Esophageal squamous cell carcinoma |
| HGIN: High-grade intraepithelial neoplasias | ||
| LGIN: Low-grade intraepithelial neoplasias |
| ∗log2FC in expression of this searched gene in stem-like cells from each diseased tissue sample relative to stem-like cells in normal samples in each tissue plotted against the malignancy continuum. Samples are colored based on if they are from different disease stage. |
Top |
Malignant transformation related pathway analysis |
| Find out the enriched GO biological processes and KEGG pathways involved in transition from healthy to precancer to cancer |
| Tissue | Disease Stage | Enriched GO biological Processes |
| Colorectum | AD |  |
| Colorectum | SER |  |
| Colorectum | MSS |  |
| Colorectum | MSI-H |  |
| Colorectum | FAP |  |
| ∗Top 15 enriched GO BP terms are showed in the bar plot of each disease state in each tissue. Each row represents a significant GO biological process which is colored according to the -log10(p.adjust). |
| Page: 1 2 3 4 5 6 7 8 9 |
| GO ID | Tissue | Disease Stage | Description | Gene Ratio | Bg Ratio | pvalue | p.adjust | Count |
| GO:0022613111 | Esophagus | ESCC | ribonucleoprotein complex biogenesis | 365/8552 | 463/18723 | 1.74e-49 | 1.11e-45 | 365 |
| GO:0008380111 | Esophagus | ESCC | RNA splicing | 336/8552 | 434/18723 | 1.74e-42 | 3.67e-39 | 336 |
| GO:0000375111 | Esophagus | ESCC | RNA splicing, via transesterification reactions | 248/8552 | 324/18723 | 3.05e-30 | 1.49e-27 | 248 |
| GO:0000377111 | Esophagus | ESCC | RNA splicing, via transesterification reactions with bulged adenosine as nucleophile | 244/8552 | 320/18723 | 2.52e-29 | 1.07e-26 | 244 |
| GO:0000398111 | Esophagus | ESCC | mRNA splicing, via spliceosome | 244/8552 | 320/18723 | 2.52e-29 | 1.07e-26 | 244 |
| GO:001657015 | Esophagus | ESCC | histone modification | 323/8552 | 463/18723 | 2.61e-26 | 7.88e-24 | 323 |
| GO:0051098111 | Esophagus | ESCC | regulation of binding | 251/8552 | 363/18723 | 6.73e-20 | 8.46e-18 | 251 |
| GO:0071826111 | Esophagus | ESCC | ribonucleoprotein complex subunit organization | 166/8552 | 227/18723 | 2.94e-17 | 2.42e-15 | 166 |
| GO:0022618111 | Esophagus | ESCC | ribonucleoprotein complex assembly | 159/8552 | 220/18723 | 8.19e-16 | 5.71e-14 | 159 |
| GO:004339320 | Esophagus | ESCC | regulation of protein binding | 135/8552 | 196/18723 | 3.69e-11 | 1.22e-09 | 135 |
| GO:00434143 | Esophagus | ESCC | macromolecule methylation | 199/8552 | 316/18723 | 3.44e-10 | 9.57e-09 | 199 |
| GO:00322592 | Esophagus | ESCC | methylation | 222/8552 | 364/18723 | 2.26e-09 | 5.09e-08 | 222 |
| GO:00400295 | Esophagus | ESCC | regulation of gene expression, epigenetic | 74/8552 | 105/18723 | 2.24e-07 | 3.42e-06 | 74 |
| GO:000647914 | Esophagus | ESCC | protein methylation | 115/8552 | 181/18723 | 9.07e-07 | 1.16e-05 | 115 |
| GO:000821314 | Esophagus | ESCC | protein alkylation | 115/8552 | 181/18723 | 9.07e-07 | 1.16e-05 | 115 |
| GO:00165718 | Esophagus | ESCC | histone methylation | 89/8552 | 141/18723 | 2.17e-05 | 1.87e-04 | 89 |
| GO:00003875 | Esophagus | ESCC | spliceosomal snRNP assembly | 32/8552 | 50/18723 | 6.90e-03 | 2.52e-02 | 32 |
| GO:0006304 | Esophagus | ESCC | DNA modification | 68/8552 | 120/18723 | 9.95e-03 | 3.42e-02 | 68 |
| Page: 1 |
| Pathway ID | Tissue | Disease Stage | Description | Gene Ratio | Bg Ratio | pvalue | p.adjust | qvalue | Count |
| Page: 1 |
Top |
Cell-cell communication analysis |
| Identification of potential cell-cell interactions between two cell types and their ligand-receptor pairs for different disease states |
| Ligand | Receptor | LRpair | Pathway | Tissue | Disease Stage |
| Page: 1 |
Top |
Single-cell gene regulatory network inference analysis |
| Find out the significant the regulons (TFs) and the target genes of each regulon across cell types for different disease states |
| TF | Cell Type | Tissue | Disease Stage | Target Gene | RSS | Regulon Activity |
| ∗The dot plots of a searched regulon are shown for all cell subpopulations in each disease state of each tissue based on the regulon specific score inferred using pySCENIC and by calculating the average expression. |
| Page: 1 |
Top |
Somatic mutation of malignant transformation related genes |
| Annotation of somatic variants for genes involved in malignant transformation |
| Hugo Symbol | Variant Class | Variant Classification | dbSNP RS | HGVSc | HGVSp | HGVSp Short | SWISSPROT | BIOTYPE | SIFT | PolyPhen | Tumor Sample Barcode | Tissue | Histology | Sex | Age | Stage | Therapy Types | Drugs | Outcome |
| PRMT7 | SNV | Missense_Mutation | c.1730C>G | p.Pro577Arg | p.P577R | Q9NVM4 | protein_coding | deleterious(0) | possibly_damaging(0.675) | TCGA-AN-A0XR-01 | Breast | breast invasive carcinoma | Female | <65 | III/IV | Unknown | Unknown | SD | |
| PRMT7 | SNV | Missense_Mutation | novel | c.283G>T | p.Val95Phe | p.V95F | Q9NVM4 | protein_coding | deleterious(0.01) | possibly_damaging(0.786) | TCGA-E9-A1RE-01 | Breast | breast invasive carcinoma | Female | >=65 | III/IV | Hormone Therapy | tamoxiphen | SD |
| PRMT7 | SNV | Missense_Mutation | c.1359C>G | p.Asn453Lys | p.N453K | Q9NVM4 | protein_coding | tolerated(1) | benign(0) | TCGA-EW-A1PB-01 | Breast | breast invasive carcinoma | Female | >=65 | III/IV | Unknown | Unknown | SD | |
| PRMT7 | SNV | Missense_Mutation | c.1145T>C | p.Ile382Thr | p.I382T | Q9NVM4 | protein_coding | deleterious(0) | benign(0.25) | TCGA-4N-A93T-01 | Colorectum | colon adenocarcinoma | Male | >=65 | III/IV | Chemotherapy | xeloda | SD | |
| PRMT7 | SNV | Missense_Mutation | c.134N>G | p.Asn45Ser | p.N45S | Q9NVM4 | protein_coding | deleterious(0) | probably_damaging(1) | TCGA-AA-A010-01 | Colorectum | colon adenocarcinoma | Female | <65 | I/II | Chemotherapy | folinic | CR | |
| PRMT7 | SNV | Missense_Mutation | rs200159195 | c.1372N>T | p.Arg458Trp | p.R458W | Q9NVM4 | protein_coding | deleterious(0.01) | possibly_damaging(0.586) | TCGA-AD-6889-01 | Colorectum | colon adenocarcinoma | Male | >=65 | I/II | Chemotherapy | xeloda | PD |
| PRMT7 | SNV | Missense_Mutation | rs369694606 | c.1246G>A | p.Val416Met | p.V416M | Q9NVM4 | protein_coding | tolerated(0.31) | benign(0.014) | TCGA-AZ-6601-01 | Colorectum | colon adenocarcinoma | Male | >=65 | I/II | Unknown | Unknown | PD |
| PRMT7 | SNV | Missense_Mutation | c.507A>C | p.Glu169Asp | p.E169D | Q9NVM4 | protein_coding | tolerated(0.18) | benign(0.003) | TCGA-CA-6718-01 | Colorectum | colon adenocarcinoma | Male | <65 | I/II | Unknown | Unknown | PD | |
| PRMT7 | SNV | Missense_Mutation | c.1058C>A | p.Pro353His | p.P353H | Q9NVM4 | protein_coding | tolerated(0.11) | benign(0.132) | TCGA-CK-4951-01 | Colorectum | colon adenocarcinoma | Female | >=65 | I/II | Unknown | Unknown | PD | |
| PRMT7 | SNV | Missense_Mutation | c.1850N>G | p.Tyr617Cys | p.Y617C | Q9NVM4 | protein_coding | deleterious(0) | possibly_damaging(0.738) | TCGA-F4-6856-01 | Colorectum | colon adenocarcinoma | Male | <65 | I/II | Ancillary | leucovorin | CR |
| Page: 1 2 3 4 5 |
Top |
Related drugs of malignant transformation related genes |
| Identification of chemicals and drugs interact with genes involved in malignant transfromation |
| (DGIdb 4.0) |
| Entrez ID | Symbol | Category | Interaction Types | Drug Claim Name | Drug Name | PMIDs |
| 54496 | PRMT7 | ENZYME, METHYL TRANSFERASE | inhibitor | 252166606 |
| Page: 1 |

Copyright 2023-Present -The University of Texas Health Science Center at Houston |