
|
|||||
|
 | |
| |
| |
| |
| |
| |
|
Gene: PRMT6 |
Gene summary for PRMT6 |
| Gene information | Species | Human | Gene symbol | PRMT6 | Gene ID | 55170 |
| Gene name | protein arginine methyltransferase 6 | |
| Gene Alias | HRMT1L6 | |
| Cytomap | 1p13.3 | |
| Gene Type | protein-coding | GO ID | GO:0000122 | UniProtAcc | Q96LA8 |
Top |
Malignant transformation analysis |
| Identification of the aberrant gene expression in precancerous and cancerous lesions by comparing the gene expression of stem-like cells in diseased tissues with normal stem cells |
| Entrez ID | Symbol | Replicates | Species | Organ | Tissue | Adj P-value | Log2FC | Malignancy |
| 55170 | PRMT6 | HCC1_Meng | Human | Liver | HCC | 7.00e-50 | 1.07e-01 | 0.0246 |
| 55170 | PRMT6 | HCC2_Meng | Human | Liver | HCC | 5.54e-07 | 3.36e-02 | 0.0107 |
| 55170 | PRMT6 | S014 | Human | Liver | HCC | 5.66e-10 | 3.92e-01 | 0.2254 |
| 55170 | PRMT6 | S015 | Human | Liver | HCC | 2.70e-12 | 5.50e-01 | 0.2375 |
| 55170 | PRMT6 | S016 | Human | Liver | HCC | 6.22e-18 | 5.67e-01 | 0.2243 |
| 55170 | PRMT6 | S028 | Human | Liver | HCC | 2.19e-03 | 2.53e-01 | 0.2503 |
| Page: 1 |
| Tissue | Expression Dynamics | Abbreviation |
| Liver | 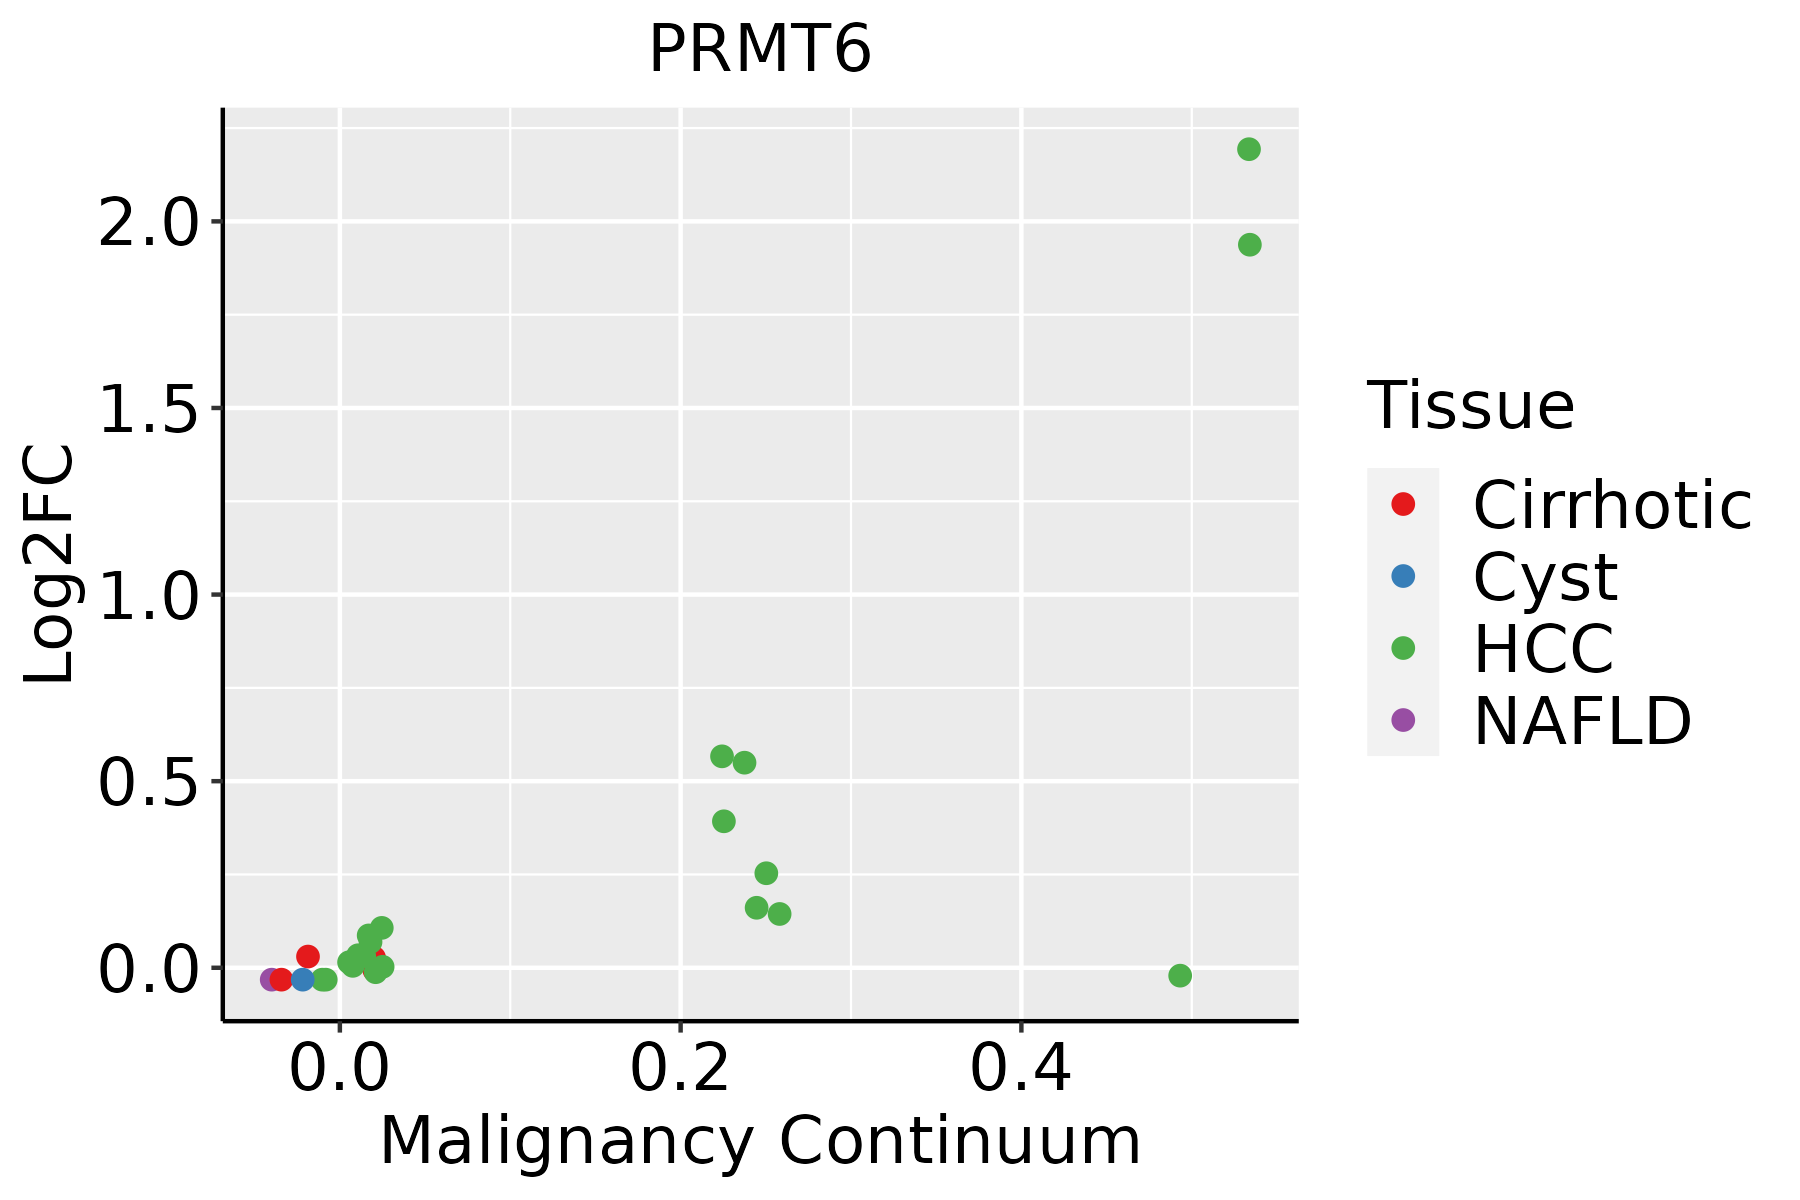 | HCC: Hepatocellular carcinoma |
| NAFLD: Non-alcoholic fatty liver disease |
| ∗log2FC in expression of this searched gene in stem-like cells from each diseased tissue sample relative to stem-like cells in normal samples in each tissue plotted against the malignancy continuum. Samples are colored based on if they are from different disease stage. |
Top |
Malignant transformation related pathway analysis |
| Find out the enriched GO biological processes and KEGG pathways involved in transition from healthy to precancer to cancer |
| Tissue | Disease Stage | Enriched GO biological Processes |
| Colorectum | AD |  |
| Colorectum | SER |  |
| Colorectum | MSS |  |
| Colorectum | MSI-H |  |
| Colorectum | FAP |  |
| ∗Top 15 enriched GO BP terms are showed in the bar plot of each disease state in each tissue. Each row represents a significant GO biological process which is colored according to the -log10(p.adjust). |
| Page: 1 2 3 4 5 6 7 8 9 |
| GO ID | Tissue | Disease Stage | Description | Gene Ratio | Bg Ratio | pvalue | p.adjust | Count |
| GO:001657021 | Liver | HCC | histone modification | 283/7958 | 463/18723 | 2.68e-16 | 2.33e-14 | 283 |
| GO:00182052 | Liver | HCC | peptidyl-lysine modification | 230/7958 | 376/18723 | 1.51e-13 | 8.32e-12 | 230 |
| GO:007233122 | Liver | HCC | signal transduction by p53 class mediator | 108/7958 | 163/18723 | 7.14e-10 | 2.23e-08 | 108 |
| GO:001082112 | Liver | HCC | regulation of mitochondrion organization | 96/7958 | 144/18723 | 3.82e-09 | 1.02e-07 | 96 |
| GO:003105621 | Liver | HCC | regulation of histone modification | 99/7958 | 152/18723 | 1.40e-08 | 3.40e-07 | 99 |
| GO:00434141 | Liver | HCC | macromolecule methylation | 183/7958 | 316/18723 | 2.00e-08 | 4.72e-07 | 183 |
| GO:0032259 | Liver | HCC | methylation | 206/7958 | 364/18723 | 3.35e-08 | 7.53e-07 | 206 |
| GO:00064792 | Liver | HCC | protein methylation | 111/7958 | 181/18723 | 2.36e-07 | 4.18e-06 | 111 |
| GO:00082132 | Liver | HCC | protein alkylation | 111/7958 | 181/18723 | 2.36e-07 | 4.18e-06 | 111 |
| GO:190179622 | Liver | HCC | regulation of signal transduction by p53 class mediator | 64/7958 | 93/18723 | 2.53e-07 | 4.45e-06 | 64 |
| GO:00165712 | Liver | HCC | histone methylation | 88/7958 | 141/18723 | 1.41e-06 | 2.02e-05 | 88 |
| GO:000756822 | Liver | HCC | aging | 185/7958 | 339/18723 | 4.28e-06 | 5.50e-05 | 185 |
| GO:00310601 | Liver | HCC | regulation of histone methylation | 46/7958 | 69/18723 | 4.30e-05 | 4.20e-04 | 46 |
| GO:003009922 | Liver | HCC | myeloid cell differentiation | 200/7958 | 381/18723 | 4.64e-05 | 4.49e-04 | 200 |
| GO:00349681 | Liver | HCC | histone lysine methylation | 70/7958 | 115/18723 | 5.32e-05 | 5.04e-04 | 70 |
| GO:0098732 | Liver | HCC | macromolecule deacylation | 67/7958 | 116/18723 | 6.46e-04 | 3.99e-03 | 67 |
| GO:00180221 | Liver | HCC | peptidyl-lysine methylation | 74/7958 | 131/18723 | 8.46e-04 | 5.06e-03 | 74 |
| GO:00356011 | Liver | HCC | protein deacylation | 64/7958 | 112/18723 | 1.23e-03 | 6.83e-03 | 64 |
| GO:00075691 | Liver | HCC | cell aging | 73/7958 | 132/18723 | 2.00e-03 | 1.01e-02 | 73 |
| GO:0051568 | Liver | HCC | histone H3-K4 methylation | 36/7958 | 59/18723 | 3.15e-03 | 1.46e-02 | 36 |
| Page: 1 2 |
| Pathway ID | Tissue | Disease Stage | Description | Gene Ratio | Bg Ratio | pvalue | p.adjust | qvalue | Count |
| Page: 1 |
Top |
Cell-cell communication analysis |
| Identification of potential cell-cell interactions between two cell types and their ligand-receptor pairs for different disease states |
| Ligand | Receptor | LRpair | Pathway | Tissue | Disease Stage |
| Page: 1 |
Top |
Single-cell gene regulatory network inference analysis |
| Find out the significant the regulons (TFs) and the target genes of each regulon across cell types for different disease states |
| TF | Cell Type | Tissue | Disease Stage | Target Gene | RSS | Regulon Activity |
| ∗The dot plots of a searched regulon are shown for all cell subpopulations in each disease state of each tissue based on the regulon specific score inferred using pySCENIC and by calculating the average expression. |
| Page: 1 |
Top |
Somatic mutation of malignant transformation related genes |
| Annotation of somatic variants for genes involved in malignant transformation |
| Hugo Symbol | Variant Class | Variant Classification | dbSNP RS | HGVSc | HGVSp | HGVSp Short | SWISSPROT | BIOTYPE | SIFT | PolyPhen | Tumor Sample Barcode | Tissue | Histology | Sex | Age | Stage | Therapy Types | Drugs | Outcome |
| PRMT6 | SNV | Missense_Mutation | rs779233712 | c.430G>C | p.Glu144Gln | p.E144Q | Q96LA8 | protein_coding | tolerated(0.11) | possibly_damaging(0.475) | TCGA-A8-A095-01 | Breast | breast invasive carcinoma | Female | <65 | I/II | Chemotherapy | 5-fluorouracil | CR |
| PRMT6 | SNV | Missense_Mutation | c.940N>T | p.Pro314Ser | p.P314S | Q96LA8 | protein_coding | tolerated(0.18) | benign(0.254) | TCGA-AR-A0U2-01 | Breast | breast invasive carcinoma | Female | <65 | III/IV | Hormone Therapy | tamoxiphen | PD | |
| PRMT6 | deletion | Frame_Shift_Del | novel | c.977delA | p.Asn326ThrfsTer64 | p.N326Tfs*64 | Q96LA8 | protein_coding | TCGA-EW-A2FV-01 | Breast | breast invasive carcinoma | Female | <65 | III/IV | Chemotherapy | docetaxel | SD | ||
| PRMT6 | SNV | Missense_Mutation | c.245N>A | p.Arg82Gln | p.R82Q | Q96LA8 | protein_coding | tolerated(0.34) | benign(0.121) | TCGA-JX-A3Q0-01 | Cervix | cervical & endocervical cancer | Female | <65 | III/IV | Unknown | Unknown | SD | |
| PRMT6 | SNV | Missense_Mutation | novel | c.343N>A | p.Ala115Thr | p.A115T | Q96LA8 | protein_coding | tolerated(0.27) | benign(0.017) | TCGA-AA-3950-01 | Colorectum | colon adenocarcinoma | Female | >=65 | I/II | Unknown | Unknown | SD |
| PRMT6 | SNV | Missense_Mutation | c.1080A>C | p.Lys360Asn | p.K360N | Q96LA8 | protein_coding | tolerated(0.24) | benign(0.014) | TCGA-CM-4743-01 | Colorectum | colon adenocarcinoma | Male | >=65 | I/II | Chemotherapy | capecitabine | SD | |
| PRMT6 | SNV | Missense_Mutation | rs751008530 | c.143A>G | p.Tyr48Cys | p.Y48C | Q96LA8 | protein_coding | deleterious(0) | possibly_damaging(0.865) | TCGA-CM-5861-01 | Colorectum | colon adenocarcinoma | Female | <65 | I/II | Unknown | Unknown | PD |
| PRMT6 | SNV | Missense_Mutation | c.160N>A | p.Val54Ile | p.V54I | Q96LA8 | protein_coding | tolerated(0.61) | benign(0) | TCGA-G4-6320-01 | Colorectum | colon adenocarcinoma | Male | >=65 | III/IV | Chemotherapy | oxaliplatin | SD | |
| PRMT6 | SNV | Missense_Mutation | c.736G>A | p.Val246Met | p.V246M | Q96LA8 | protein_coding | deleterious(0) | benign(0.069) | TCGA-G4-6322-01 | Colorectum | colon adenocarcinoma | Male | >=65 | III/IV | Chemotherapy | oxaliplatin | PD | |
| PRMT6 | SNV | Missense_Mutation | novel | c.247G>T | p.Gly83Cys | p.G83C | Q96LA8 | protein_coding | deleterious(0) | probably_damaging(0.998) | TCGA-EI-6507-01 | Colorectum | rectum adenocarcinoma | Male | <65 | I/II | Unknown | Unknown | SD |
| Page: 1 2 3 4 |
Top |
Related drugs of malignant transformation related genes |
| Identification of chemicals and drugs interact with genes involved in malignant transfromation |
| (DGIdb 4.0) |
| Entrez ID | Symbol | Category | Interaction Types | Drug Claim Name | Drug Name | PMIDs |
| 55170 | PRMT6 | ENZYME, METHYL TRANSFERASE | inhibitor | 310264736 | ||
| 55170 | PRMT6 | ENZYME, METHYL TRANSFERASE | inhibitor | 178103616 | ||
| 55170 | PRMT6 | ENZYME, METHYL TRANSFERASE | inhibitor | 315661318 | ||
| 55170 | PRMT6 | ENZYME, METHYL TRANSFERASE | inhibitor | 336446915 |
| Page: 1 |

Copyright 2023-Present -The University of Texas Health Science Center at Houston |