
|
|||||
|
 | |
| |
| |
| |
| |
| |
|
Gene: PRMT5 |
Gene summary for PRMT5 |
| Gene information | Species | Human | Gene symbol | PRMT5 | Gene ID | 10419 |
| Gene name | protein arginine methyltransferase 5 | |
| Gene Alias | HRMT1L5 | |
| Cytomap | 14q11.2 | |
| Gene Type | protein-coding | GO ID | GO:0000165 | UniProtAcc | O14744 |
Top |
Malignant transformation analysis |
| Identification of the aberrant gene expression in precancerous and cancerous lesions by comparing the gene expression of stem-like cells in diseased tissues with normal stem cells |
| Entrez ID | Symbol | Replicates | Species | Organ | Tissue | Adj P-value | Log2FC | Malignancy |
| 10419 | PRMT5 | LZE2T | Human | Esophagus | ESCC | 3.34e-05 | 5.64e-01 | 0.082 |
| 10419 | PRMT5 | LZE4T | Human | Esophagus | ESCC | 5.71e-13 | 2.47e-01 | 0.0811 |
| 10419 | PRMT5 | LZE7T | Human | Esophagus | ESCC | 7.92e-03 | 1.25e-01 | 0.0667 |
| 10419 | PRMT5 | LZE8T | Human | Esophagus | ESCC | 2.37e-06 | 1.45e-01 | 0.067 |
| 10419 | PRMT5 | LZE24T | Human | Esophagus | ESCC | 1.15e-10 | 3.38e-01 | 0.0596 |
| 10419 | PRMT5 | LZE21T | Human | Esophagus | ESCC | 5.56e-04 | 5.33e-01 | 0.0655 |
| 10419 | PRMT5 | LZE6T | Human | Esophagus | ESCC | 1.73e-02 | 2.08e-01 | 0.0845 |
| 10419 | PRMT5 | P2T-E | Human | Esophagus | ESCC | 7.49e-26 | 4.97e-01 | 0.1177 |
| 10419 | PRMT5 | P4T-E | Human | Esophagus | ESCC | 2.24e-21 | 6.17e-01 | 0.1323 |
| 10419 | PRMT5 | P5T-E | Human | Esophagus | ESCC | 3.96e-32 | 7.55e-01 | 0.1327 |
| 10419 | PRMT5 | P8T-E | Human | Esophagus | ESCC | 3.02e-23 | 4.52e-01 | 0.0889 |
| 10419 | PRMT5 | P9T-E | Human | Esophagus | ESCC | 3.59e-12 | 2.62e-01 | 0.1131 |
| 10419 | PRMT5 | P10T-E | Human | Esophagus | ESCC | 6.85e-38 | 5.31e-01 | 0.116 |
| 10419 | PRMT5 | P11T-E | Human | Esophagus | ESCC | 1.03e-13 | 5.30e-01 | 0.1426 |
| 10419 | PRMT5 | P12T-E | Human | Esophagus | ESCC | 3.65e-47 | 1.09e+00 | 0.1122 |
| 10419 | PRMT5 | P15T-E | Human | Esophagus | ESCC | 1.45e-42 | 9.96e-01 | 0.1149 |
| 10419 | PRMT5 | P16T-E | Human | Esophagus | ESCC | 1.42e-33 | 6.11e-01 | 0.1153 |
| 10419 | PRMT5 | P17T-E | Human | Esophagus | ESCC | 3.61e-09 | 4.33e-01 | 0.1278 |
| 10419 | PRMT5 | P19T-E | Human | Esophagus | ESCC | 4.02e-05 | 7.46e-01 | 0.1662 |
| 10419 | PRMT5 | P20T-E | Human | Esophagus | ESCC | 2.26e-15 | 2.36e-01 | 0.1124 |
| Page: 1 2 3 4 5 |
| Tissue | Expression Dynamics | Abbreviation |
| Esophagus | 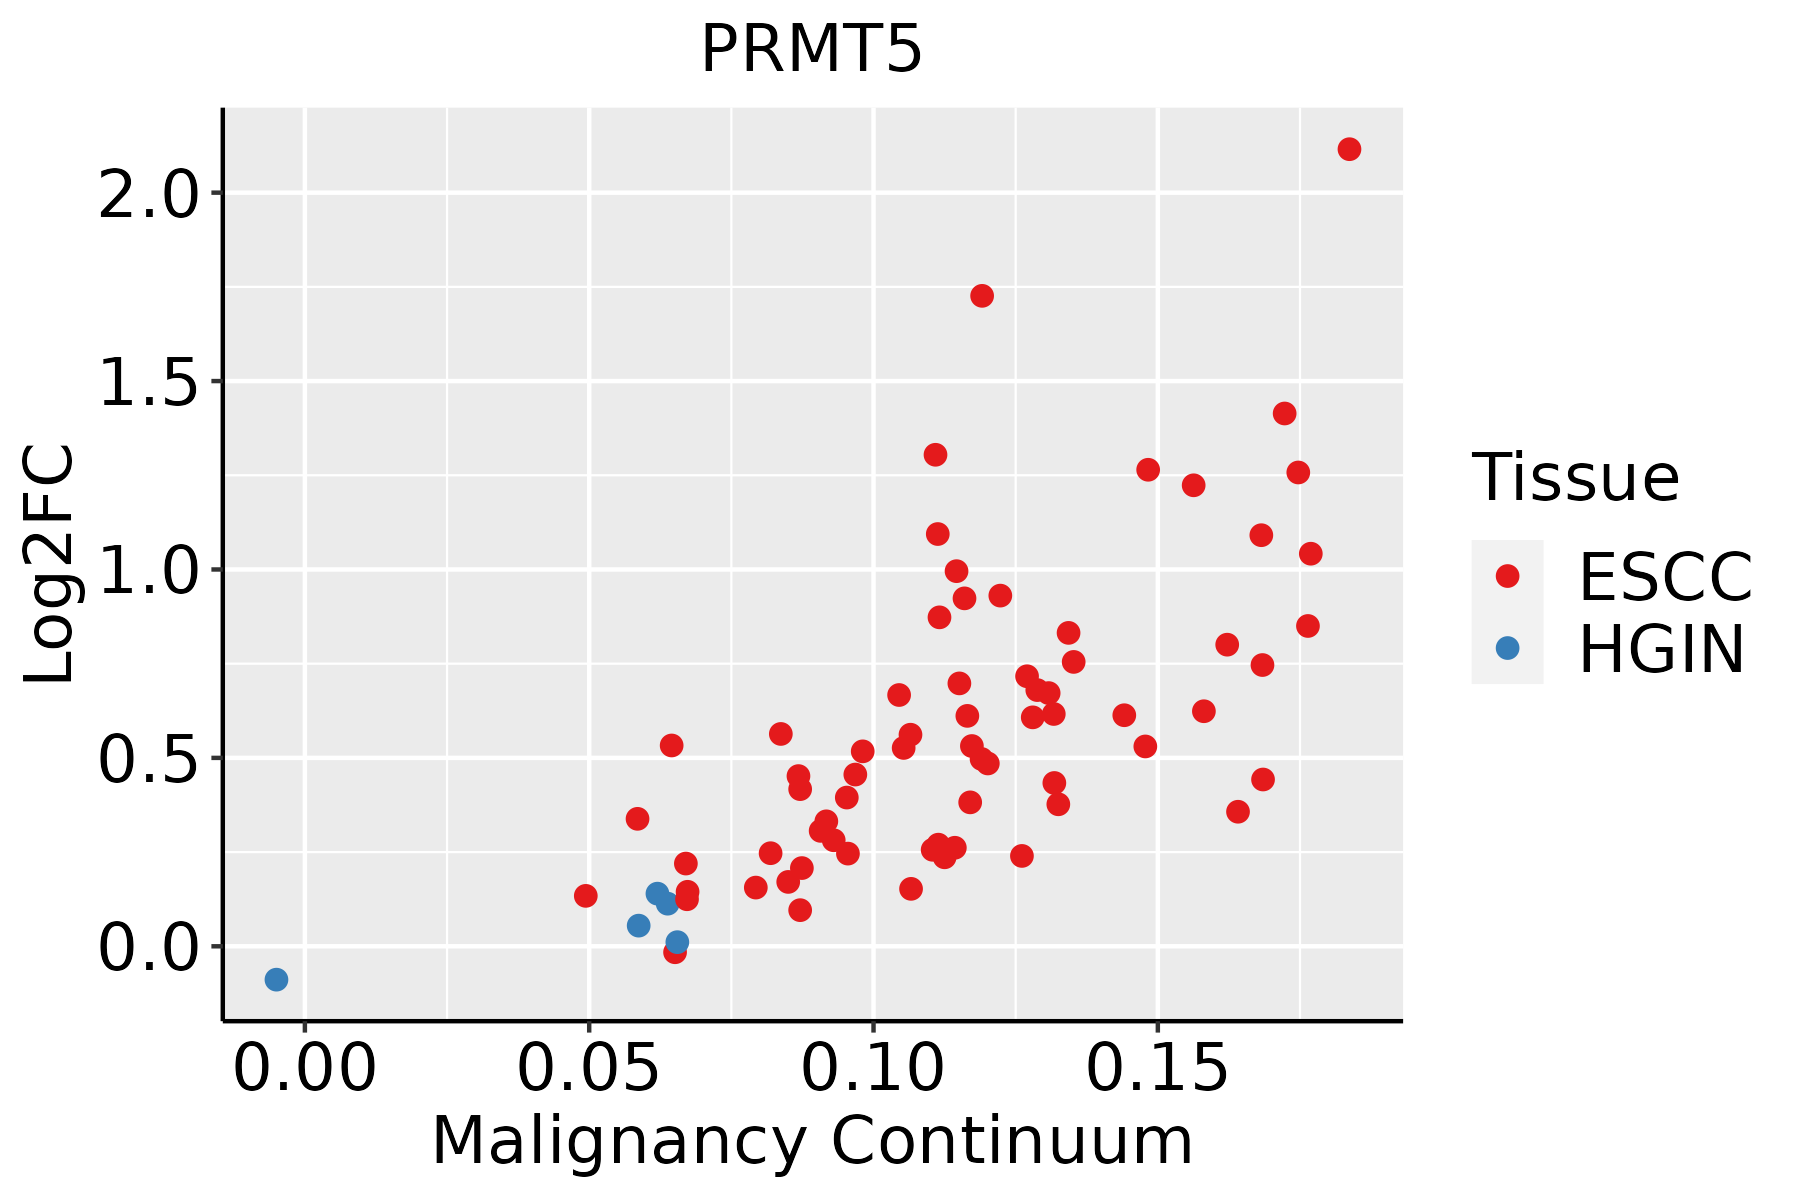 | ESCC: Esophageal squamous cell carcinoma |
| HGIN: High-grade intraepithelial neoplasias | ||
| LGIN: Low-grade intraepithelial neoplasias | ||
| Liver |  | HCC: Hepatocellular carcinoma |
| NAFLD: Non-alcoholic fatty liver disease | ||
| Oral Cavity | 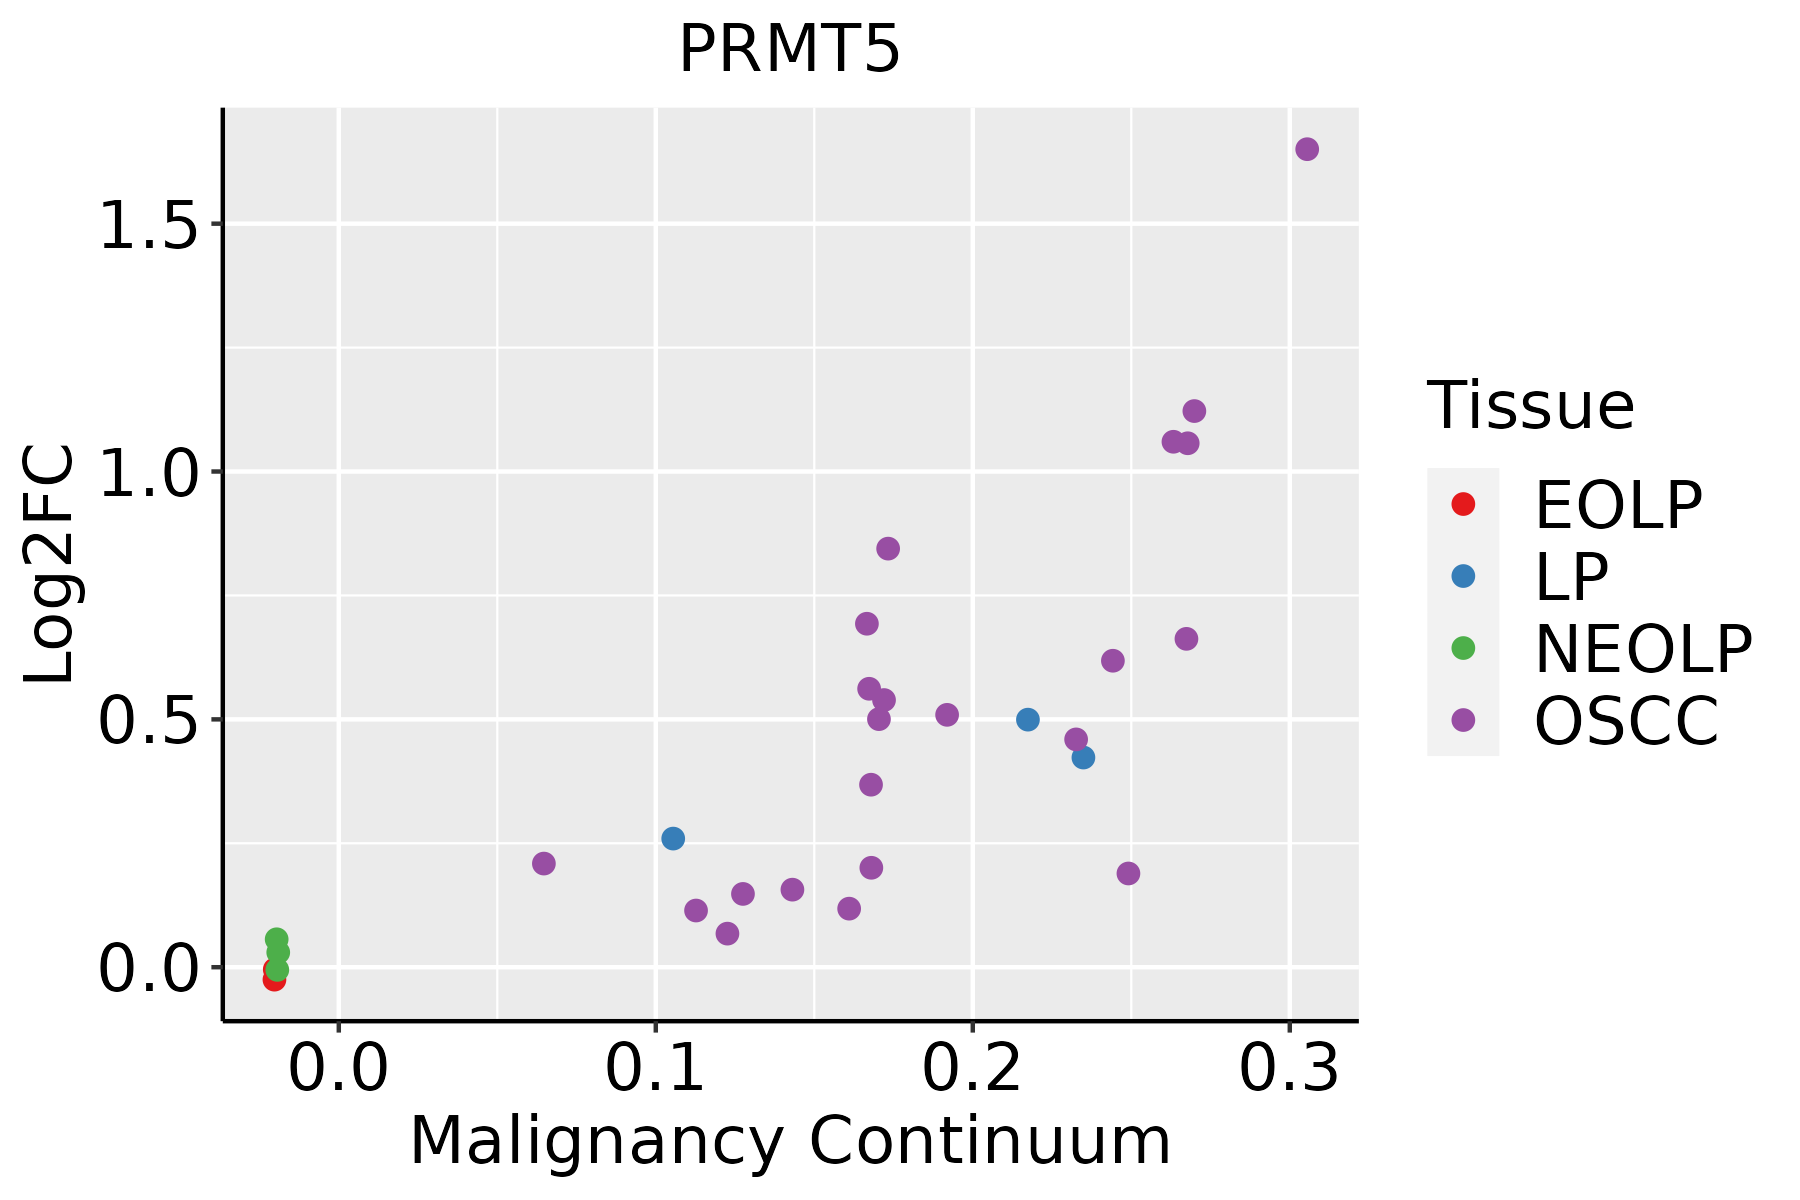 | EOLP: Erosive Oral lichen planus |
| LP: leukoplakia | ||
| NEOLP: Non-erosive oral lichen planus | ||
| OSCC: Oral squamous cell carcinoma | ||
| Skin |  | AK: Actinic keratosis |
| cSCC: Cutaneous squamous cell carcinoma | ||
| SCCIS:squamous cell carcinoma in situ |
| ∗log2FC in expression of this searched gene in stem-like cells from each diseased tissue sample relative to stem-like cells in normal samples in each tissue plotted against the malignancy continuum. Samples are colored based on if they are from different disease stage. |
Top |
Malignant transformation related pathway analysis |
| Find out the enriched GO biological processes and KEGG pathways involved in transition from healthy to precancer to cancer |
| Tissue | Disease Stage | Enriched GO biological Processes |
| Colorectum | AD |  |
| Colorectum | SER |  |
| Colorectum | MSS |  |
| Colorectum | MSI-H |  |
| Colorectum | FAP |  |
| ∗Top 15 enriched GO BP terms are showed in the bar plot of each disease state in each tissue. Each row represents a significant GO biological process which is colored according to the -log10(p.adjust). |
| Page: 1 2 3 4 5 6 7 8 9 |
| GO ID | Tissue | Disease Stage | Description | Gene Ratio | Bg Ratio | pvalue | p.adjust | Count |
| GO:0022613111 | Esophagus | ESCC | ribonucleoprotein complex biogenesis | 365/8552 | 463/18723 | 1.74e-49 | 1.11e-45 | 365 |
| GO:0008380111 | Esophagus | ESCC | RNA splicing | 336/8552 | 434/18723 | 1.74e-42 | 3.67e-39 | 336 |
| GO:0000375111 | Esophagus | ESCC | RNA splicing, via transesterification reactions | 248/8552 | 324/18723 | 3.05e-30 | 1.49e-27 | 248 |
| GO:0000377111 | Esophagus | ESCC | RNA splicing, via transesterification reactions with bulged adenosine as nucleophile | 244/8552 | 320/18723 | 2.52e-29 | 1.07e-26 | 244 |
| GO:0000398111 | Esophagus | ESCC | mRNA splicing, via spliceosome | 244/8552 | 320/18723 | 2.52e-29 | 1.07e-26 | 244 |
| GO:001657015 | Esophagus | ESCC | histone modification | 323/8552 | 463/18723 | 2.61e-26 | 7.88e-24 | 323 |
| GO:014001414 | Esophagus | ESCC | mitotic nuclear division | 218/8552 | 287/18723 | 6.17e-26 | 1.78e-23 | 218 |
| GO:0071826111 | Esophagus | ESCC | ribonucleoprotein complex subunit organization | 166/8552 | 227/18723 | 2.94e-17 | 2.42e-15 | 166 |
| GO:000734615 | Esophagus | ESCC | regulation of mitotic cell cycle | 293/8552 | 457/18723 | 8.00e-16 | 5.64e-14 | 293 |
| GO:0022618111 | Esophagus | ESCC | ribonucleoprotein complex assembly | 159/8552 | 220/18723 | 8.19e-16 | 5.71e-14 | 159 |
| GO:0072331111 | Esophagus | ESCC | signal transduction by p53 class mediator | 121/8552 | 163/18723 | 9.61e-14 | 4.69e-12 | 121 |
| GO:005105215 | Esophagus | ESCC | regulation of DNA metabolic process | 232/8552 | 359/18723 | 2.40e-13 | 1.13e-11 | 232 |
| GO:00482853 | Esophagus | ESCC | organelle fission | 301/8552 | 488/18723 | 4.64e-13 | 2.12e-11 | 301 |
| GO:0048732111 | Esophagus | ESCC | gland development | 269/8552 | 436/18723 | 7.81e-12 | 2.95e-10 | 269 |
| GO:00002802 | Esophagus | ESCC | nuclear division | 270/8552 | 439/18723 | 1.17e-11 | 4.24e-10 | 270 |
| GO:00434143 | Esophagus | ESCC | macromolecule methylation | 199/8552 | 316/18723 | 3.44e-10 | 9.57e-09 | 199 |
| GO:00322592 | Esophagus | ESCC | methylation | 222/8552 | 364/18723 | 2.26e-09 | 5.09e-08 | 222 |
| GO:1901796111 | Esophagus | ESCC | regulation of signal transduction by p53 class mediator | 70/8552 | 93/18723 | 5.69e-09 | 1.18e-07 | 70 |
| GO:00070883 | Esophagus | ESCC | regulation of mitotic nuclear division | 78/8552 | 110/18723 | 6.96e-08 | 1.21e-06 | 78 |
| GO:0061008110 | Esophagus | ESCC | hepaticobiliary system development | 98/8552 | 150/18723 | 8.91e-07 | 1.15e-05 | 98 |
| Page: 1 2 3 4 5 6 7 8 9 10 11 12 |
| Pathway ID | Tissue | Disease Stage | Description | Gene Ratio | Bg Ratio | pvalue | p.adjust | qvalue | Count |
| Page: 1 |
Top |
Cell-cell communication analysis |
| Identification of potential cell-cell interactions between two cell types and their ligand-receptor pairs for different disease states |
| Ligand | Receptor | LRpair | Pathway | Tissue | Disease Stage |
| Page: 1 |
Top |
Single-cell gene regulatory network inference analysis |
| Find out the significant the regulons (TFs) and the target genes of each regulon across cell types for different disease states |
| TF | Cell Type | Tissue | Disease Stage | Target Gene | RSS | Regulon Activity |
| ∗The dot plots of a searched regulon are shown for all cell subpopulations in each disease state of each tissue based on the regulon specific score inferred using pySCENIC and by calculating the average expression. |
| Page: 1 |
Top |
Somatic mutation of malignant transformation related genes |
| Annotation of somatic variants for genes involved in malignant transformation |
| Hugo Symbol | Variant Class | Variant Classification | dbSNP RS | HGVSc | HGVSp | HGVSp Short | SWISSPROT | BIOTYPE | SIFT | PolyPhen | Tumor Sample Barcode | Tissue | Histology | Sex | Age | Stage | Therapy Types | Drugs | Outcome |
| PRMT5 | SNV | Missense_Mutation | novel | c.17N>G | p.Val6Gly | p.V6G | O14744 | protein_coding | deleterious_low_confidence(0.02) | benign(0.018) | TCGA-A2-A0EQ-01 | Breast | breast invasive carcinoma | Female | <65 | I/II | Chemotherapy | adriamycin | SD |
| PRMT5 | SNV | Missense_Mutation | c.31N>T | p.Gly11Trp | p.G11W | O14744 | protein_coding | deleterious(0.02) | probably_damaging(0.914) | TCGA-A7-A13E-01 | Breast | breast invasive carcinoma | Female | <65 | I/II | Targeted Molecular therapy | bevacizumab | PD | |
| PRMT5 | SNV | Missense_Mutation | novel | c.646N>T | p.His216Tyr | p.H216Y | O14744 | protein_coding | deleterious(0.03) | benign(0.37) | TCGA-A8-A09X-01 | Breast | breast invasive carcinoma | Female | <65 | III/IV | Unknown | Unknown | SD |
| PRMT5 | SNV | Missense_Mutation | c.1582N>T | p.Pro528Ser | p.P528S | O14744 | protein_coding | tolerated(0.86) | benign(0.005) | TCGA-BH-A0HX-01 | Breast | breast invasive carcinoma | Female | <65 | I/II | Chemotherapy | adrimycin | SD | |
| PRMT5 | SNV | Missense_Mutation | c.944T>C | p.Leu315Pro | p.L315P | O14744 | protein_coding | deleterious(0) | probably_damaging(1) | TCGA-BH-A18G-01 | Breast | breast invasive carcinoma | Female | >=65 | I/II | Unknown | Unknown | SD | |
| PRMT5 | SNV | Missense_Mutation | c.115N>C | p.Asp39His | p.D39H | O14744 | protein_coding | deleterious(0.02) | benign(0.188) | TCGA-E2-A14P-01 | Breast | breast invasive carcinoma | Female | >=65 | III/IV | Targeted Molecular therapy | trastuzumab | SD | |
| PRMT5 | insertion | Nonsense_Mutation | novel | c.1410_1411insAGTGCTCAATGAATGGAGATCT | p.Phe471SerfsTer4 | p.F471Sfs*4 | O14744 | protein_coding | TCGA-A2-A0EO-01 | Breast | breast invasive carcinoma | Female | <65 | I/II | Hormone Therapy | tamoxiphen | SD | ||
| PRMT5 | insertion | Nonsense_Mutation | novel | c.1408_1409insAGATTTATGGGGGGC | p.Ser470delinsTer | p.S470delins* | O14744 | protein_coding | TCGA-A2-A0EO-01 | Breast | breast invasive carcinoma | Female | <65 | I/II | Hormone Therapy | tamoxiphen | SD | ||
| PRMT5 | insertion | Frame_Shift_Ins | novel | c.1223_1224insTATAT | p.Glu408AspfsTer8 | p.E408Dfs*8 | O14744 | protein_coding | TCGA-A8-A095-01 | Breast | breast invasive carcinoma | Female | <65 | I/II | Chemotherapy | 5-fluorouracil | CR | ||
| PRMT5 | insertion | Frame_Shift_Ins | novel | c.1221_1222insAATATTGTGTTGTATATGGCTTTGCTTAAACG | p.Glu408AsnfsTer17 | p.E408Nfs*17 | O14744 | protein_coding | TCGA-A8-A095-01 | Breast | breast invasive carcinoma | Female | <65 | I/II | Chemotherapy | 5-fluorouracil | CR |
| Page: 1 2 3 4 5 6 |
Top |
Related drugs of malignant transformation related genes |
| Identification of chemicals and drugs interact with genes involved in malignant transfromation |
| (DGIdb 4.0) |
| Entrez ID | Symbol | Category | Interaction Types | Drug Claim Name | Drug Name | PMIDs |
| 10419 | PRMT5 | ENZYME, METHYL TRANSFERASE | inhibitor | 336446913 | ||
| 10419 | PRMT5 | ENZYME, METHYL TRANSFERASE | inhibitor | 252166500 | ||
| 10419 | PRMT5 | ENZYME, METHYL TRANSFERASE | inhibitor | 310264735 | ||
| 10419 | PRMT5 | ENZYME, METHYL TRANSFERASE | inhibitor | 252166499 | ||
| 10419 | PRMT5 | ENZYME, METHYL TRANSFERASE | inhibitor | 252166606 | ||
| 10419 | PRMT5 | ENZYME, METHYL TRANSFERASE | GSK3326595 |
| Page: 1 |

Copyright 2023-Present -The University of Texas Health Science Center at Houston |