
|
|||||
|
 | |
| |
| |
| |
| |
| |
|
Gene: PRMT3 |
Gene summary for PRMT3 |
| Gene information | Species | Human | Gene symbol | PRMT3 | Gene ID | 10196 |
| Gene name | protein arginine methyltransferase 3 | |
| Gene Alias | HRMT1L3 | |
| Cytomap | 11p15.1 | |
| Gene Type | protein-coding | GO ID | GO:0001523 | UniProtAcc | A0A0A0MSN7 |
Top |
Malignant transformation analysis |
| Identification of the aberrant gene expression in precancerous and cancerous lesions by comparing the gene expression of stem-like cells in diseased tissues with normal stem cells |
| Entrez ID | Symbol | Replicates | Species | Organ | Tissue | Adj P-value | Log2FC | Malignancy |
| 10196 | PRMT3 | HTA11_3410_2000001011 | Human | Colorectum | AD | 1.65e-04 | -3.29e-01 | 0.0155 |
| 10196 | PRMT3 | HTA11_3361_2000001011 | Human | Colorectum | AD | 7.19e-06 | -5.00e-01 | -0.1207 |
| 10196 | PRMT3 | HTA11_696_2000001011 | Human | Colorectum | AD | 7.35e-06 | -3.51e-01 | -0.1464 |
| 10196 | PRMT3 | HTA11_866_2000001011 | Human | Colorectum | AD | 2.53e-05 | -3.17e-01 | -0.1001 |
| 10196 | PRMT3 | HTA11_5212_2000001011 | Human | Colorectum | AD | 1.06e-03 | -5.37e-01 | -0.2061 |
| 10196 | PRMT3 | HTA11_7696_3000711011 | Human | Colorectum | AD | 5.92e-03 | -2.59e-01 | 0.0674 |
| 10196 | PRMT3 | HTA11_99999974143_84620 | Human | Colorectum | MSS | 1.12e-03 | -2.78e-01 | 0.3005 |
| 10196 | PRMT3 | A002-C-010 | Human | Colorectum | FAP | 1.54e-02 | -4.19e-02 | 0.242 |
| 10196 | PRMT3 | A001-C-207 | Human | Colorectum | FAP | 3.73e-03 | -3.06e-01 | 0.1278 |
| 10196 | PRMT3 | A015-C-203 | Human | Colorectum | FAP | 6.02e-20 | -3.84e-01 | -0.1294 |
| 10196 | PRMT3 | A015-C-204 | Human | Colorectum | FAP | 6.79e-04 | -2.79e-01 | -0.0228 |
| 10196 | PRMT3 | A014-C-040 | Human | Colorectum | FAP | 8.05e-04 | -4.87e-01 | -0.1184 |
| 10196 | PRMT3 | A002-C-201 | Human | Colorectum | FAP | 2.87e-10 | -3.68e-01 | 0.0324 |
| 10196 | PRMT3 | A002-C-203 | Human | Colorectum | FAP | 1.53e-03 | -1.51e-01 | 0.2786 |
| 10196 | PRMT3 | A001-C-119 | Human | Colorectum | FAP | 1.19e-06 | -3.76e-01 | -0.1557 |
| 10196 | PRMT3 | A001-C-108 | Human | Colorectum | FAP | 1.68e-11 | -2.99e-01 | -0.0272 |
| 10196 | PRMT3 | A002-C-205 | Human | Colorectum | FAP | 5.97e-14 | -3.55e-01 | -0.1236 |
| 10196 | PRMT3 | A001-C-104 | Human | Colorectum | FAP | 9.55e-06 | -2.45e-01 | 0.0184 |
| 10196 | PRMT3 | A015-C-005 | Human | Colorectum | FAP | 1.63e-04 | -3.15e-01 | -0.0336 |
| 10196 | PRMT3 | A015-C-006 | Human | Colorectum | FAP | 5.62e-09 | -2.95e-01 | -0.0994 |
| Page: 1 2 3 4 5 6 |
| Tissue | Expression Dynamics | Abbreviation |
| Colorectum (GSE201348) |  | FAP: Familial adenomatous polyposis |
| CRC: Colorectal cancer | ||
| Colorectum (HTA11) |  | AD: Adenomas |
| SER: Sessile serrated lesions | ||
| MSI-H: Microsatellite-high colorectal cancer | ||
| MSS: Microsatellite stable colorectal cancer | ||
| Esophagus | 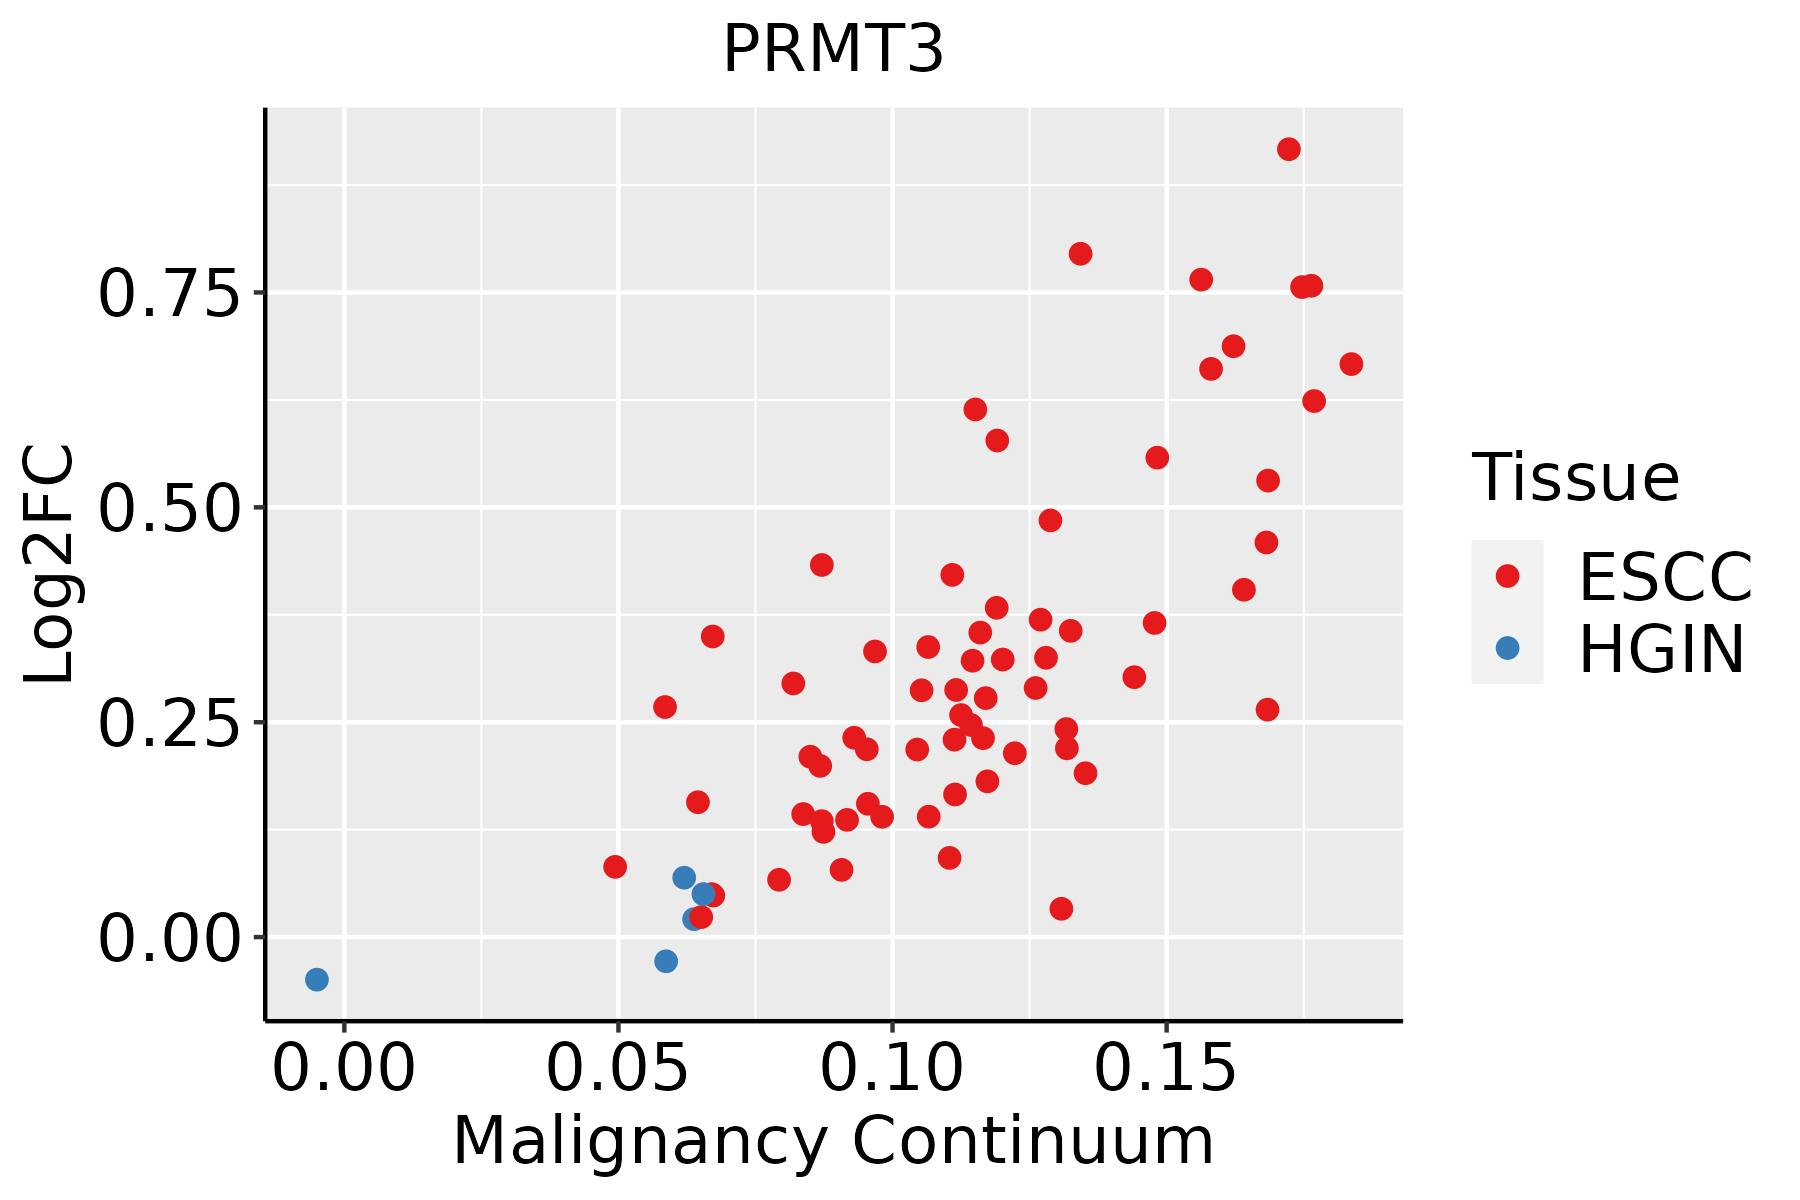 | ESCC: Esophageal squamous cell carcinoma |
| HGIN: High-grade intraepithelial neoplasias | ||
| LGIN: Low-grade intraepithelial neoplasias | ||
| Oral Cavity | 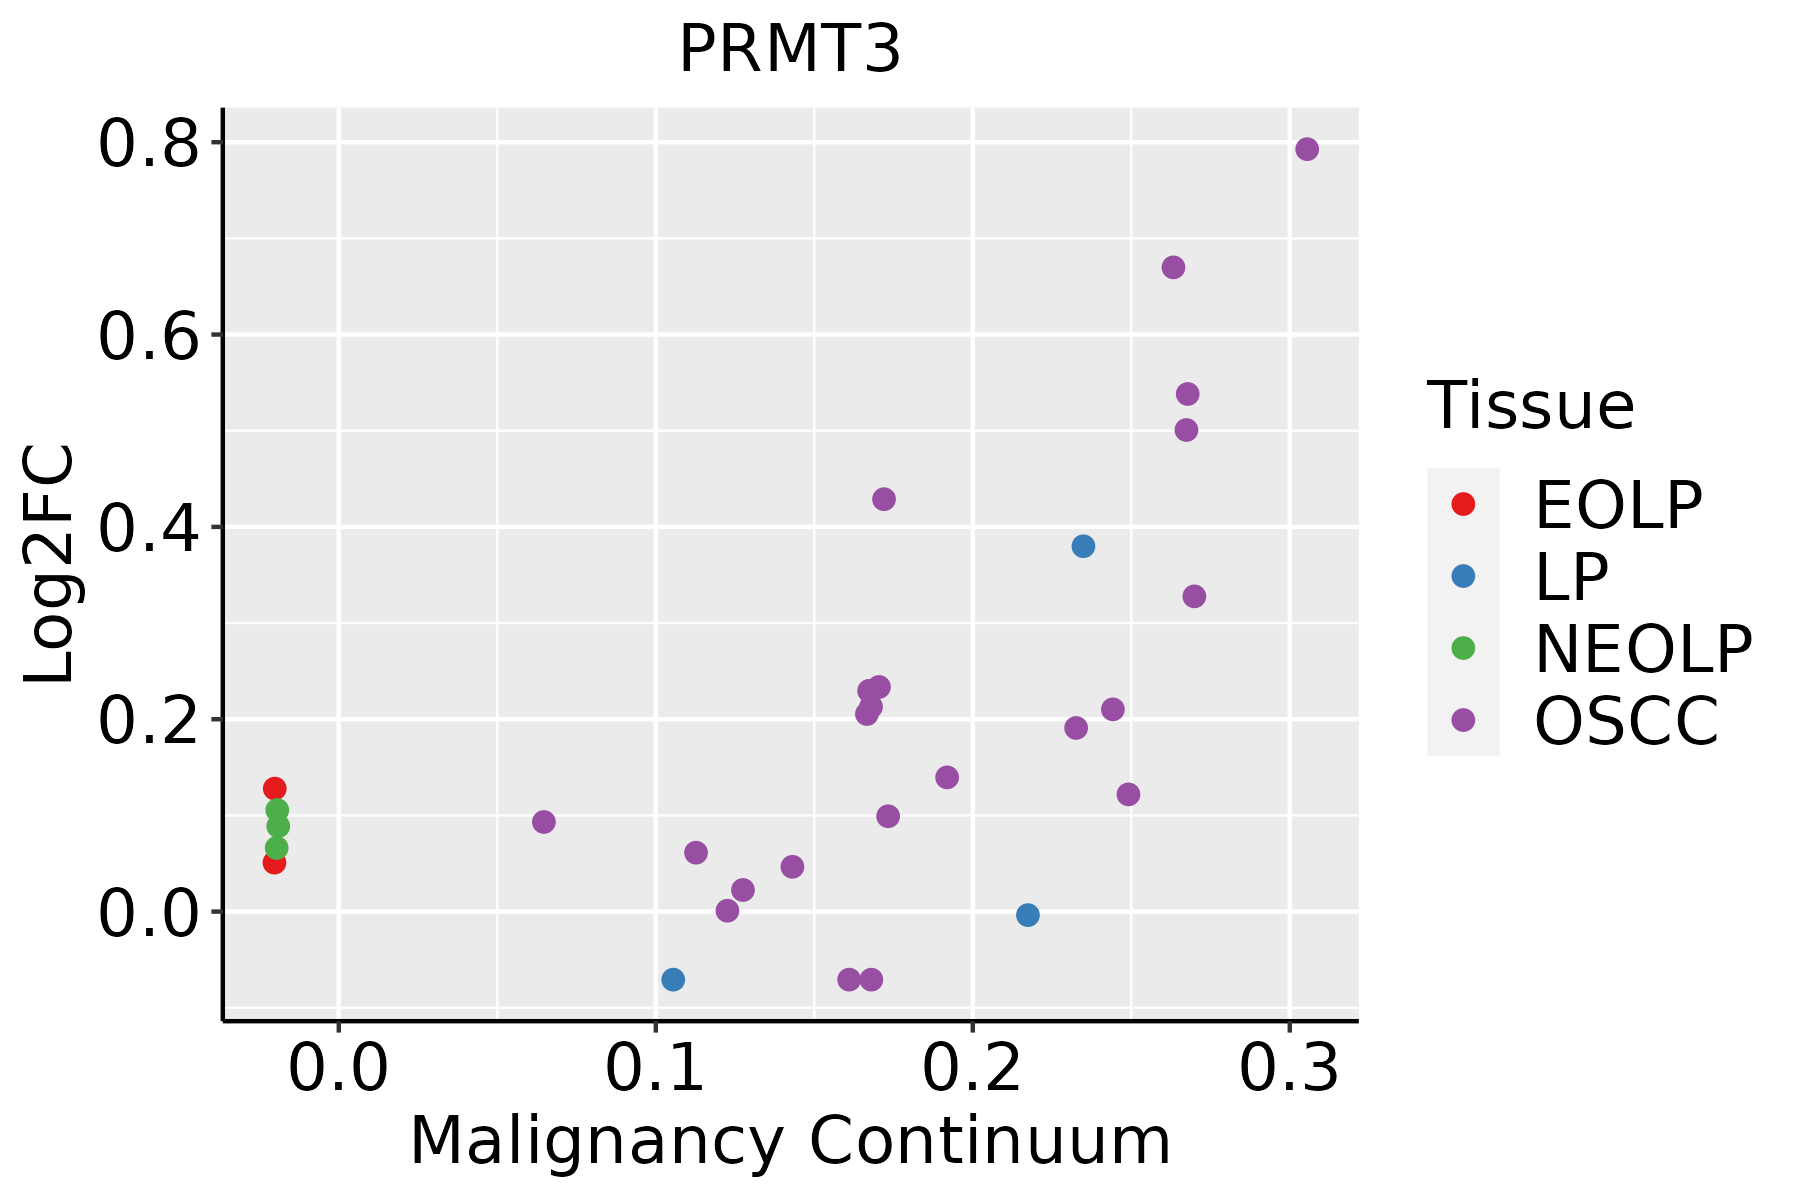 | EOLP: Erosive Oral lichen planus |
| LP: leukoplakia | ||
| NEOLP: Non-erosive oral lichen planus | ||
| OSCC: Oral squamous cell carcinoma | ||
| Skin |  | AK: Actinic keratosis |
| cSCC: Cutaneous squamous cell carcinoma | ||
| SCCIS:squamous cell carcinoma in situ |
| ∗log2FC in expression of this searched gene in stem-like cells from each diseased tissue sample relative to stem-like cells in normal samples in each tissue plotted against the malignancy continuum. Samples are colored based on if they are from different disease stage. |
Top |
Malignant transformation related pathway analysis |
| Find out the enriched GO biological processes and KEGG pathways involved in transition from healthy to precancer to cancer |
| Tissue | Disease Stage | Enriched GO biological Processes |
| Colorectum | AD |  |
| Colorectum | SER |  |
| Colorectum | MSS |  |
| Colorectum | MSI-H |  |
| Colorectum | FAP |  |
| ∗Top 15 enriched GO BP terms are showed in the bar plot of each disease state in each tissue. Each row represents a significant GO biological process which is colored according to the -log10(p.adjust). |
| Page: 1 2 3 4 5 6 7 8 9 |
| GO ID | Tissue | Disease Stage | Description | Gene Ratio | Bg Ratio | pvalue | p.adjust | Count |
| GO:1903320 | Colorectum | AD | regulation of protein modification by small protein conjugation or removal | 86/3918 | 242/18723 | 9.43e-08 | 4.65e-06 | 86 |
| GO:0031396 | Colorectum | AD | regulation of protein ubiquitination | 72/3918 | 210/18723 | 4.50e-06 | 1.21e-04 | 72 |
| GO:0031397 | Colorectum | AD | negative regulation of protein ubiquitination | 34/3918 | 83/18723 | 2.66e-05 | 5.04e-04 | 34 |
| GO:1903321 | Colorectum | AD | negative regulation of protein modification by small protein conjugation or removal | 37/3918 | 95/18723 | 4.49e-05 | 7.83e-04 | 37 |
| GO:0062012 | Colorectum | AD | regulation of small molecule metabolic process | 93/3918 | 334/18723 | 1.46e-03 | 1.24e-02 | 93 |
| GO:19033202 | Colorectum | MSS | regulation of protein modification by small protein conjugation or removal | 82/3467 | 242/18723 | 7.49e-09 | 4.63e-07 | 82 |
| GO:00313962 | Colorectum | MSS | regulation of protein ubiquitination | 70/3467 | 210/18723 | 1.88e-07 | 8.26e-06 | 70 |
| GO:00313972 | Colorectum | MSS | negative regulation of protein ubiquitination | 33/3467 | 83/18723 | 5.08e-06 | 1.40e-04 | 33 |
| GO:19033212 | Colorectum | MSS | negative regulation of protein modification by small protein conjugation or removal | 36/3467 | 95/18723 | 7.10e-06 | 1.82e-04 | 36 |
| GO:00620121 | Colorectum | MSS | regulation of small molecule metabolic process | 83/3467 | 334/18723 | 2.25e-03 | 1.85e-02 | 83 |
| GO:0046394 | Colorectum | MSS | carboxylic acid biosynthetic process | 76/3467 | 314/18723 | 6.71e-03 | 4.38e-02 | 76 |
| GO:0016053 | Colorectum | MSS | organic acid biosynthetic process | 76/3467 | 316/18723 | 7.88e-03 | 4.84e-02 | 76 |
| GO:19033204 | Colorectum | FAP | regulation of protein modification by small protein conjugation or removal | 61/2622 | 242/18723 | 2.36e-06 | 9.21e-05 | 61 |
| GO:00620122 | Colorectum | FAP | regulation of small molecule metabolic process | 74/2622 | 334/18723 | 3.15e-05 | 7.13e-04 | 74 |
| GO:00313964 | Colorectum | FAP | regulation of protein ubiquitination | 50/2622 | 210/18723 | 9.03e-05 | 1.59e-03 | 50 |
| GO:00313974 | Colorectum | FAP | negative regulation of protein ubiquitination | 23/2622 | 83/18723 | 7.96e-04 | 8.36e-03 | 23 |
| GO:19033214 | Colorectum | FAP | negative regulation of protein modification by small protein conjugation or removal | 25/2622 | 95/18723 | 1.10e-03 | 1.06e-02 | 25 |
| GO:0006479 | Colorectum | FAP | protein methylation | 39/2622 | 181/18723 | 3.60e-03 | 2.58e-02 | 39 |
| GO:0008213 | Colorectum | FAP | protein alkylation | 39/2622 | 181/18723 | 3.60e-03 | 2.58e-02 | 39 |
| GO:19033205 | Colorectum | CRC | regulation of protein modification by small protein conjugation or removal | 51/2078 | 242/18723 | 4.55e-06 | 1.87e-04 | 51 |
| Page: 1 2 3 4 |
| Pathway ID | Tissue | Disease Stage | Description | Gene Ratio | Bg Ratio | pvalue | p.adjust | qvalue | Count |
| Page: 1 |
Top |
Cell-cell communication analysis |
| Identification of potential cell-cell interactions between two cell types and their ligand-receptor pairs for different disease states |
| Ligand | Receptor | LRpair | Pathway | Tissue | Disease Stage |
| Page: 1 |
Top |
Single-cell gene regulatory network inference analysis |
| Find out the significant the regulons (TFs) and the target genes of each regulon across cell types for different disease states |
| TF | Cell Type | Tissue | Disease Stage | Target Gene | RSS | Regulon Activity |
| ∗The dot plots of a searched regulon are shown for all cell subpopulations in each disease state of each tissue based on the regulon specific score inferred using pySCENIC and by calculating the average expression. |
| Page: 1 |
Top |
Somatic mutation of malignant transformation related genes |
| Annotation of somatic variants for genes involved in malignant transformation |
| Hugo Symbol | Variant Class | Variant Classification | dbSNP RS | HGVSc | HGVSp | HGVSp Short | SWISSPROT | BIOTYPE | SIFT | PolyPhen | Tumor Sample Barcode | Tissue | Histology | Sex | Age | Stage | Therapy Types | Drugs | Outcome |
| PRMT3 | SNV | Missense_Mutation | c.472N>A | p.Val158Ile | p.V158I | O60678 | protein_coding | tolerated(0.16) | benign(0) | TCGA-A8-A08T-01 | Breast | breast invasive carcinoma | Female | <65 | III/IV | Unknown | Unknown | PD | |
| PRMT3 | SNV | Missense_Mutation | rs146465935 | c.1537N>T | p.Arg513Cys | p.R513C | O60678 | protein_coding | deleterious(0) | probably_damaging(1) | TCGA-A8-A097-01 | Breast | breast invasive carcinoma | Female | >=65 | I/II | Hormone Therapy | tamoxiphen | SD |
| PRMT3 | SNV | Missense_Mutation | novel | c.41N>T | p.Ala14Val | p.A14V | O60678 | protein_coding | tolerated_low_confidence(0.11) | benign(0.246) | TCGA-BH-A0B6-01 | Breast | breast invasive carcinoma | Female | <65 | I/II | Unknown | Unknown | SD |
| PRMT3 | SNV | Missense_Mutation | c.1271N>A | p.Cys424Tyr | p.C424Y | O60678 | protein_coding | deleterious(0) | possibly_damaging(0.701) | TCGA-BH-A18H-01 | Breast | breast invasive carcinoma | Female | <65 | I/II | Chemotherapy | adriamycin | CR | |
| PRMT3 | insertion | Frame_Shift_Ins | novel | c.1214_1215insATAT | p.Val406TyrfsTer16 | p.V406Yfs*16 | O60678 | protein_coding | TCGA-A7-A26I-01 | Breast | breast invasive carcinoma | Female | >=65 | I/II | Chemotherapy | cytoxan | SD | ||
| PRMT3 | SNV | Missense_Mutation | c.1149N>T | p.Trp383Cys | p.W383C | O60678 | protein_coding | deleterious(0) | probably_damaging(1) | TCGA-A6-5665-01 | Colorectum | colon adenocarcinoma | Female | >=65 | I/II | Unknown | Unknown | PD | |
| PRMT3 | SNV | Missense_Mutation | novel | c.1438N>G | p.Trp480Gly | p.W480G | O60678 | protein_coding | deleterious(0) | probably_damaging(0.997) | TCGA-A6-5665-01 | Colorectum | colon adenocarcinoma | Female | >=65 | I/II | Unknown | Unknown | PD |
| PRMT3 | SNV | Missense_Mutation | c.854N>G | p.Asp285Gly | p.D285G | O60678 | protein_coding | deleterious(0.03) | benign(0.279) | TCGA-AA-3675-01 | Colorectum | colon adenocarcinoma | Male | >=65 | I/II | Unknown | Unknown | SD | |
| PRMT3 | SNV | Missense_Mutation | novel | c.343T>A | p.Trp115Arg | p.W115R | O60678 | protein_coding | deleterious(0) | probably_damaging(1) | TCGA-AA-3875-01 | Colorectum | colon adenocarcinoma | Female | >=65 | I/II | Unknown | Unknown | SD |
| PRMT3 | SNV | Missense_Mutation | rs771662619 | c.1024G>T | p.Asp342Tyr | p.D342Y | O60678 | protein_coding | deleterious(0) | probably_damaging(0.999) | TCGA-AA-3977-01 | Colorectum | colon adenocarcinoma | Male | >=65 | I/II | Unknown | Unknown | SD |
| Page: 1 2 3 4 5 6 |
Top |
Related drugs of malignant transformation related genes |
| Identification of chemicals and drugs interact with genes involved in malignant transfromation |
| (DGIdb 4.0) |
| Entrez ID | Symbol | Category | Interaction Types | Drug Claim Name | Drug Name | PMIDs |
| 10196 | PRMT3 | DRUGGABLE GENOME, METHYL TRANSFERASE, ENZYME | inhibitor | 310264736 | ||
| 10196 | PRMT3 | DRUGGABLE GENOME, METHYL TRANSFERASE, ENZYME | inhibitor | 178103611 | ||
| 10196 | PRMT3 | DRUGGABLE GENOME, METHYL TRANSFERASE, ENZYME | allosteric modulator | 252166753 |
| Page: 1 |

Copyright 2023-Present -The University of Texas Health Science Center at Houston |