
|
|||||
|
 | |
| |
| |
| |
| |
| |
|
Gene: PRMT2 |
Gene summary for PRMT2 |
| Gene information | Species | Human | Gene symbol | PRMT2 | Gene ID | 3275 |
| Gene name | protein arginine methyltransferase 2 | |
| Gene Alias | HRMT1L1 | |
| Cytomap | 21q22.3 | |
| Gene Type | protein-coding | GO ID | GO:0000082 | UniProtAcc | P55345 |
Top |
Malignant transformation analysis |
| Identification of the aberrant gene expression in precancerous and cancerous lesions by comparing the gene expression of stem-like cells in diseased tissues with normal stem cells |
| Entrez ID | Symbol | Replicates | Species | Organ | Tissue | Adj P-value | Log2FC | Malignancy |
| 3275 | PRMT2 | LZE4T | Human | Esophagus | ESCC | 3.35e-13 | 4.20e-01 | 0.0811 |
| 3275 | PRMT2 | LZE7T | Human | Esophagus | ESCC | 4.89e-07 | 2.73e-01 | 0.0667 |
| 3275 | PRMT2 | LZE8T | Human | Esophagus | ESCC | 7.83e-15 | 5.25e-01 | 0.067 |
| 3275 | PRMT2 | LZE20T | Human | Esophagus | ESCC | 7.59e-04 | 2.51e-01 | 0.0662 |
| 3275 | PRMT2 | LZE21D1 | Human | Esophagus | HGIN | 1.98e-02 | 4.95e-01 | 0.0632 |
| 3275 | PRMT2 | LZE22T | Human | Esophagus | ESCC | 3.33e-05 | 4.27e-01 | 0.068 |
| 3275 | PRMT2 | LZE24T | Human | Esophagus | ESCC | 1.05e-42 | 1.19e+00 | 0.0596 |
| 3275 | PRMT2 | LZE21T | Human | Esophagus | ESCC | 1.66e-06 | 7.27e-01 | 0.0655 |
| 3275 | PRMT2 | LZE6T | Human | Esophagus | ESCC | 2.73e-14 | 4.69e-01 | 0.0845 |
| 3275 | PRMT2 | P1T-E | Human | Esophagus | ESCC | 2.21e-09 | 7.98e-01 | 0.0875 |
| 3275 | PRMT2 | P2T-E | Human | Esophagus | ESCC | 4.54e-29 | 6.02e-01 | 0.1177 |
| 3275 | PRMT2 | P4T-E | Human | Esophagus | ESCC | 7.29e-54 | 1.23e+00 | 0.1323 |
| 3275 | PRMT2 | P5T-E | Human | Esophagus | ESCC | 2.78e-45 | 9.51e-01 | 0.1327 |
| 3275 | PRMT2 | P8T-E | Human | Esophagus | ESCC | 1.39e-29 | 4.93e-01 | 0.0889 |
| 3275 | PRMT2 | P9T-E | Human | Esophagus | ESCC | 5.67e-19 | 5.81e-01 | 0.1131 |
| 3275 | PRMT2 | P10T-E | Human | Esophagus | ESCC | 6.25e-65 | 1.08e+00 | 0.116 |
| 3275 | PRMT2 | P11T-E | Human | Esophagus | ESCC | 5.38e-23 | 1.14e+00 | 0.1426 |
| 3275 | PRMT2 | P12T-E | Human | Esophagus | ESCC | 1.88e-41 | 8.27e-01 | 0.1122 |
| 3275 | PRMT2 | P15T-E | Human | Esophagus | ESCC | 1.71e-19 | 5.87e-01 | 0.1149 |
| 3275 | PRMT2 | P16T-E | Human | Esophagus | ESCC | 1.35e-53 | 1.08e+00 | 0.1153 |
| Page: 1 2 3 4 5 6 7 |
| Tissue | Expression Dynamics | Abbreviation |
| Esophagus | 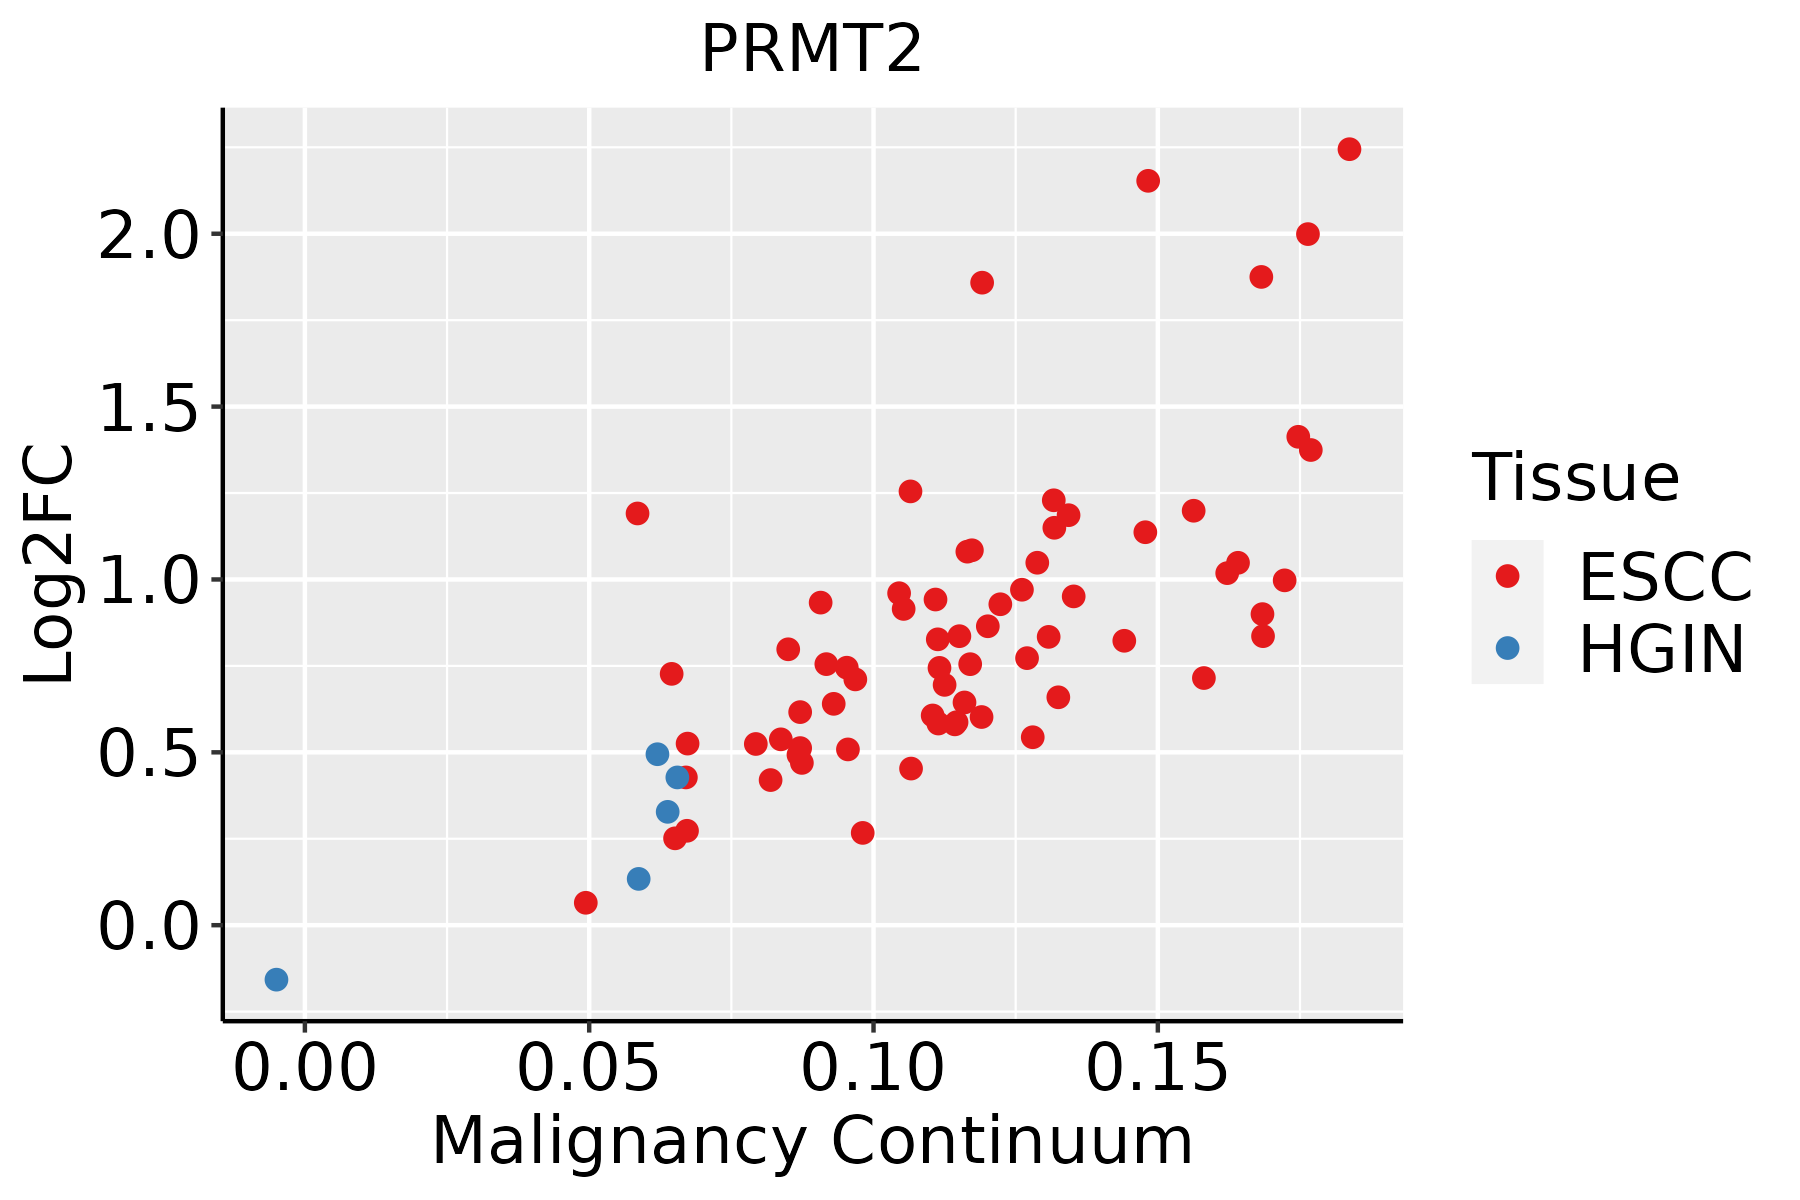 | ESCC: Esophageal squamous cell carcinoma |
| HGIN: High-grade intraepithelial neoplasias | ||
| LGIN: Low-grade intraepithelial neoplasias | ||
| Liver |  | HCC: Hepatocellular carcinoma |
| NAFLD: Non-alcoholic fatty liver disease | ||
| Oral Cavity | 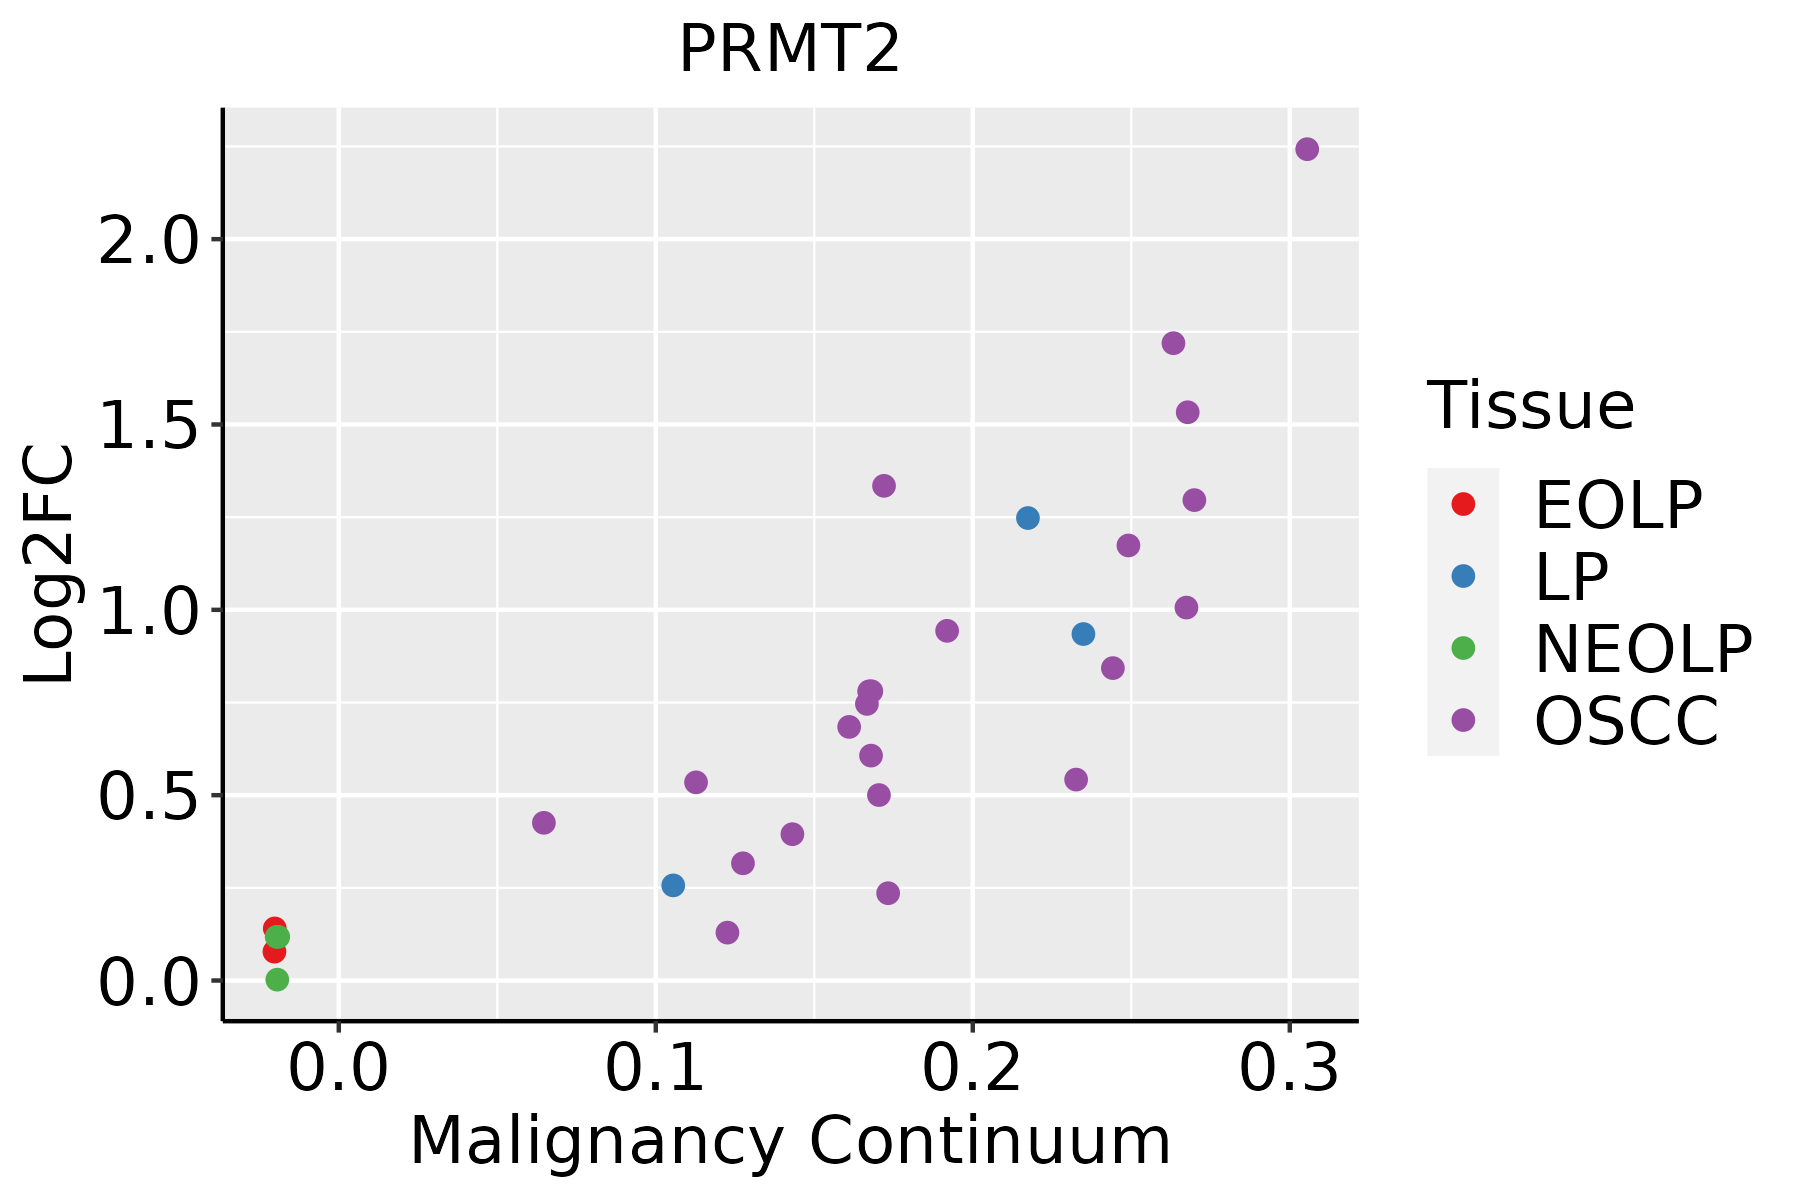 | EOLP: Erosive Oral lichen planus |
| LP: leukoplakia | ||
| NEOLP: Non-erosive oral lichen planus | ||
| OSCC: Oral squamous cell carcinoma | ||
| Skin | 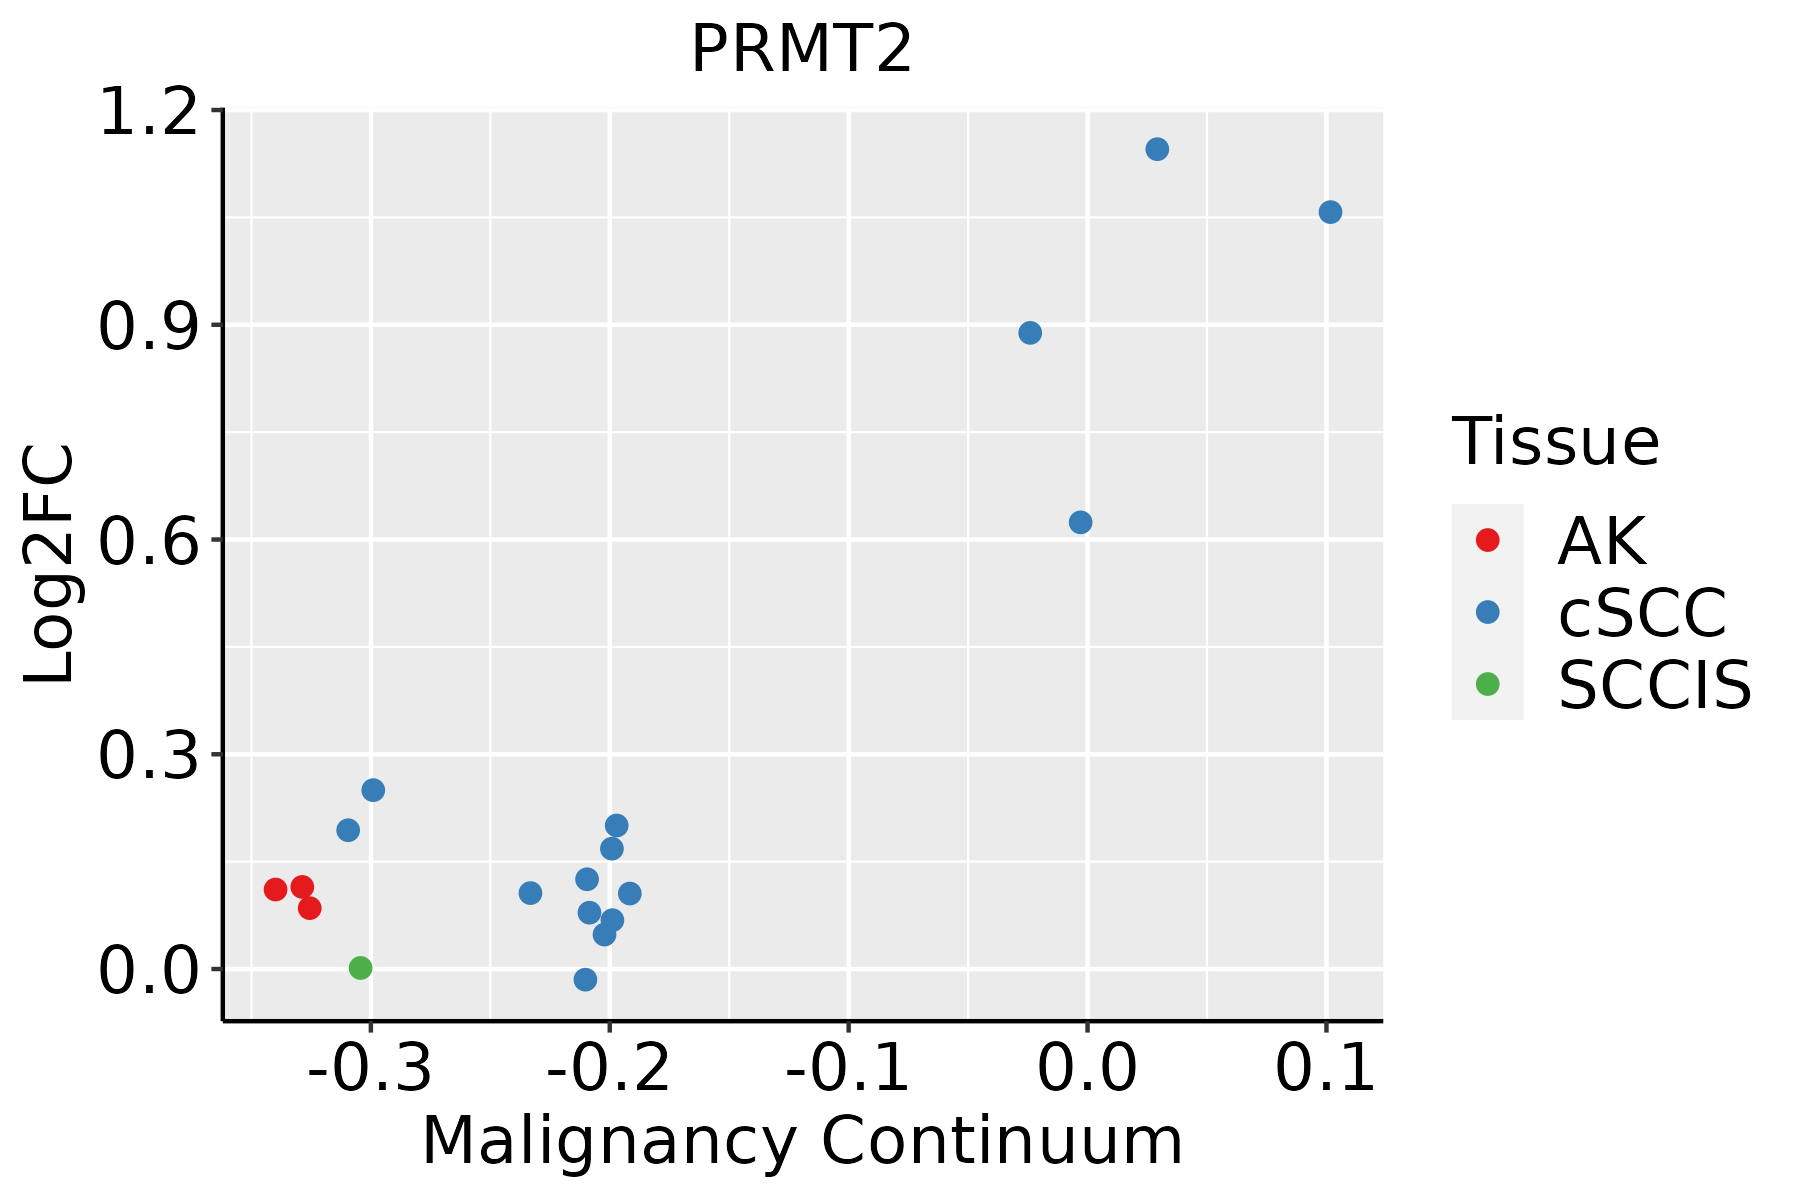 | AK: Actinic keratosis |
| cSCC: Cutaneous squamous cell carcinoma | ||
| SCCIS:squamous cell carcinoma in situ | ||
| Thyroid |  | ATC: Anaplastic thyroid cancer |
| HT: Hashimoto's thyroiditis | ||
| PTC: Papillary thyroid cancer |
| ∗log2FC in expression of this searched gene in stem-like cells from each diseased tissue sample relative to stem-like cells in normal samples in each tissue plotted against the malignancy continuum. Samples are colored based on if they are from different disease stage. |
Top |
Malignant transformation related pathway analysis |
| Find out the enriched GO biological processes and KEGG pathways involved in transition from healthy to precancer to cancer |
| Tissue | Disease Stage | Enriched GO biological Processes |
| Colorectum | AD |  |
| Colorectum | SER |  |
| Colorectum | MSS |  |
| Colorectum | MSI-H |  |
| Colorectum | FAP |  |
| ∗Top 15 enriched GO BP terms are showed in the bar plot of each disease state in each tissue. Each row represents a significant GO biological process which is colored according to the -log10(p.adjust). |
| Page: 1 2 3 4 5 6 7 8 9 |
| GO ID | Tissue | Disease Stage | Description | Gene Ratio | Bg Ratio | pvalue | p.adjust | Count |
| GO:000734610 | Esophagus | HGIN | regulation of mitotic cell cycle | 98/2587 | 457/18723 | 4.39e-06 | 1.42e-04 | 98 |
| GO:003052220 | Esophagus | HGIN | intracellular receptor signaling pathway | 62/2587 | 265/18723 | 1.63e-05 | 4.50e-04 | 62 |
| GO:00447729 | Esophagus | HGIN | mitotic cell cycle phase transition | 89/2587 | 424/18723 | 2.80e-05 | 7.21e-04 | 89 |
| GO:004854527 | Esophagus | HGIN | response to steroid hormone | 73/2587 | 339/18723 | 6.06e-05 | 1.40e-03 | 73 |
| GO:19019906 | Esophagus | HGIN | regulation of mitotic cell cycle phase transition | 65/2587 | 299/18723 | 1.12e-04 | 2.36e-03 | 65 |
| GO:00165708 | Esophagus | HGIN | histone modification | 92/2587 | 463/18723 | 1.70e-04 | 3.30e-03 | 92 |
| GO:20000456 | Esophagus | HGIN | regulation of G1/S transition of mitotic cell cycle | 36/2587 | 142/18723 | 1.74e-04 | 3.35e-03 | 36 |
| GO:00000827 | Esophagus | HGIN | G1/S transition of mitotic cell cycle | 48/2587 | 214/18723 | 3.97e-04 | 6.07e-03 | 48 |
| GO:001604919 | Esophagus | HGIN | cell growth | 93/2587 | 482/18723 | 4.49e-04 | 6.62e-03 | 93 |
| GO:00448437 | Esophagus | HGIN | cell cycle G1/S phase transition | 52/2587 | 241/18723 | 6.19e-04 | 8.58e-03 | 52 |
| GO:19028065 | Esophagus | HGIN | regulation of cell cycle G1/S phase transition | 39/2587 | 168/18723 | 6.60e-04 | 9.03e-03 | 39 |
| GO:20001343 | Esophagus | HGIN | negative regulation of G1/S transition of mitotic cell cycle | 23/2587 | 84/18723 | 7.90e-04 | 1.03e-02 | 23 |
| GO:003051818 | Esophagus | HGIN | intracellular steroid hormone receptor signaling pathway | 29/2587 | 116/18723 | 9.06e-04 | 1.15e-02 | 29 |
| GO:007138320 | Esophagus | HGIN | cellular response to steroid hormone stimulus | 44/2587 | 204/18723 | 1.56e-03 | 1.79e-02 | 44 |
| GO:00459305 | Esophagus | HGIN | negative regulation of mitotic cell cycle | 49/2587 | 235/18723 | 1.88e-03 | 2.01e-02 | 49 |
| GO:19019915 | Esophagus | HGIN | negative regulation of mitotic cell cycle phase transition | 39/2587 | 179/18723 | 2.31e-03 | 2.36e-02 | 39 |
| GO:004340118 | Esophagus | HGIN | steroid hormone mediated signaling pathway | 31/2587 | 136/18723 | 3.01e-03 | 2.88e-02 | 31 |
| GO:19028073 | Esophagus | HGIN | negative regulation of cell cycle G1/S phase transition | 23/2587 | 93/18723 | 3.39e-03 | 3.18e-02 | 23 |
| GO:00064798 | Esophagus | HGIN | protein methylation | 38/2587 | 181/18723 | 5.05e-03 | 4.22e-02 | 38 |
| GO:00082138 | Esophagus | HGIN | protein alkylation | 38/2587 | 181/18723 | 5.05e-03 | 4.22e-02 | 38 |
| Page: 1 2 3 4 5 6 7 8 9 10 11 12 13 14 |
| Pathway ID | Tissue | Disease Stage | Description | Gene Ratio | Bg Ratio | pvalue | p.adjust | qvalue | Count |
| Page: 1 |
Top |
Cell-cell communication analysis |
| Identification of potential cell-cell interactions between two cell types and their ligand-receptor pairs for different disease states |
| Ligand | Receptor | LRpair | Pathway | Tissue | Disease Stage |
| Page: 1 |
Top |
Single-cell gene regulatory network inference analysis |
| Find out the significant the regulons (TFs) and the target genes of each regulon across cell types for different disease states |
| TF | Cell Type | Tissue | Disease Stage | Target Gene | RSS | Regulon Activity |
| ∗The dot plots of a searched regulon are shown for all cell subpopulations in each disease state of each tissue based on the regulon specific score inferred using pySCENIC and by calculating the average expression. |
| Page: 1 |
Top |
Somatic mutation of malignant transformation related genes |
| Annotation of somatic variants for genes involved in malignant transformation |
| Hugo Symbol | Variant Class | Variant Classification | dbSNP RS | HGVSc | HGVSp | HGVSp Short | SWISSPROT | BIOTYPE | SIFT | PolyPhen | Tumor Sample Barcode | Tissue | Histology | Sex | Age | Stage | Therapy Types | Drugs | Outcome |
| PRMT2 | SNV | Missense_Mutation | c.97N>A | p.Glu33Lys | p.E33K | P55345 | protein_coding | deleterious(0.03) | possibly_damaging(0.491) | TCGA-A8-A06T-01 | Breast | breast invasive carcinoma | Female | >=65 | III/IV | Hormone Therapy | anastrozole | SD | |
| PRMT2 | SNV | Missense_Mutation | novel | c.457N>G | p.Leu153Val | p.L153V | P55345 | protein_coding | deleterious(0.03) | possibly_damaging(0.592) | TCGA-D8-A27V-01 | Breast | breast invasive carcinoma | Female | <65 | I/II | Hormone Therapy | tamoxiphen | SD |
| PRMT2 | insertion | In_Frame_Ins | novel | c.654_654+1insTCTCCTCAC | p.Leu218_Phe219insSerProHis | p.L218_F219insSPH | P55345 | protein_coding | TCGA-AN-A0FL-01 | Breast | breast invasive carcinoma | Female | <65 | I/II | Unknown | Unknown | SD | ||
| PRMT2 | insertion | Frame_Shift_Ins | novel | c.1300_1301insATCACAGGGCTGGGGGTGTATATGTTCCCTGA | p.Ter434TyrfsTer11 | p.*434Yfs*11 | P55345 | protein_coding | TCGA-BH-A0GY-01 | Breast | breast invasive carcinoma | Female | >=65 | I/II | Chemotherapy | cyotxan | SD | ||
| PRMT2 | SNV | Missense_Mutation | rs774024852 | c.1169N>T | p.Thr390Met | p.T390M | P55345 | protein_coding | deleterious(0.02) | possibly_damaging(0.691) | TCGA-EA-A410-01 | Cervix | cervical & endocervical cancer | Female | <65 | I/II | Unknown | Unknown | SD |
| PRMT2 | SNV | Missense_Mutation | c.70N>A | p.Gly24Ser | p.G24S | P55345 | protein_coding | tolerated(0.39) | benign(0.003) | TCGA-EK-A2RK-01 | Cervix | cervical & endocervical cancer | Female | >=65 | I/II | Unknown | Unknown | SD | |
| PRMT2 | SNV | Missense_Mutation | c.358N>A | p.Pro120Thr | p.P120T | P55345 | protein_coding | deleterious(0.01) | probably_damaging(0.959) | TCGA-A6-2686-01 | Colorectum | colon adenocarcinoma | Female | >=65 | I/II | Unknown | Unknown | SD | |
| PRMT2 | SNV | Missense_Mutation | rs753071757 | c.287N>T | p.Thr96Met | p.T96M | P55345 | protein_coding | tolerated(0.1) | possibly_damaging(0.466) | TCGA-AA-3672-01 | Colorectum | colon adenocarcinoma | Female | >=65 | III/IV | Unknown | Unknown | SD |
| PRMT2 | SNV | Missense_Mutation | novel | c.400N>A | p.Glu134Lys | p.E134K | P55345 | protein_coding | tolerated(0.44) | benign(0.122) | TCGA-AZ-4315-01 | Colorectum | colon adenocarcinoma | Male | <65 | I/II | Unknown | Unknown | SD |
| PRMT2 | SNV | Missense_Mutation | c.868N>C | p.Tyr290His | p.Y290H | P55345 | protein_coding | tolerated(0.34) | benign(0.005) | TCGA-CA-6718-01 | Colorectum | colon adenocarcinoma | Male | <65 | I/II | Unknown | Unknown | PD |
| Page: 1 2 3 4 5 |
Top |
Related drugs of malignant transformation related genes |
| Identification of chemicals and drugs interact with genes involved in malignant transfromation |
| (DGIdb 4.0) |
| Entrez ID | Symbol | Category | Interaction Types | Drug Claim Name | Drug Name | PMIDs |
| Page: 1 |

Copyright 2023-Present -The University of Texas Health Science Center at Houston |