
|
|||||
|
 | |
| |
| |
| |
| |
| |
|
Gene: PRMT1 |
Gene summary for PRMT1 |
| Gene information | Species | Human | Gene symbol | PRMT1 | Gene ID | 3276 |
| Gene name | protein arginine methyltransferase 1 | |
| Gene Alias | ANM1 | |
| Cytomap | 19q13.33 | |
| Gene Type | protein-coding | GO ID | GO:0000165 | UniProtAcc | A0A087X1W2 |
Top |
Malignant transformation analysis |
| Identification of the aberrant gene expression in precancerous and cancerous lesions by comparing the gene expression of stem-like cells in diseased tissues with normal stem cells |
| Entrez ID | Symbol | Replicates | Species | Organ | Tissue | Adj P-value | Log2FC | Malignancy |
| 3276 | PRMT1 | HTA11_3410_2000001011 | Human | Colorectum | AD | 4.03e-07 | 2.47e-01 | 0.0155 |
| 3276 | PRMT1 | HTA11_1938_2000001011 | Human | Colorectum | AD | 1.45e-09 | 4.72e-01 | -0.0811 |
| 3276 | PRMT1 | HTA11_347_2000001011 | Human | Colorectum | AD | 5.16e-07 | 2.72e-01 | -0.1954 |
| 3276 | PRMT1 | HTA11_3361_2000001011 | Human | Colorectum | AD | 5.54e-03 | 3.93e-01 | -0.1207 |
| 3276 | PRMT1 | HTA11_83_2000001011 | Human | Colorectum | SER | 1.66e-07 | 3.68e-01 | -0.1526 |
| 3276 | PRMT1 | HTA11_696_2000001011 | Human | Colorectum | AD | 9.44e-08 | 4.36e-01 | -0.1464 |
| 3276 | PRMT1 | HTA11_866_2000001011 | Human | Colorectum | AD | 3.37e-02 | 1.85e-01 | -0.1001 |
| 3276 | PRMT1 | HTA11_1391_2000001011 | Human | Colorectum | AD | 4.86e-19 | 7.08e-01 | -0.059 |
| 3276 | PRMT1 | HTA11_2992_2000001011 | Human | Colorectum | SER | 8.75e-04 | 5.33e-01 | -0.1706 |
| 3276 | PRMT1 | HTA11_5212_2000001011 | Human | Colorectum | AD | 5.10e-03 | 3.70e-01 | -0.2061 |
| 3276 | PRMT1 | HTA11_546_2000001011 | Human | Colorectum | AD | 2.97e-02 | 3.33e-01 | -0.0842 |
| 3276 | PRMT1 | HTA11_866_3004761011 | Human | Colorectum | AD | 2.31e-23 | 5.81e-01 | 0.096 |
| 3276 | PRMT1 | HTA11_8622_2000001021 | Human | Colorectum | SER | 3.08e-03 | 4.35e-01 | 0.0528 |
| 3276 | PRMT1 | HTA11_7663_2000001011 | Human | Colorectum | SER | 1.32e-03 | 4.34e-01 | 0.0131 |
| 3276 | PRMT1 | HTA11_6801_2000001011 | Human | Colorectum | SER | 7.16e-04 | 6.06e-01 | 0.0171 |
| 3276 | PRMT1 | HTA11_10711_2000001011 | Human | Colorectum | AD | 6.00e-09 | 4.14e-01 | 0.0338 |
| 3276 | PRMT1 | HTA11_7696_3000711011 | Human | Colorectum | AD | 7.04e-41 | 9.40e-01 | 0.0674 |
| 3276 | PRMT1 | HTA11_6818_2000001011 | Human | Colorectum | AD | 1.03e-05 | 5.26e-01 | 0.0112 |
| 3276 | PRMT1 | HTA11_7469_2000001011 | Human | Colorectum | AD | 1.71e-04 | 5.96e-01 | -0.0124 |
| 3276 | PRMT1 | HTA11_6818_2000001021 | Human | Colorectum | AD | 8.61e-10 | 4.39e-01 | 0.0588 |
| Page: 1 2 3 4 5 6 7 8 9 10 |
| Tissue | Expression Dynamics | Abbreviation |
| Colorectum (GSE201348) | 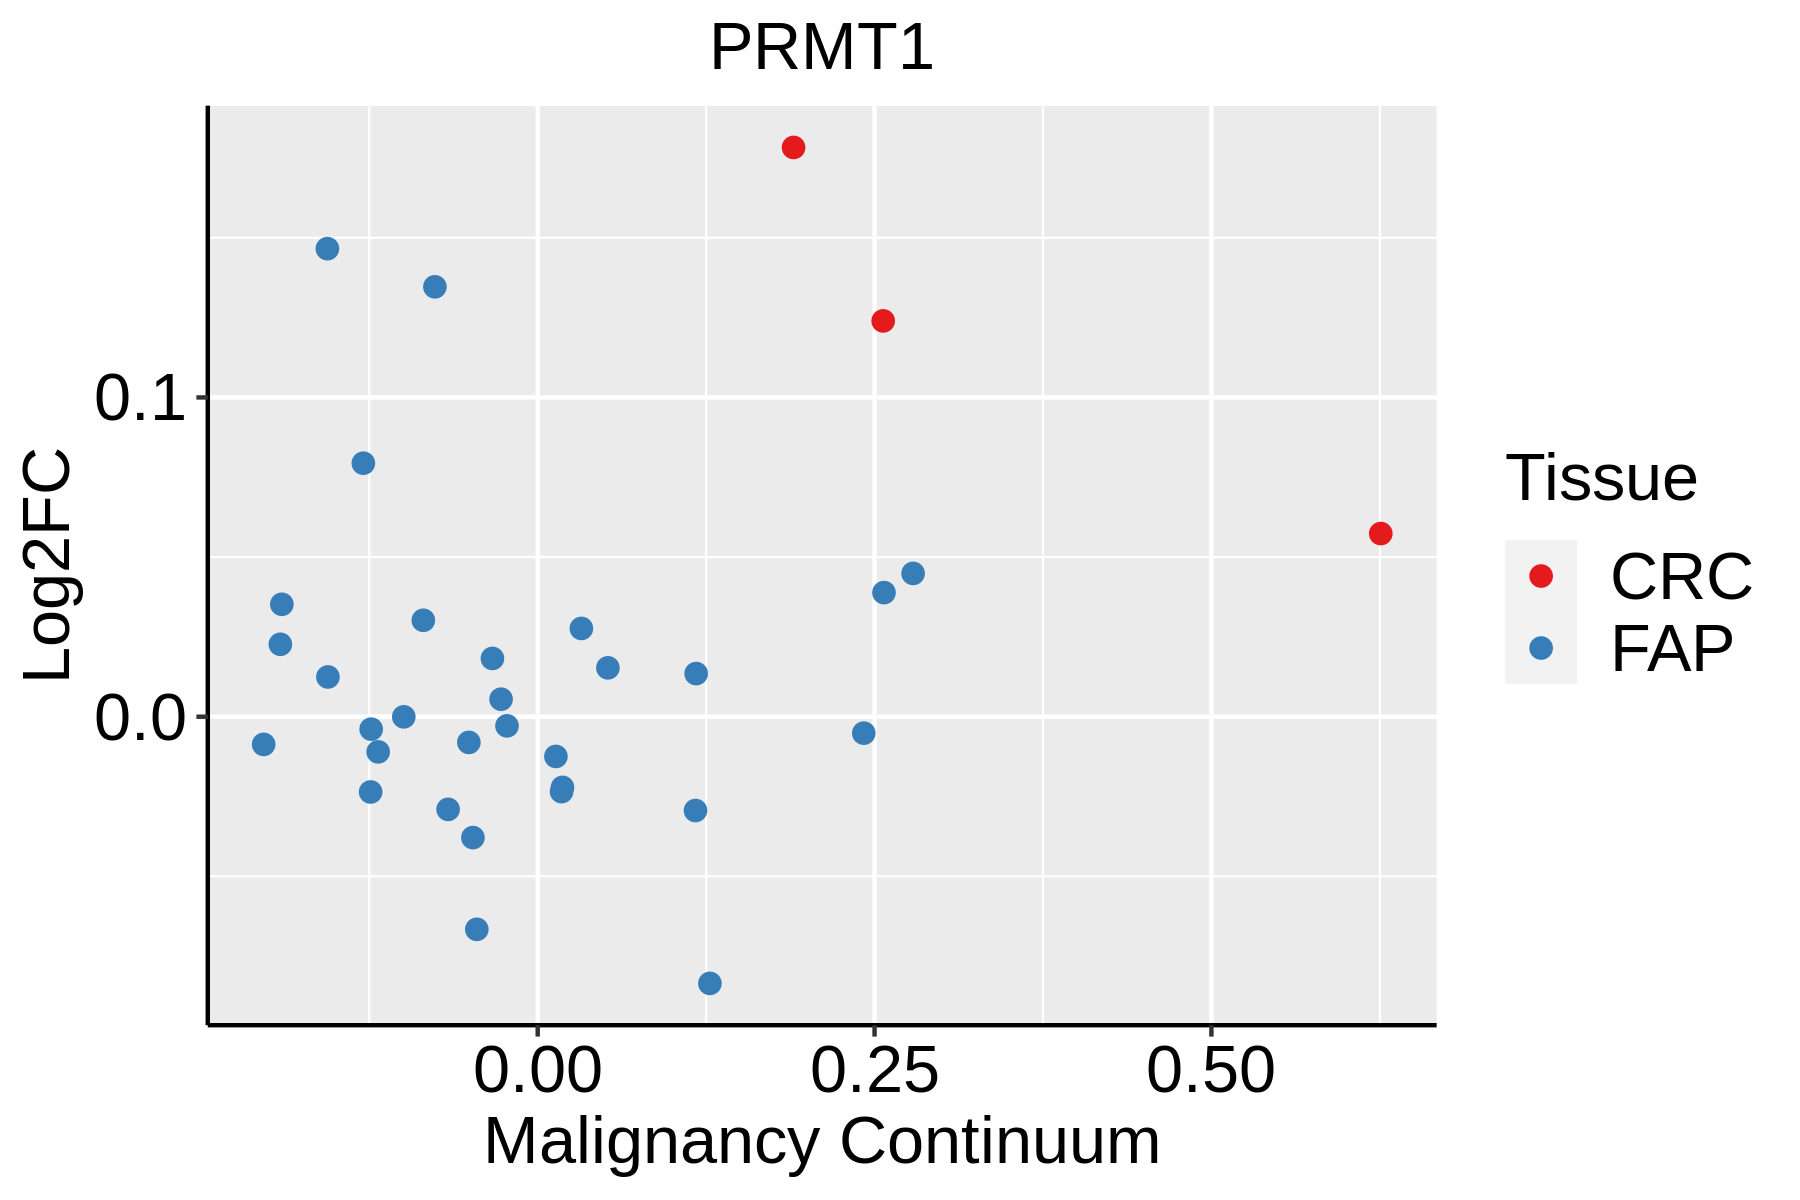 | FAP: Familial adenomatous polyposis |
| CRC: Colorectal cancer | ||
| Colorectum (HTA11) |  | AD: Adenomas |
| SER: Sessile serrated lesions | ||
| MSI-H: Microsatellite-high colorectal cancer | ||
| MSS: Microsatellite stable colorectal cancer | ||
| Endometrium |  | AEH: Atypical endometrial hyperplasia |
| EEC: Endometrioid Cancer | ||
| Esophagus | 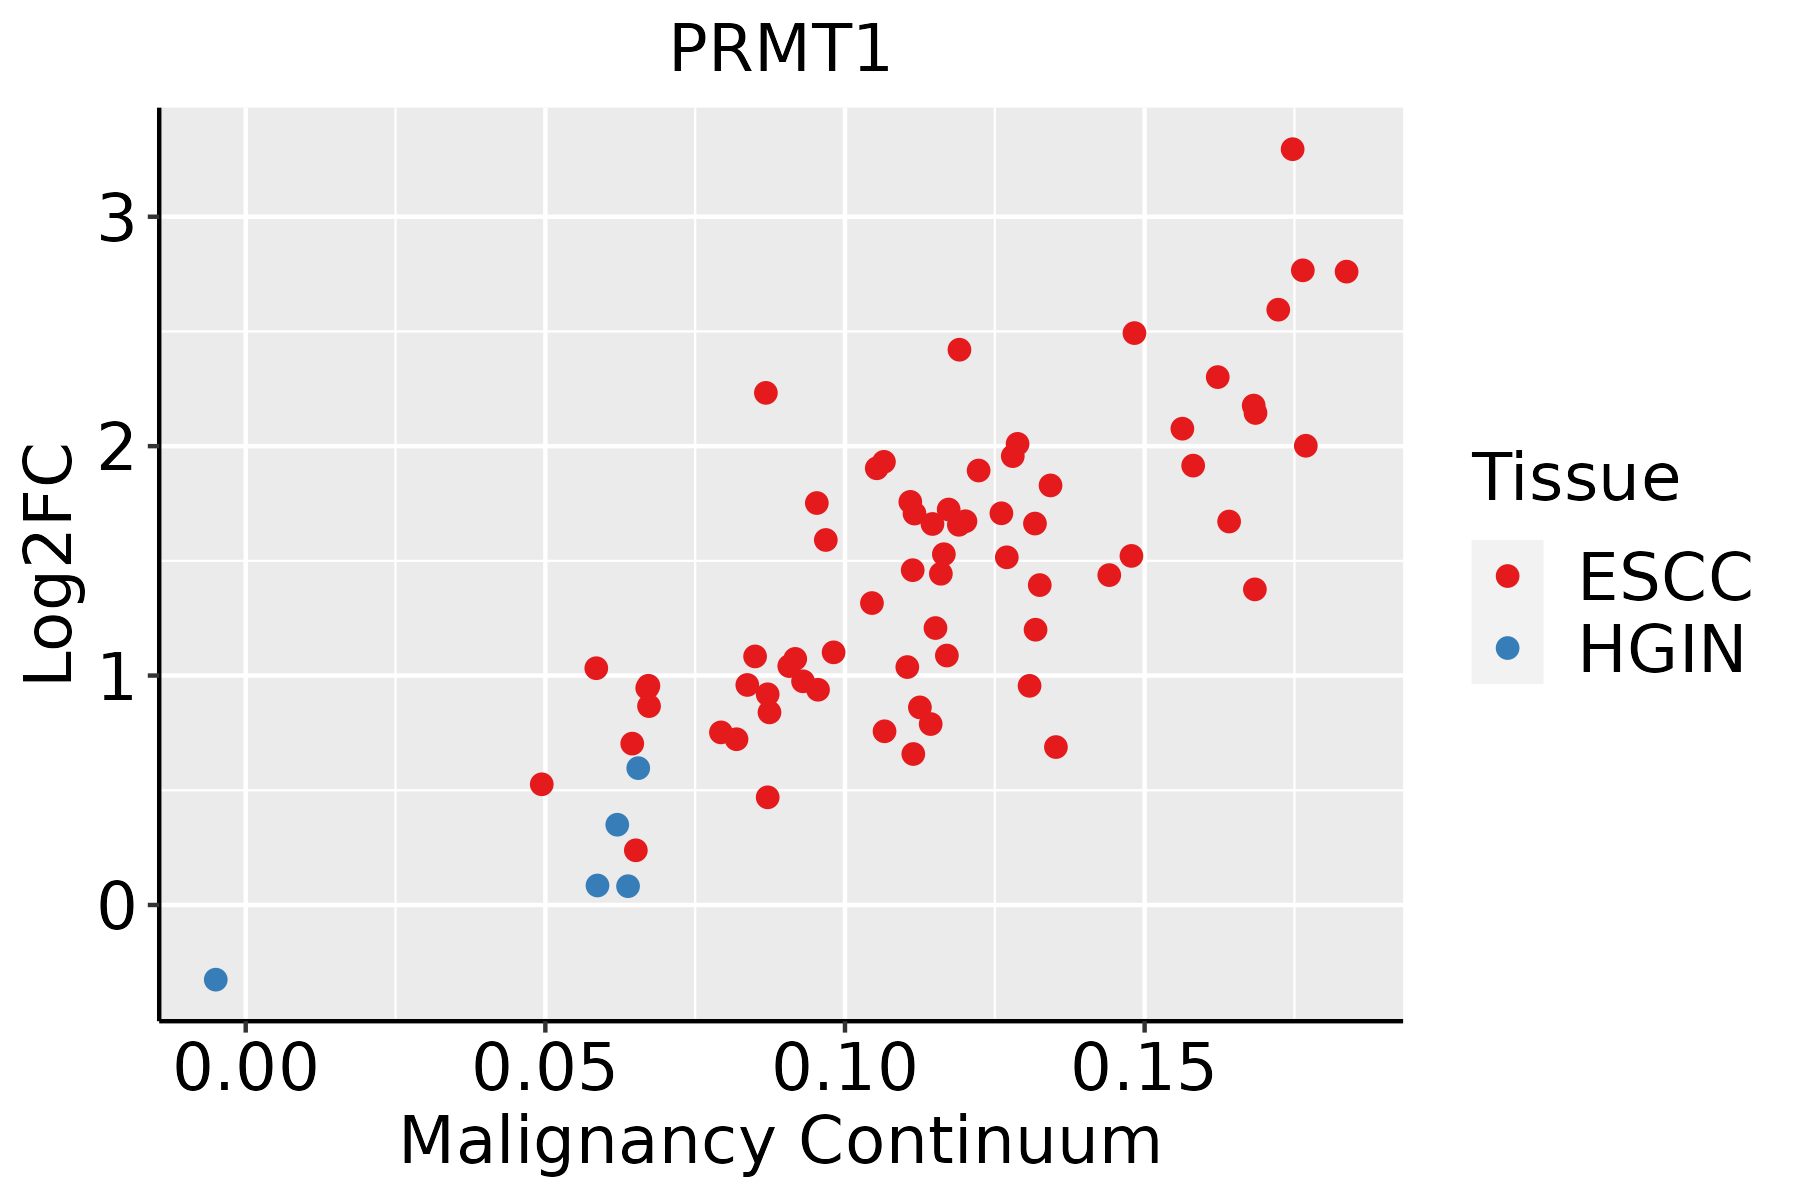 | ESCC: Esophageal squamous cell carcinoma |
| HGIN: High-grade intraepithelial neoplasias | ||
| LGIN: Low-grade intraepithelial neoplasias | ||
| Liver |  | HCC: Hepatocellular carcinoma |
| NAFLD: Non-alcoholic fatty liver disease | ||
| Oral Cavity |  | EOLP: Erosive Oral lichen planus |
| LP: leukoplakia | ||
| NEOLP: Non-erosive oral lichen planus | ||
| OSCC: Oral squamous cell carcinoma | ||
| Prostate | 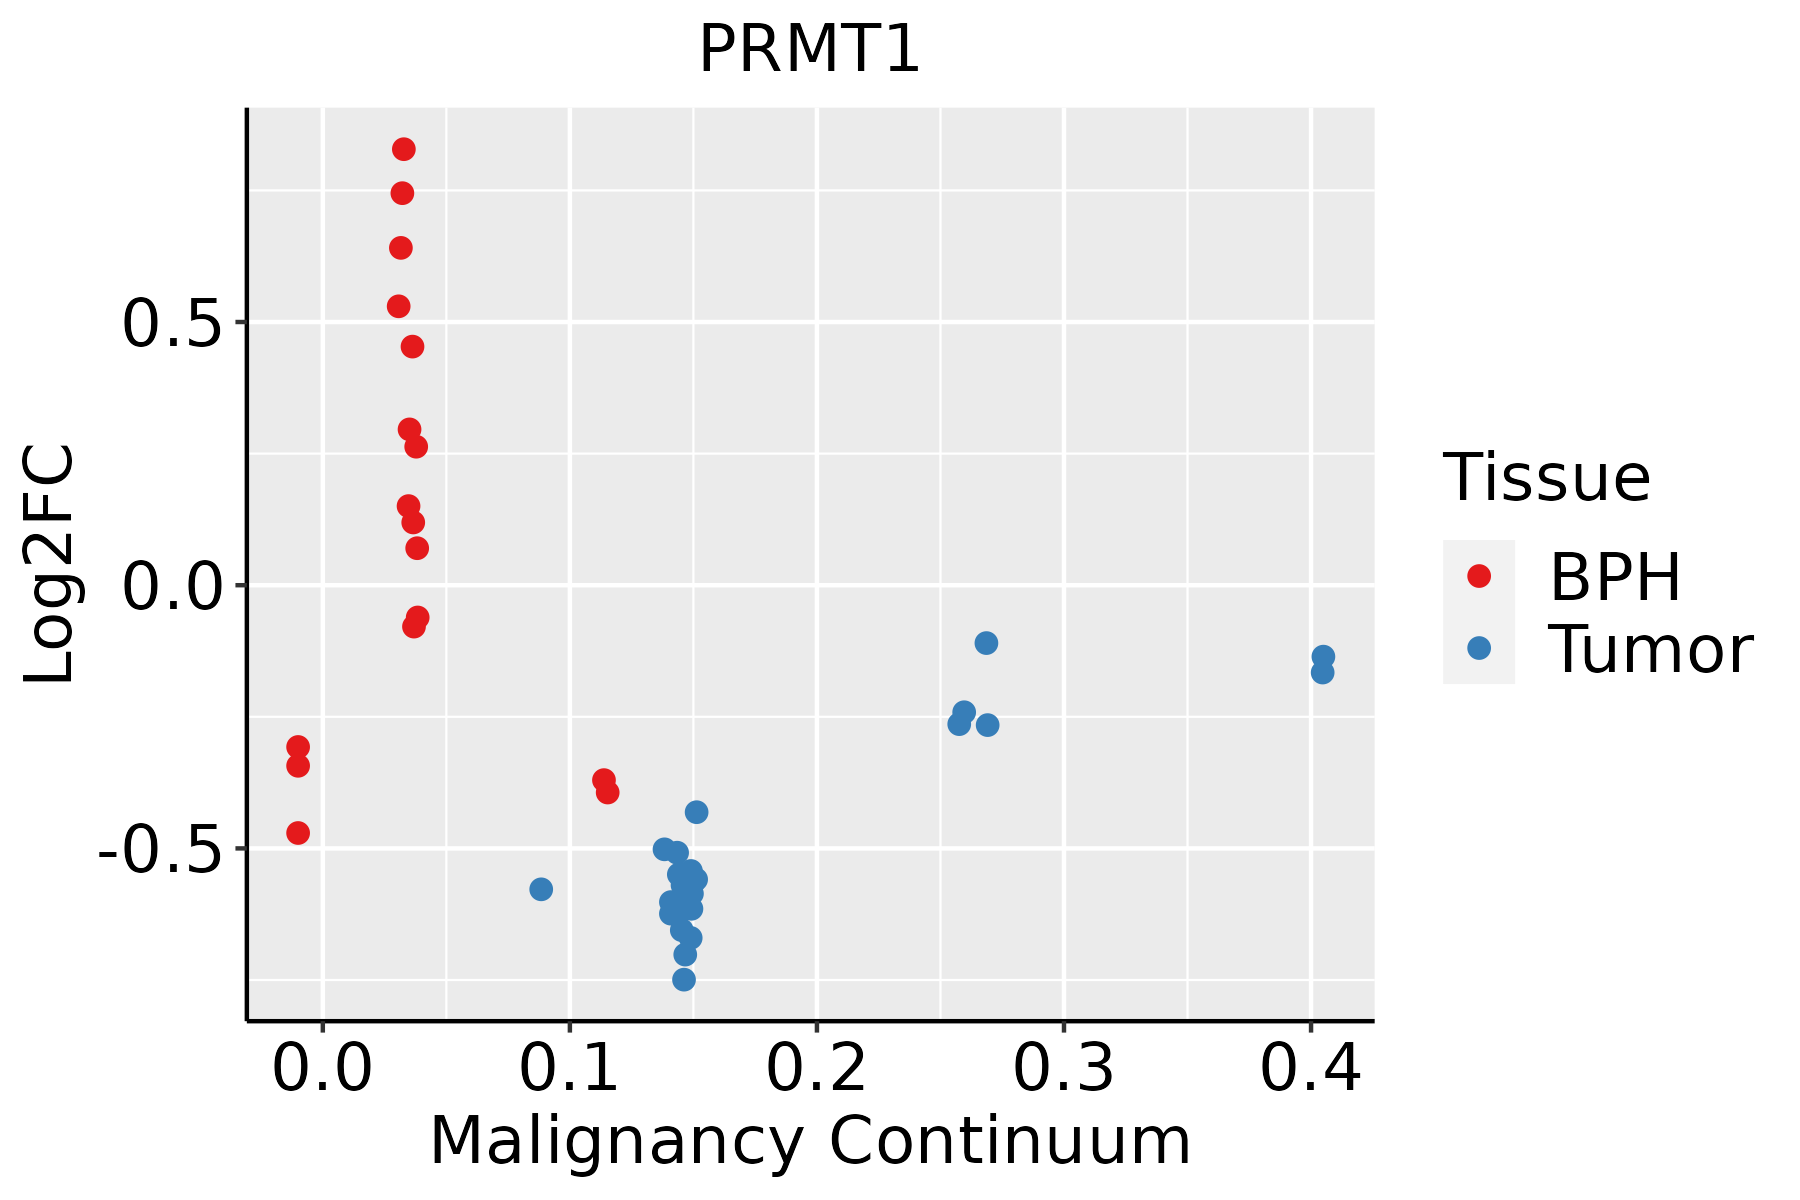 | BPH: Benign Prostatic Hyperplasia |
| Skin | 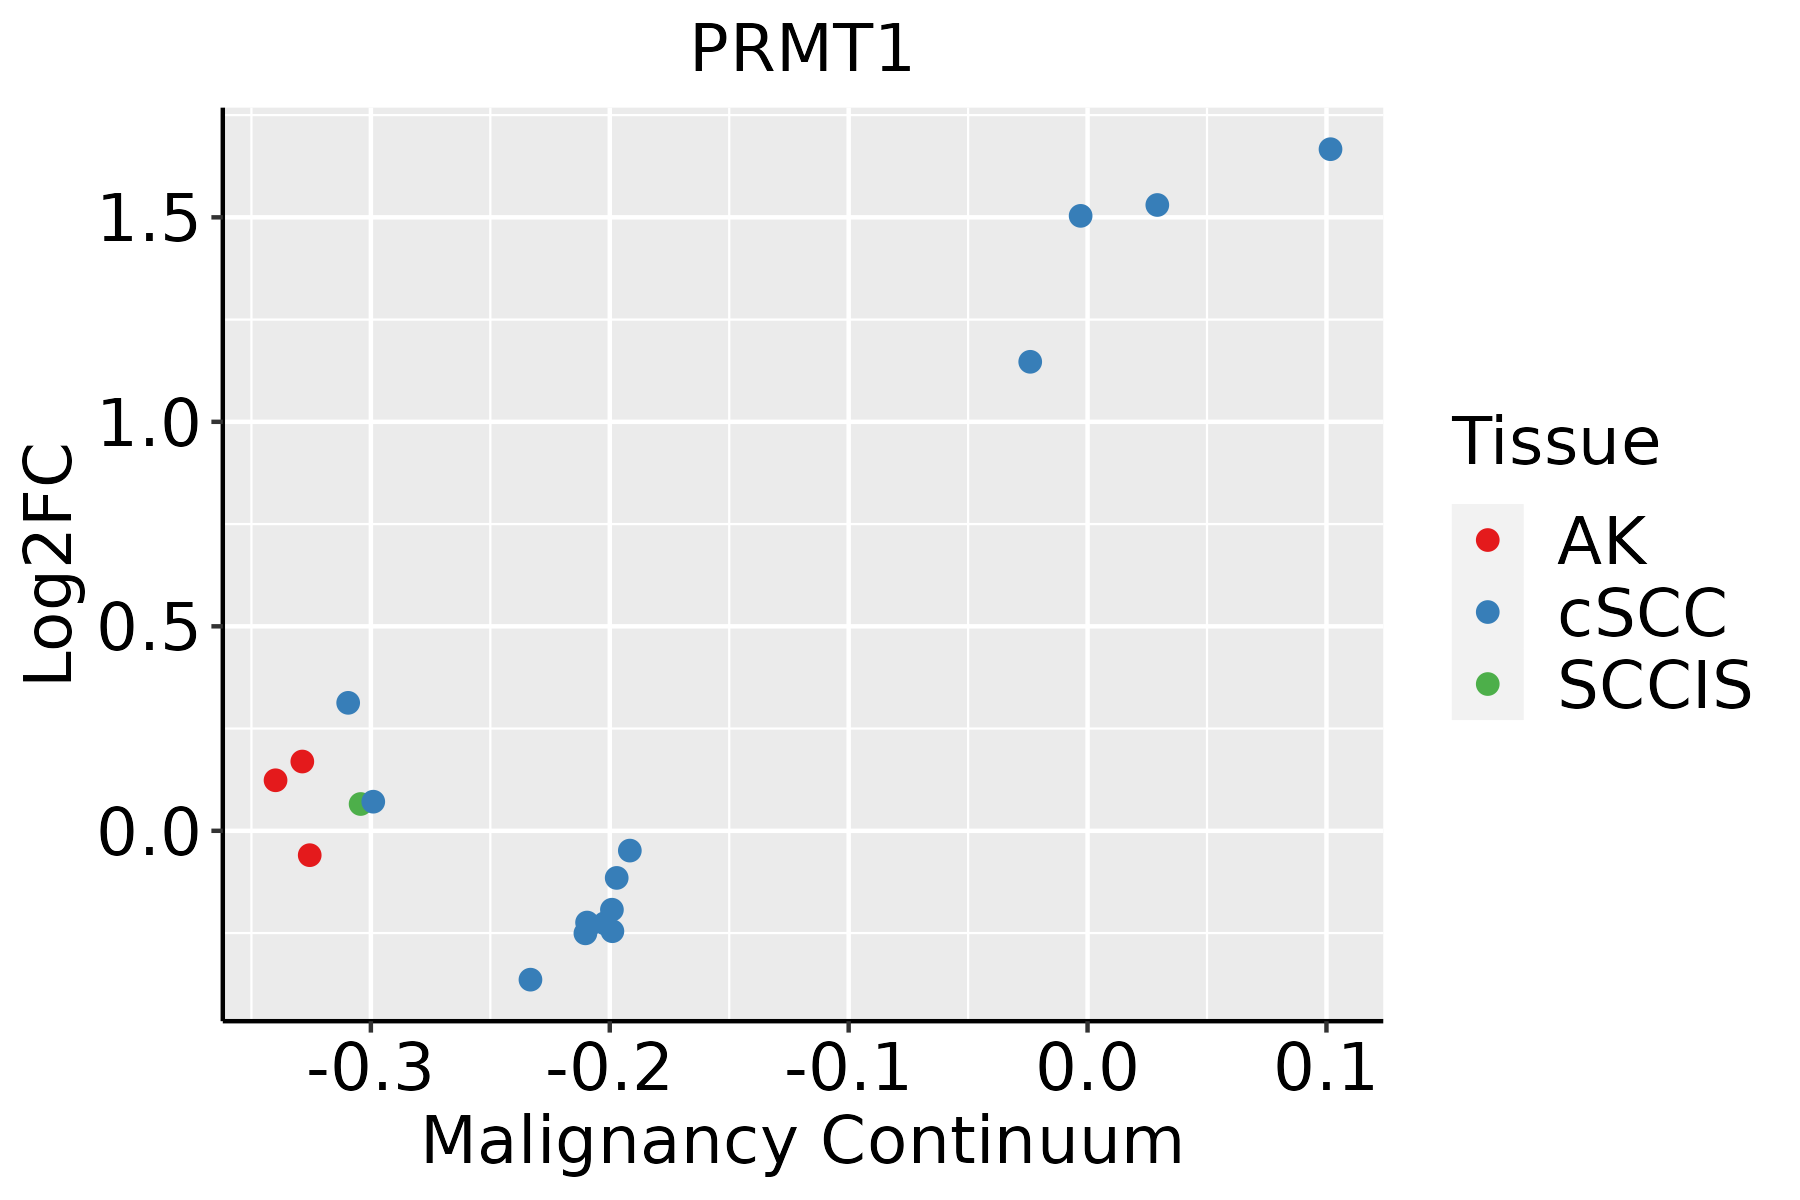 | AK: Actinic keratosis |
| cSCC: Cutaneous squamous cell carcinoma | ||
| SCCIS:squamous cell carcinoma in situ | ||
| Thyroid | 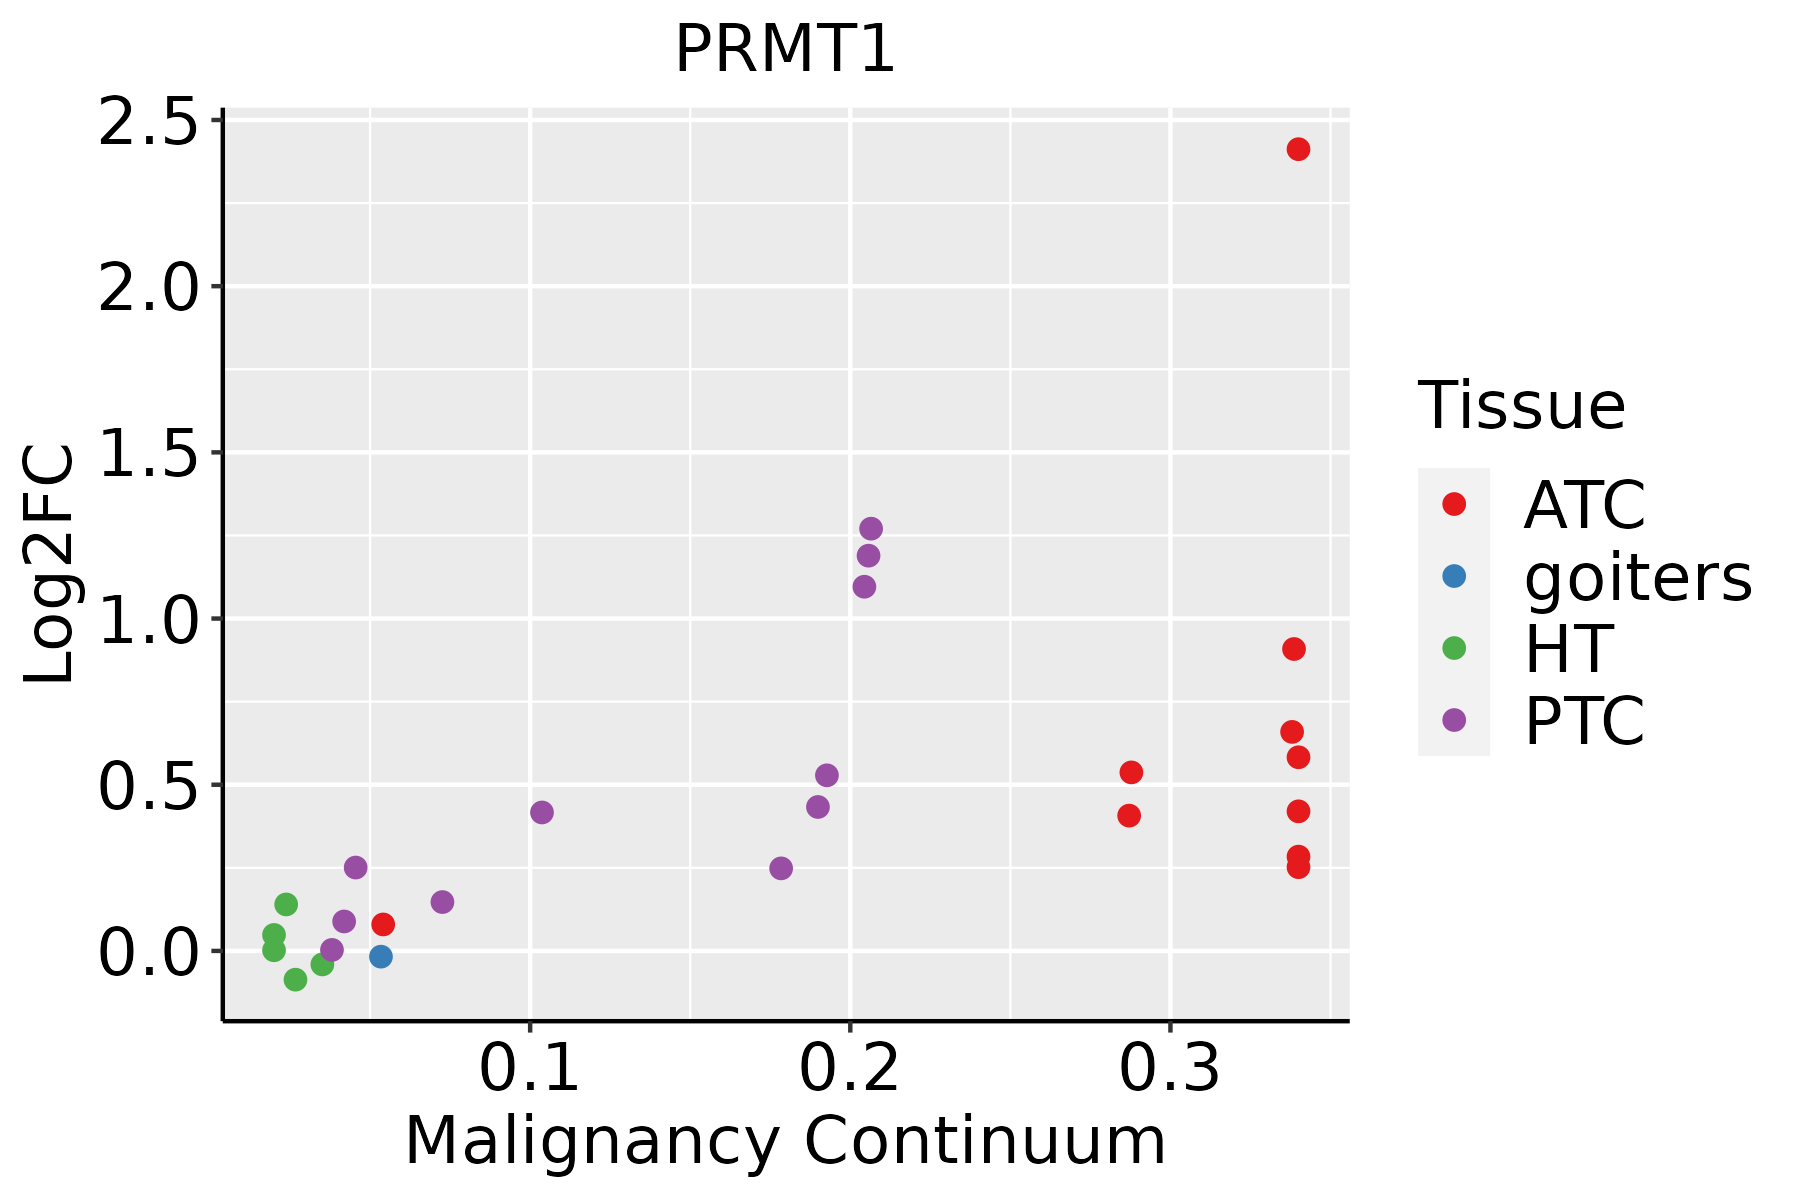 | ATC: Anaplastic thyroid cancer |
| HT: Hashimoto's thyroiditis | ||
| PTC: Papillary thyroid cancer |
| ∗log2FC in expression of this searched gene in stem-like cells from each diseased tissue sample relative to stem-like cells in normal samples in each tissue plotted against the malignancy continuum. Samples are colored based on if they are from different disease stage. |
Top |
Malignant transformation related pathway analysis |
| Find out the enriched GO biological processes and KEGG pathways involved in transition from healthy to precancer to cancer |
| Tissue | Disease Stage | Enriched GO biological Processes |
| Colorectum | AD |  |
| Colorectum | SER |  |
| Colorectum | MSS |  |
| Colorectum | MSI-H |  |
| Colorectum | FAP |  |
| ∗Top 15 enriched GO BP terms are showed in the bar plot of each disease state in each tissue. Each row represents a significant GO biological process which is colored according to the -log10(p.adjust). |
| Page: 1 2 3 4 5 6 7 8 9 |
| GO ID | Tissue | Disease Stage | Description | Gene Ratio | Bg Ratio | pvalue | p.adjust | Count |
| GO:0008380 | Colorectum | AD | RNA splicing | 169/3918 | 434/18723 | 3.59e-18 | 2.04e-15 | 169 |
| GO:0034101 | Colorectum | AD | erythrocyte homeostasis | 51/3918 | 129/18723 | 1.07e-06 | 3.59e-05 | 51 |
| GO:0030099 | Colorectum | AD | myeloid cell differentiation | 119/3918 | 381/18723 | 1.24e-06 | 4.01e-05 | 119 |
| GO:0002262 | Colorectum | AD | myeloid cell homeostasis | 57/3918 | 157/18723 | 6.17e-06 | 1.56e-04 | 57 |
| GO:0048872 | Colorectum | AD | homeostasis of number of cells | 87/3918 | 272/18723 | 1.16e-05 | 2.61e-04 | 87 |
| GO:0030218 | Colorectum | AD | erythrocyte differentiation | 45/3918 | 120/18723 | 2.22e-05 | 4.39e-04 | 45 |
| GO:0001701 | Colorectum | AD | in utero embryonic development | 110/3918 | 367/18723 | 2.36e-05 | 4.62e-04 | 110 |
| GO:0051403 | Colorectum | AD | stress-activated MAPK cascade | 72/3918 | 239/18723 | 4.77e-04 | 5.25e-03 | 72 |
| GO:0031098 | Colorectum | AD | stress-activated protein kinase signaling cascade | 74/3918 | 247/18723 | 4.80e-04 | 5.27e-03 | 74 |
| GO:0045646 | Colorectum | AD | regulation of erythrocyte differentiation | 20/3918 | 47/18723 | 6.54e-04 | 6.75e-03 | 20 |
| GO:0070302 | Colorectum | AD | regulation of stress-activated protein kinase signaling cascade | 58/3918 | 195/18723 | 2.21e-03 | 1.74e-02 | 58 |
| GO:0032872 | Colorectum | AD | regulation of stress-activated MAPK cascade | 57/3918 | 192/18723 | 2.51e-03 | 1.92e-02 | 57 |
| GO:1903706 | Colorectum | AD | regulation of hemopoiesis | 99/3918 | 367/18723 | 3.08e-03 | 2.28e-02 | 99 |
| GO:0045637 | Colorectum | AD | regulation of myeloid cell differentiation | 61/3918 | 210/18723 | 3.17e-03 | 2.35e-02 | 61 |
| GO:00083801 | Colorectum | SER | RNA splicing | 123/2897 | 434/18723 | 3.84e-12 | 8.41e-10 | 123 |
| GO:00341011 | Colorectum | SER | erythrocyte homeostasis | 39/2897 | 129/18723 | 1.70e-05 | 5.11e-04 | 39 |
| GO:00022621 | Colorectum | SER | myeloid cell homeostasis | 44/2897 | 157/18723 | 4.09e-05 | 1.03e-03 | 44 |
| GO:00488721 | Colorectum | SER | homeostasis of number of cells | 65/2897 | 272/18723 | 1.70e-04 | 3.19e-03 | 65 |
| GO:00302181 | Colorectum | SER | erythrocyte differentiation | 33/2897 | 120/18723 | 5.15e-04 | 7.30e-03 | 33 |
| GO:00456461 | Colorectum | SER | regulation of erythrocyte differentiation | 16/2897 | 47/18723 | 1.29e-03 | 1.44e-02 | 16 |
| Page: 1 2 3 4 5 6 7 8 9 10 11 12 13 14 15 16 17 18 |
| Pathway ID | Tissue | Disease Stage | Description | Gene Ratio | Bg Ratio | pvalue | p.adjust | qvalue | Count |
| hsa04922 | Colorectum | AD | Glucagon signaling pathway | 41/2092 | 107/8465 | 1.18e-03 | 7.75e-03 | 4.94e-03 | 41 |
| hsa049221 | Colorectum | AD | Glucagon signaling pathway | 41/2092 | 107/8465 | 1.18e-03 | 7.75e-03 | 4.94e-03 | 41 |
| hsa049222 | Colorectum | SER | Glucagon signaling pathway | 38/1580 | 107/8465 | 2.57e-05 | 3.28e-04 | 2.38e-04 | 38 |
| hsa049223 | Colorectum | SER | Glucagon signaling pathway | 38/1580 | 107/8465 | 2.57e-05 | 3.28e-04 | 2.38e-04 | 38 |
| hsa049224 | Colorectum | MSS | Glucagon signaling pathway | 39/1875 | 107/8465 | 5.00e-04 | 3.45e-03 | 2.11e-03 | 39 |
| hsa049225 | Colorectum | MSS | Glucagon signaling pathway | 39/1875 | 107/8465 | 5.00e-04 | 3.45e-03 | 2.11e-03 | 39 |
| hsa040689 | Esophagus | ESCC | FoxO signaling pathway | 89/4205 | 131/8465 | 1.56e-05 | 7.98e-05 | 4.09e-05 | 89 |
| hsa0492214 | Esophagus | ESCC | Glucagon signaling pathway | 64/4205 | 107/8465 | 2.18e-02 | 4.80e-02 | 2.46e-02 | 64 |
| hsa0406814 | Esophagus | ESCC | FoxO signaling pathway | 89/4205 | 131/8465 | 1.56e-05 | 7.98e-05 | 4.09e-05 | 89 |
| hsa0492215 | Esophagus | ESCC | Glucagon signaling pathway | 64/4205 | 107/8465 | 2.18e-02 | 4.80e-02 | 2.46e-02 | 64 |
| hsa040682 | Liver | Cirrhotic | FoxO signaling pathway | 52/2530 | 131/8465 | 9.98e-03 | 3.32e-02 | 2.05e-02 | 52 |
| hsa0492221 | Liver | Cirrhotic | Glucagon signaling pathway | 43/2530 | 107/8465 | 1.42e-02 | 4.35e-02 | 2.68e-02 | 43 |
| hsa040683 | Liver | Cirrhotic | FoxO signaling pathway | 52/2530 | 131/8465 | 9.98e-03 | 3.32e-02 | 2.05e-02 | 52 |
| hsa0492231 | Liver | Cirrhotic | Glucagon signaling pathway | 43/2530 | 107/8465 | 1.42e-02 | 4.35e-02 | 2.68e-02 | 43 |
| hsa040684 | Liver | HCC | FoxO signaling pathway | 85/4020 | 131/8465 | 3.99e-05 | 2.16e-04 | 1.20e-04 | 85 |
| hsa0492241 | Liver | HCC | Glucagon signaling pathway | 64/4020 | 107/8465 | 6.70e-03 | 1.87e-02 | 1.04e-02 | 64 |
| hsa040685 | Liver | HCC | FoxO signaling pathway | 85/4020 | 131/8465 | 3.99e-05 | 2.16e-04 | 1.20e-04 | 85 |
| hsa0492251 | Liver | HCC | Glucagon signaling pathway | 64/4020 | 107/8465 | 6.70e-03 | 1.87e-02 | 1.04e-02 | 64 |
| hsa040688 | Oral cavity | OSCC | FoxO signaling pathway | 85/3704 | 131/8465 | 7.50e-07 | 4.33e-06 | 2.21e-06 | 85 |
| hsa0406813 | Oral cavity | OSCC | FoxO signaling pathway | 85/3704 | 131/8465 | 7.50e-07 | 4.33e-06 | 2.21e-06 | 85 |
| Page: 1 2 |
Top |
Cell-cell communication analysis |
| Identification of potential cell-cell interactions between two cell types and their ligand-receptor pairs for different disease states |
| Ligand | Receptor | LRpair | Pathway | Tissue | Disease Stage |
| Page: 1 |
Top |
Single-cell gene regulatory network inference analysis |
| Find out the significant the regulons (TFs) and the target genes of each regulon across cell types for different disease states |
| TF | Cell Type | Tissue | Disease Stage | Target Gene | RSS | Regulon Activity |
| ∗The dot plots of a searched regulon are shown for all cell subpopulations in each disease state of each tissue based on the regulon specific score inferred using pySCENIC and by calculating the average expression. |
| Page: 1 |
Top |
Somatic mutation of malignant transformation related genes |
| Annotation of somatic variants for genes involved in malignant transformation |
| Hugo Symbol | Variant Class | Variant Classification | dbSNP RS | HGVSc | HGVSp | HGVSp Short | SWISSPROT | BIOTYPE | SIFT | PolyPhen | Tumor Sample Barcode | Tissue | Histology | Sex | Age | Stage | Therapy Types | Drugs | Outcome |
| PRMT1 | deletion | Frame_Shift_Del | c.945delN | p.Val316CysfsTer8 | p.V316Cfs*8 | protein_coding | TCGA-D8-A27V-01 | Breast | breast invasive carcinoma | Female | <65 | I/II | Hormone Therapy | tamoxiphen | SD | ||||
| PRMT1 | SNV | Missense_Mutation | rs544334510 | c.562N>A | p.Asp188Asn | p.D188N | protein_coding | tolerated(0.34) | benign(0.007) | TCGA-DS-A0VM-01 | Cervix | cervical & endocervical cancer | Female | <65 | I/II | Chemotherapy | cisplatin | PD | |
| PRMT1 | SNV | Missense_Mutation | c.584G>A | p.Arg195Gln | p.R195Q | protein_coding | tolerated(0.06) | probably_damaging(0.999) | TCGA-AD-6895-01 | Colorectum | colon adenocarcinoma | Male | >=65 | III/IV | Unknown | Unknown | SD | ||
| PRMT1 | SNV | Missense_Mutation | c.896N>T | p.Thr299Ile | p.T299I | protein_coding | tolerated(1) | benign(0.139) | TCGA-CK-4951-01 | Colorectum | colon adenocarcinoma | Female | >=65 | I/II | Unknown | Unknown | PD | ||
| PRMT1 | SNV | Missense_Mutation | c.536N>G | p.Tyr179Cys | p.Y179C | protein_coding | deleterious(0) | possibly_damaging(0.837) | TCGA-D5-6541-01 | Colorectum | colon adenocarcinoma | Male | <65 | I/II | Unknown | Unknown | SD | ||
| PRMT1 | SNV | Missense_Mutation | novel | c.298G>A | p.Gly100Ser | p.G100S | protein_coding | deleterious(0.04) | benign(0.308) | TCGA-A5-A0G2-01 | Endometrium | uterine corpus endometrioid carcinoma | Female | <65 | III/IV | Unknown | Unknown | SD | |
| PRMT1 | SNV | Missense_Mutation | novel | c.1015C>T | p.Pro339Ser | p.P339S | protein_coding | deleterious(0.03) | possibly_damaging(0.822) | TCGA-A5-A0GG-01 | Endometrium | uterine corpus endometrioid carcinoma | Female | >=65 | I/II | Unknown | Unknown | SD | |
| PRMT1 | SNV | Missense_Mutation | c.985G>A | p.Glu329Lys | p.E329K | protein_coding | deleterious(0.01) | probably_damaging(0.938) | TCGA-AP-A0LM-01 | Endometrium | uterine corpus endometrioid carcinoma | Female | <65 | III/IV | Chemotherapy | cisplatin | SD | ||
| PRMT1 | SNV | Missense_Mutation | novel | c.90A>T | p.Glu30Asp | p.E30D | protein_coding | tolerated(0.43) | benign(0.001) | TCGA-AX-A06F-01 | Endometrium | uterine corpus endometrioid carcinoma | Female | <65 | III/IV | Chemotherapy | carboplatin | SD | |
| PRMT1 | SNV | Missense_Mutation | c.1021N>A | p.Ala341Thr | p.A341T | protein_coding | tolerated(0.12) | benign(0.006) | TCGA-AX-A0J1-01 | Endometrium | uterine corpus endometrioid carcinoma | Female | >=65 | I/II | Unknown | Unknown | SD |
| Page: 1 2 3 4 |
Top |
Related drugs of malignant transformation related genes |
| Identification of chemicals and drugs interact with genes involved in malignant transfromation |
| (DGIdb 4.0) |
| Entrez ID | Symbol | Category | Interaction Types | Drug Claim Name | Drug Name | PMIDs |
| 3276 | PRMT1 | ENZYME, METHYL TRANSFERASE | FURAMIDINE | FURAMIDINE | 24564570 | |
| 3276 | PRMT1 | ENZYME, METHYL TRANSFERASE | NSC-45174 | CHEMBL221047 | 20666457 | |
| 3276 | PRMT1 | ENZYME, METHYL TRANSFERASE | inhibitor | 310264736 | ||
| 3276 | PRMT1 | ENZYME, METHYL TRANSFERASE | inhibitor | 178103616 | ||
| 3276 | PRMT1 | ENZYME, METHYL TRANSFERASE | inhibitor | 178103608 | ||
| 3276 | PRMT1 | ENZYME, METHYL TRANSFERASE | inhibitor | 178103607 | ||
| 3276 | PRMT1 | ENZYME, METHYL TRANSFERASE | STILBAMIDINE | STILBAMIDINE | 20666457 | |
| 3276 | PRMT1 | ENZYME, METHYL TRANSFERASE | NSC-47762 | CHEMBL1092740 | 20666457 | |
| 3276 | PRMT1 | ENZYME, METHYL TRANSFERASE | EOSIN | EOSIN | 18348515 |
| Page: 1 |

Copyright 2023-Present -The University of Texas Health Science Center at Houston |