Schematic overview of the cellular and molecular mechanisms involved in the cancer progression, including the proposed cellular and molecular mechanisms in cancer cells trajectory. AT1: alveolar type 1 cells; AT2: alveolar type 2 cells; AAH: atypical adenomatous hyperplasia; AIS: adenocarcinoma in situ; MIA: minimally invasive adenocarcinoma; IA: invasive adenocarcinoma; EMT: epithelial-mesenchymal transition

Home

Download

Statistics

Help

Contact

Center for Computational Systems Medicine
leaf

Gene summary

leaf

Malignant transformation analysis

leaf

Malignant transformation related pathway analysis

leaf

Cell-cell communication analysis

leaf

Single-cell gene regulatory network inference analysis

leaf

Somatic mutation of malignant transformation related genes

leaf

Related drugs of malignant transformation related genes

Gene: PRLR

Gene summary for PRLR

check button Gene summary.

Gene informationSpeciesHuman
Gene symbol

PRLR

Gene ID

5618

Gene nameprolactin receptor
Gene AliasHPRL
Cytomap5p13.2
Gene Typeprotein-coding
GO ID

GO:0000003

UniProtAcc

P16471


Top

Malignant transformation analysis

check button Identification of the aberrant gene expression in precancerous and cancerous lesions by comparing the gene expression of stem-like cells in diseased tissues with normal stem cells
check button Malignant transformation involving gene list.
Entrez IDSymbolReplicatesSpeciesOrganTissueAdj P-valueLog2FCMalignancy
5618PRLRGSM4909293HumanBreastIDC9.59e-113.20e-010.1581
5618PRLRGSM4909298HumanBreastIDC3.79e-144.59e-010.1551
5618PRLRGSM4909302HumanBreastIDC1.52e-135.00e-010.1545
5618PRLRGSM4909303HumanBreastIDC4.67e-085.72e-010.0438
5618PRLRGSM4909306HumanBreastIDC5.45e-073.52e-010.1564
5618PRLRGSM4909311HumanBreastIDC4.79e-09-1.18e-010.1534
5618PRLRGSM4909317HumanBreastIDC1.68e-123.93e-010.1355
5618PRLRGSM4909319HumanBreastIDC4.39e-12-1.32e-010.1563
5618PRLRGSM4909321HumanBreastIDC3.34e-04-1.21e-010.1559
5618PRLRM1HumanBreastIDC4.18e-053.20e-010.1577
5618PRLRNCCBC2HumanBreastDCIS2.96e-034.80e-010.1554
5618PRLRP1HumanBreastIDC2.02e-031.23e-010.1527
5618PRLRP3HumanBreastIDC2.26e-035.24e-010.1542
5618PRLRDCIS2HumanBreastDCIS1.06e-25-4.69e-020.0085
5618PRLRHTA11_3410_2000001011HumanColorectumAD4.82e-09-3.84e-010.0155
5618PRLRHTA11_3361_2000001011HumanColorectumAD1.54e-02-4.76e-01-0.1207
5618PRLRHTA11_696_2000001011HumanColorectumAD3.79e-02-2.72e-01-0.1464
5618PRLRHTA11_866_2000001011HumanColorectumAD7.05e-03-3.08e-01-0.1001
5618PRLRHTA11_10711_2000001011HumanColorectumAD1.37e-02-4.09e-010.0338
5618PRLRHTA11_99999970781_79442HumanColorectumMSS5.98e-09-3.87e-010.294
Page: 1 2 3 4 

check button Transcriptomic changes along malignancy continuum.
TissueExpression DynamicsAbbreviation
BreastThe image shows the transcriptomic changes along malignancy continuum.log2FC in expression of this searched gene in stem-like cells from each diseased tissue sample relative to stem-like cells in normal samples in each tissue plotted against the malignancy continuum. Samples are colored based on if they are from different disease stage.
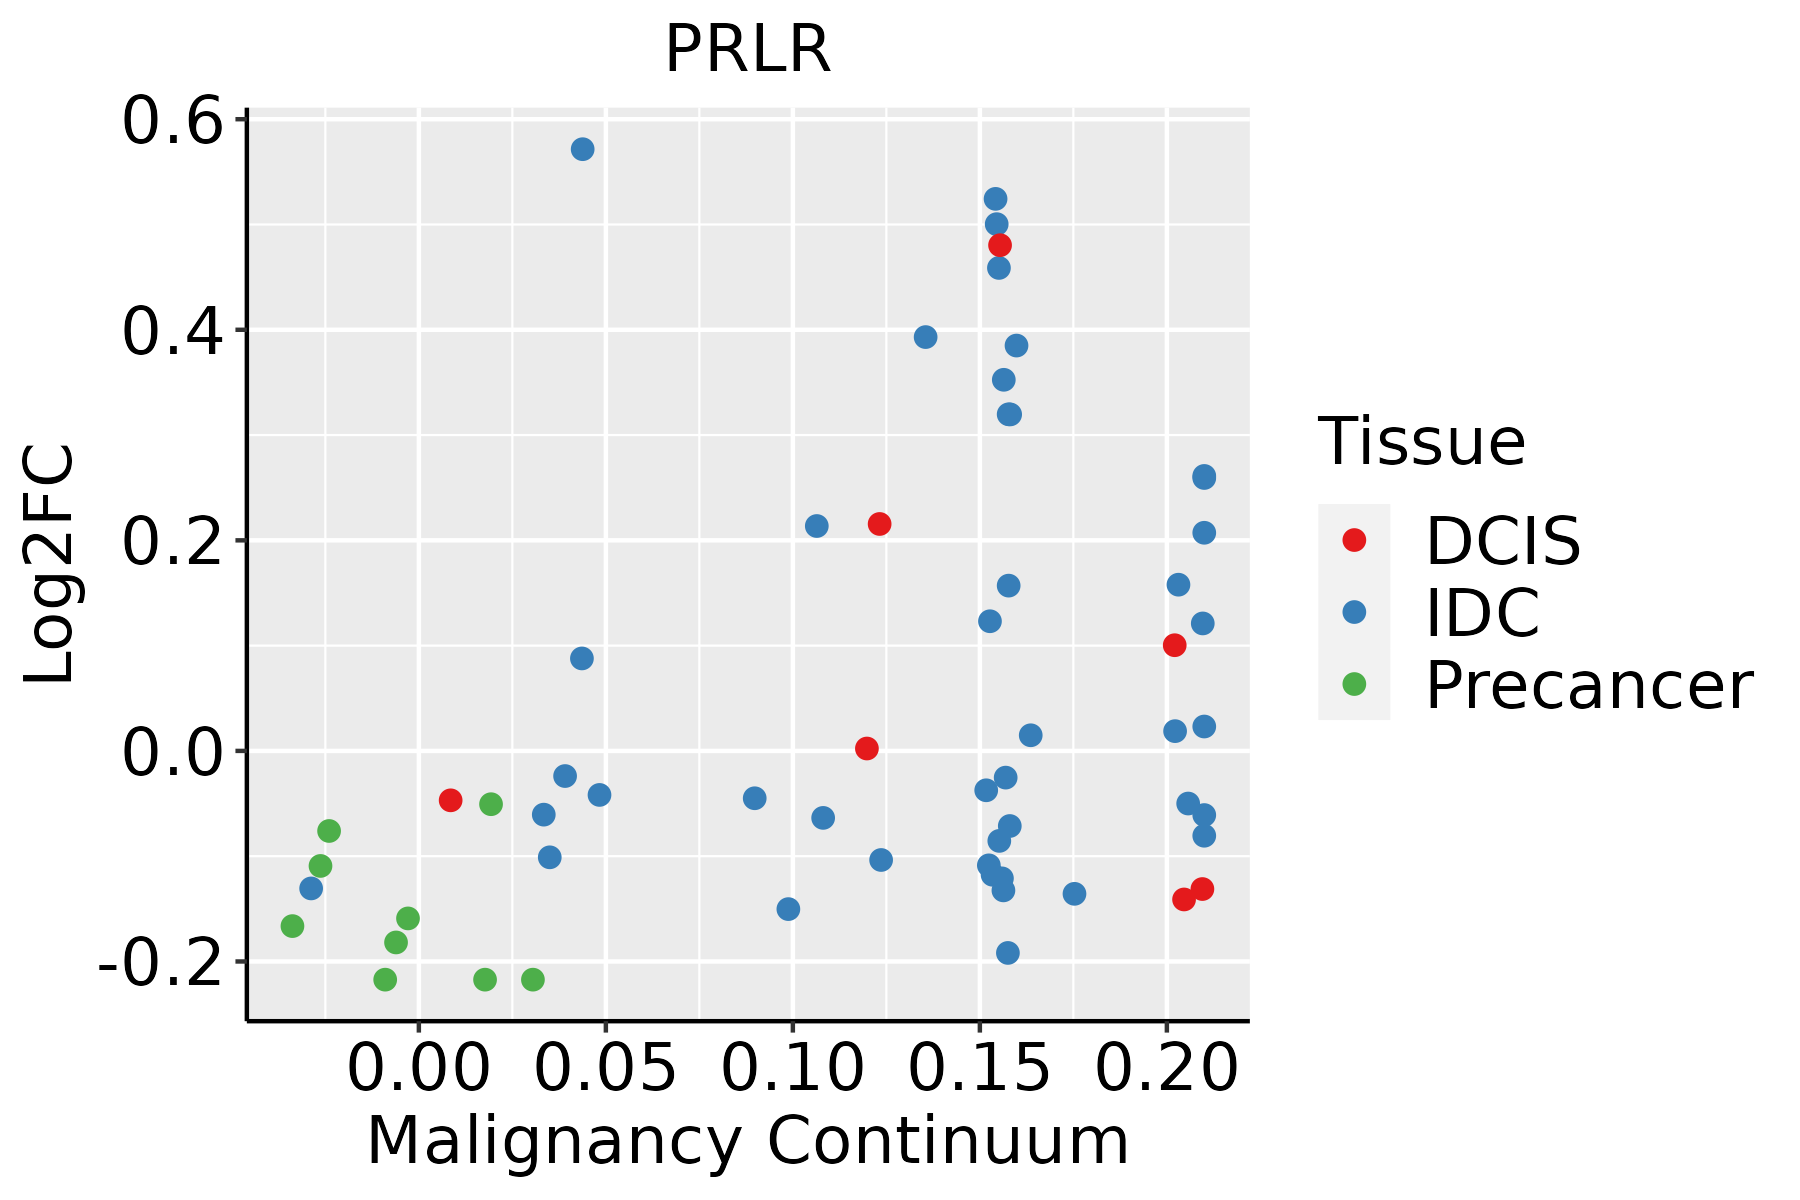
IDC: Invasive ductal carcinoma
DCIS: Ductal carcinoma in situ
Precancer(BRCA1-mut): Precancerous lesion from BRCA1 mutation carriers
Colorectum (GSE201348)The image shows the transcriptomic changes along malignancy continuum.log2FC in expression of this searched gene in stem-like cells from each diseased tissue sample relative to stem-like cells in normal samples in each tissue plotted against the malignancy continuum. Samples are colored based on if they are from different disease stage.FAP: Familial adenomatous polyposis
CRC: Colorectal cancer
Colorectum (HTA11)The image shows the transcriptomic changes along malignancy continuum.log2FC in expression of this searched gene in stem-like cells from each diseased tissue sample relative to stem-like cells in normal samples in each tissue plotted against the malignancy continuum. Samples are colored based on if they are from different disease stage.AD: Adenomas
SER: Sessile serrated lesions
MSI-H: Microsatellite-high colorectal cancer
MSS: Microsatellite stable colorectal cancer
EsophagusThe image shows the transcriptomic changes along malignancy continuum.log2FC in expression of this searched gene in stem-like cells from each diseased tissue sample relative to stem-like cells in normal samples in each tissue plotted against the malignancy continuum. Samples are colored based on if they are from different disease stage.
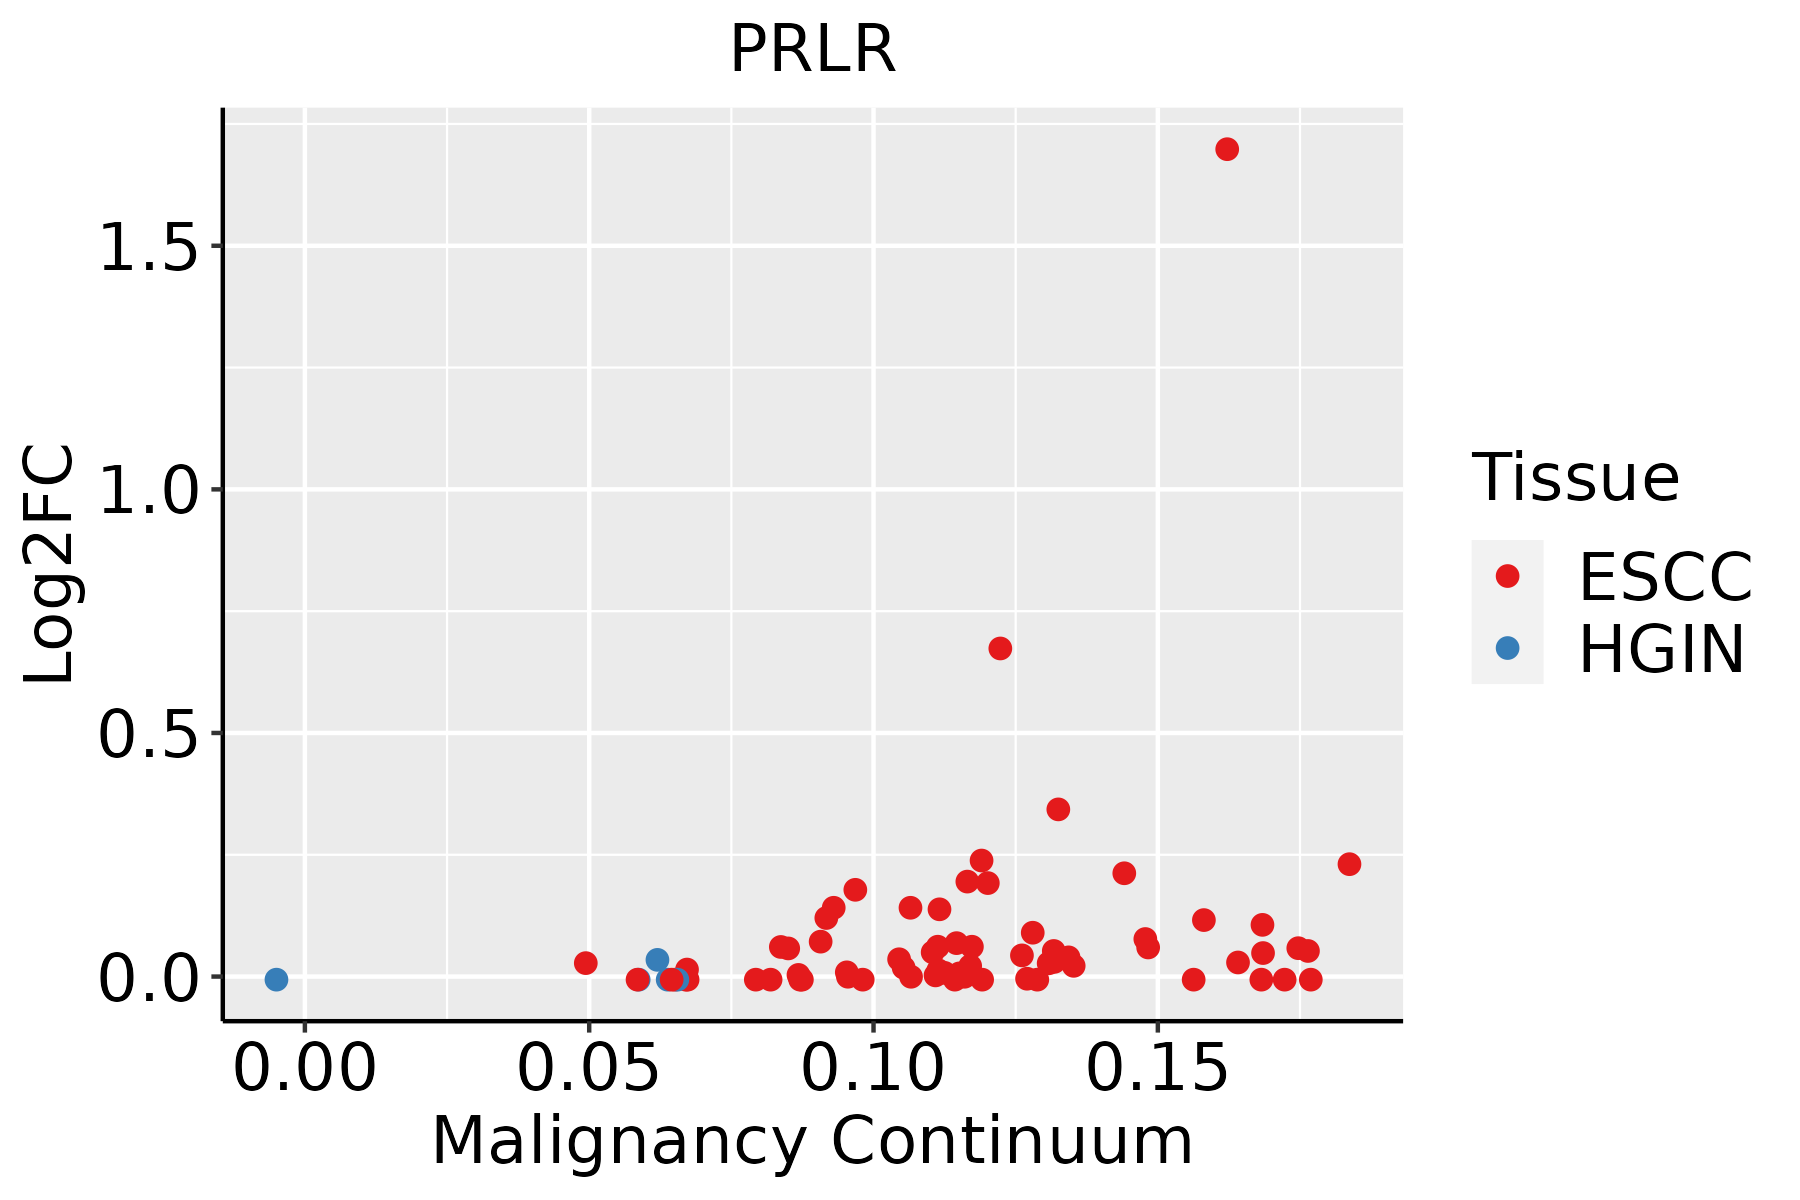
ESCC: Esophageal squamous cell carcinoma
HGIN: High-grade intraepithelial neoplasias
LGIN: Low-grade intraepithelial neoplasias
LiverThe image shows the transcriptomic changes along malignancy continuum.log2FC in expression of this searched gene in stem-like cells from each diseased tissue sample relative to stem-like cells in normal samples in each tissue plotted against the malignancy continuum. Samples are colored based on if they are from different disease stage.
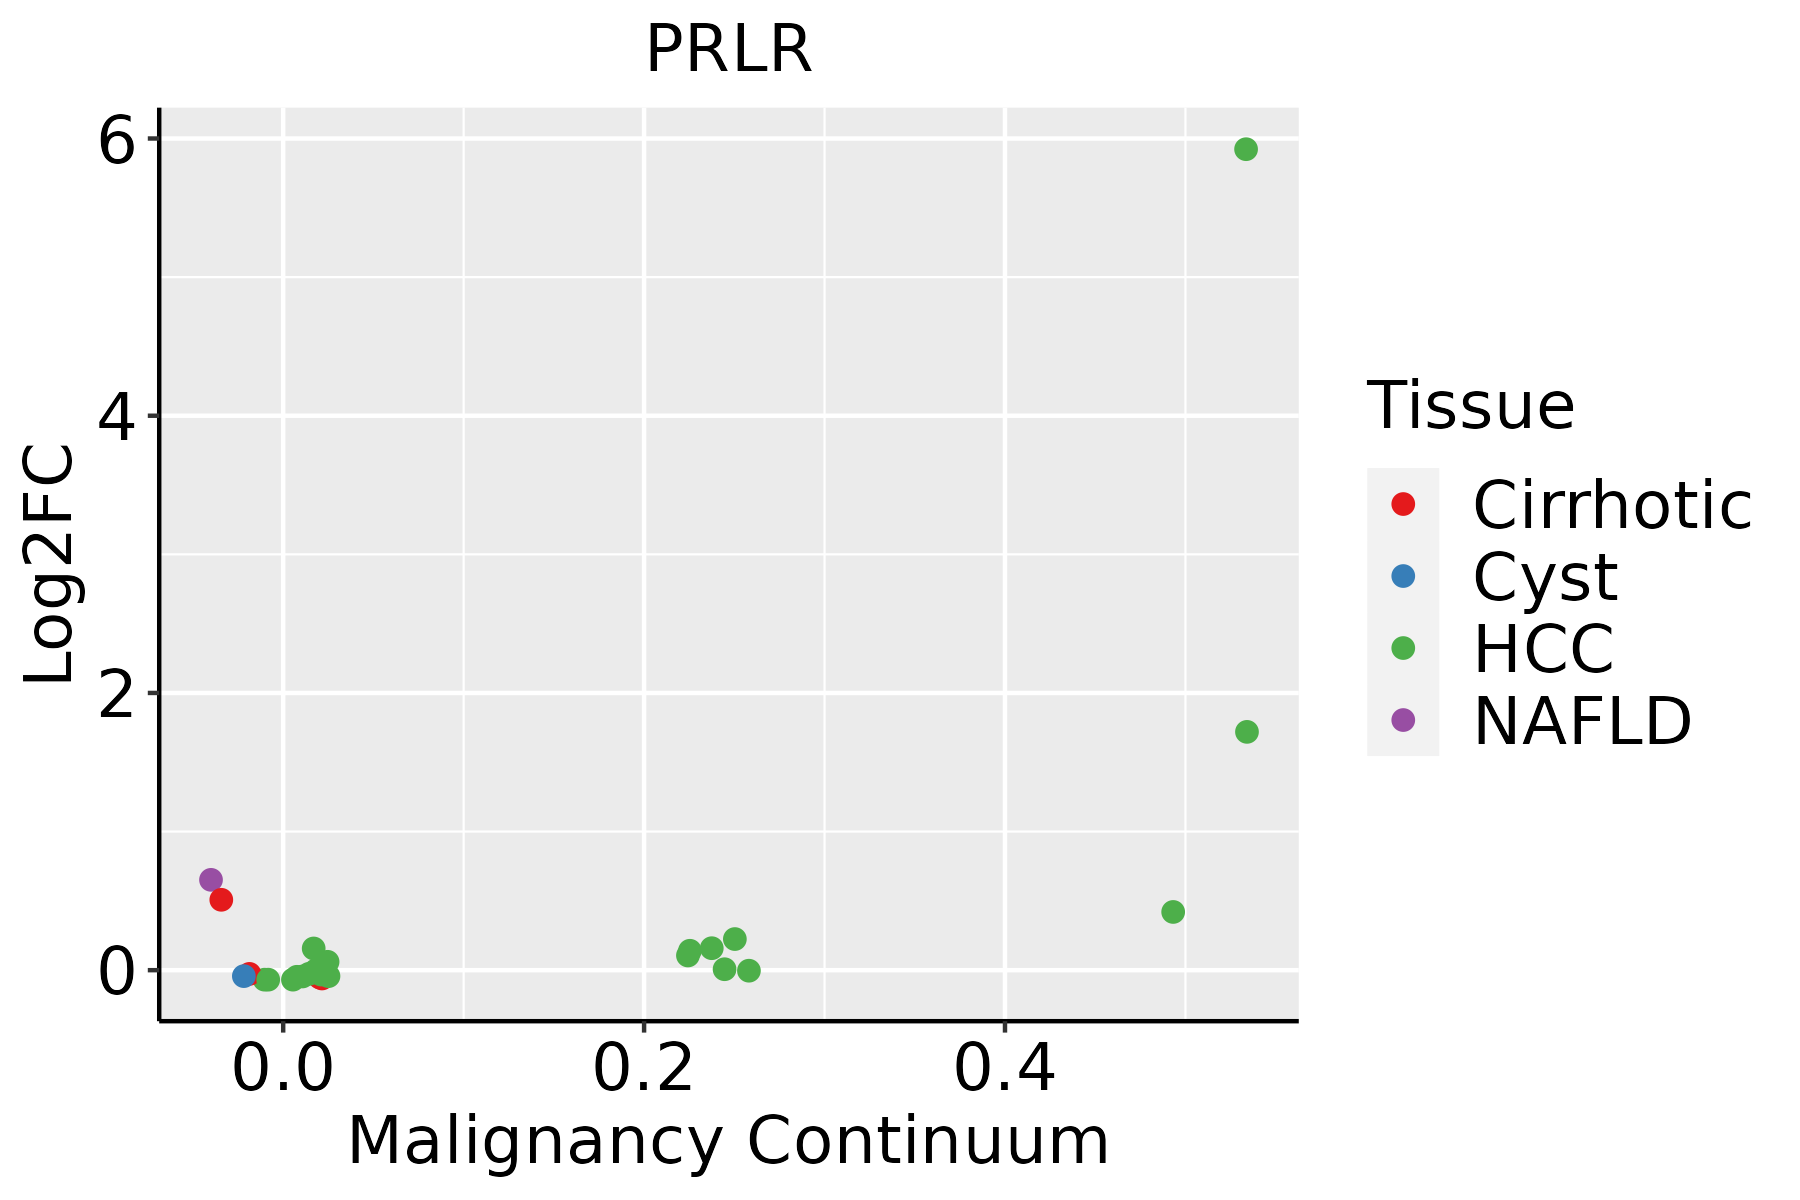
HCC: Hepatocellular carcinoma
NAFLD: Non-alcoholic fatty liver disease
∗log2FC in expression of this searched gene in stem-like cells from each diseased tissue sample relative to stem-like cells in normal samples in each tissue plotted against the malignancy continuum. Samples are colored based on if they are from different disease stage.

Top

Malignant transformation related pathway analysis

check buttonFind out the enriched GO biological processes and KEGG pathways involved in transition from healthy to precancer to cancer
check button Figure of enriched GO biological processes.
TissueDisease StageEnriched GO biological Processes
ColorectumADGO analysis - Figure of enriched GO biological processes: Top 15 enriched GO BP terms are showed in the bar plot of each disease state in each tissue. Each row represents a significant GO biological process which is colored according to the -log10(p.adjust).
ColorectumSERGO analysis - Figure of enriched GO biological processes: Top 15 enriched GO BP terms are showed in the bar plot of each disease state in each tissue. Each row represents a significant GO biological process which is colored according to the -log10(p.adjust).
ColorectumMSSGO analysis - Figure of enriched GO biological processes: Top 15 enriched GO BP terms are showed in the bar plot of each disease state in each tissue. Each row represents a significant GO biological process which is colored according to the -log10(p.adjust).
ColorectumMSI-HGO analysis - Figure of enriched GO biological processes: Top 15 enriched GO BP terms are showed in the bar plot of each disease state in each tissue. Each row represents a significant GO biological process which is colored according to the -log10(p.adjust).
ColorectumFAPGO analysis - Figure of enriched GO biological processes: Top 15 enriched GO BP terms are showed in the bar plot of each disease state in each tissue. Each row represents a significant GO biological process which is colored according to the -log10(p.adjust).
∗Top 15 enriched GO BP terms are showed in the bar plot of each disease state in each tissue. Each row represents a significant GO biological process which is colored according to the -log10(p.adjust).
Page: 1 2 3 4 5 6 7 8 9 

check button Enriched GO biological processes.
GO IDTissueDisease StageDescriptionGene RatioBg Ratiopvaluep.adjustCount
GO:000756511BreastIDCfemale pregnancy39/1434193/187231.81e-081.27e-0639
GO:00447061BreastIDCmulti-multicellular organism process41/1434220/187238.58e-085.19e-0641
GO:004873214BreastIDCgland development64/1434436/187233.47e-071.74e-0564
GO:000756611BreastIDCembryo implantation14/143453/187233.14e-057.32e-0414
GO:005087813BreastIDCregulation of body fluid levels50/1434379/187231.12e-042.10e-0350
GO:003087911BreastIDCmammary gland development23/1434137/187232.87e-044.37e-0323
GO:00066944BreastIDCsteroid biosynthetic process25/1434173/187231.56e-031.56e-0225
GO:00075652BreastDCISfemale pregnancy37/1390193/187237.85e-084.47e-0637
GO:00447062BreastDCISmulti-multicellular organism process39/1390220/187233.05e-071.46e-0539
GO:004873223BreastDCISgland development60/1390436/187232.50e-068.74e-0560
GO:005087823BreastDCISregulation of body fluid levels50/1390379/187235.17e-051.06e-0350
GO:00075662BreastDCISembryo implantation13/139053/187231.00e-041.82e-0313
GO:003087921BreastDCISmammary gland development22/1390137/187234.74e-046.24e-0322
GO:000669411BreastDCISsteroid biosynthetic process23/1390173/187234.63e-033.52e-0223
GO:00075952BreastDCISlactation9/139047/187236.96e-034.78e-029
GO:0048732ColorectumADgland development149/3918436/187236.07e-116.33e-09149
GO:0030879ColorectumADmammary gland development53/3918137/187231.46e-064.58e-0553
GO:0009755ColorectumADhormone-mediated signaling pathway64/3918190/187232.78e-055.24e-0464
GO:0033674ColorectumADpositive regulation of kinase activity131/3918467/187231.28e-041.85e-03131
GO:0050878ColorectumADregulation of body fluid levels108/3918379/187232.54e-043.20e-03108
Page: 1 2 3 4 5 6 

check button Enriched KEGG pathways.
Pathway IDTissueDisease StageDescriptionGene RatioBg Ratiopvaluep.adjustqvalueCount
hsa04151ColorectumFAPPI3K-Akt signaling pathway75/1404354/84651.23e-024.19e-022.55e-0275
hsa041511ColorectumFAPPI3K-Akt signaling pathway75/1404354/84651.23e-024.19e-022.55e-0275
hsa041512ColorectumCRCPI3K-Akt signaling pathway64/1091354/84652.70e-031.77e-021.20e-0264
hsa041513ColorectumCRCPI3K-Akt signaling pathway64/1091354/84652.70e-031.77e-021.20e-0264
hsa041517EsophagusESCCPI3K-Akt signaling pathway197/4205354/84651.24e-022.83e-021.45e-02197
hsa0415114EsophagusESCCPI3K-Akt signaling pathway197/4205354/84651.24e-022.83e-021.45e-02197
hsa04917LiverHCCProlactin signaling pathway43/402070/84651.30e-023.19e-021.78e-0243
hsa049171LiverHCCProlactin signaling pathway43/402070/84651.30e-023.19e-021.78e-0243
Page: 1 

Top

Cell-cell communication analysis

check buttonIdentification of potential cell-cell interactions between two cell types and their ligand-receptor pairs for different disease states
LigandReceptorLRpairPathwayTissueDisease Stage
Page: 1 

Top

Single-cell gene regulatory network inference analysis

check buttonFind out the significant the regulons (TFs) and the target genes of each regulon across cell types for different disease states
TFCell TypeTissueDisease StageTarget GeneRSSRegulon Activity
∗The dot plots of a searched regulon are shown for all cell subpopulations in each disease state of each tissue based on the regulon specific score inferred using pySCENIC and by calculating the average expression.
Page: 1 

Top

Somatic mutation of malignant transformation related genes

check buttonAnnotation of somatic variants for genes involved in malignant transformation
Hugo SymbolVariant ClassVariant ClassificationdbSNP RSHGVScHGVSpHGVSp ShortSWISSPROTBIOTYPESIFTPolyPhenTumor Sample BarcodeTissueHistologySexAgeStageTherapy TypesDrugsOutcome
PRLRSNVMissense_Mutationc.199G>Ap.Glu67Lysp.E67KP16471protein_codingdeleterious(0)probably_damaging(0.929)TCGA-A8-A06R-01Breastbreast invasive carcinomaFemale>=65I/IIChemotherapy5-fluorouracilCR
PRLRSNVMissense_Mutationrs764438076c.253N>Cp.Ser85Prop.S85PP16471protein_codingdeleterious(0)probably_damaging(0.986)TCGA-BH-A1FH-01Breastbreast invasive carcinomaFemale<65III/IVUnknownUnknownPD
PRLRSNVMissense_Mutationc.1465N>Ap.Asp489Asnp.D489NP16471protein_codingtolerated(0.11)benign(0.012)TCGA-D8-A1J8-01Breastbreast invasive carcinomaFemale>=65I/IIHormone TherapynolvadexSD
PRLRSNVMissense_Mutationrs764438076c.253N>Cp.Ser85Prop.S85PP16471protein_codingdeleterious(0)probably_damaging(0.986)TCGA-E2-A1L8-01Breastbreast invasive carcinomaFemale<65I/IIChemotherapycyclophosphamideSD
PRLRSNVMissense_Mutationrs764438076c.253T>Cp.Ser85Prop.S85PP16471protein_codingdeleterious(0)probably_damaging(0.986)TCGA-E9-A1RE-01Breastbreast invasive carcinomaFemale>=65III/IVHormone TherapytamoxiphenSD
PRLRSNVMissense_Mutationrs754093703c.251A>Cp.Asn84Thrp.N84TP16471protein_codingdeleterious(0)probably_damaging(0.956)TCGA-EW-A1PH-01Breastbreast invasive carcinomaFemale<65I/IIChemotherapycyclophosphamideSD
PRLRdeletionFrame_Shift_Delc.466delCp.Leu156Terp.L156*P16471protein_codingTCGA-A2-A25D-01Breastbreast invasive carcinomaFemale>=65III/IVHormone TherapytamoxiphenSD
PRLRinsertionNonsense_Mutationnovelc.1285_1286insAGCp.Ser429delinsTerp.S429delins*P16471protein_codingTCGA-A8-A07J-01Breastbreast invasive carcinomaFemale<65I/IIChemotherapy5-fluorouracilCR
PRLRinsertionFrame_Shift_Insnovelc.1284_1285insCGCATGTTTTACACACTCCTTTCACTGAp.Ser429ArgfsTer16p.S429Rfs*16P16471protein_codingTCGA-A8-A07J-01Breastbreast invasive carcinomaFemale<65I/IIChemotherapy5-fluorouracilCR
PRLRdeletionFrame_Shift_Delnovelc.1079delNp.Leu360CysfsTer38p.L360Cfs*38P16471protein_codingTCGA-AC-A3EH-01Breastbreast invasive carcinomaFemale>=65III/IVUnknownUnknownSD
Page: 1 2 3 4 5 6 7 8 9 10 

Top

Related drugs of malignant transformation related genes

check buttonIdentification of chemicals and drugs interact with genes involved in malignant transfromation
(DGIdb 4.0)
Entrez IDSymbolCategoryInteraction TypesDrug Claim NameDrug NamePMIDs
5618PRLREXTERNAL SIDE OF PLASMA MEMBRANE, CELL SURFACE, DRUGGABLE GENOME, KINASELFA-102
5618PRLREXTERNAL SIDE OF PLASMA MEMBRANE, CELL SURFACE, DRUGGABLE GENOME, KINASESOMATROPINSOMATROPIN
5618PRLREXTERNAL SIDE OF PLASMA MEMBRANE, CELL SURFACE, DRUGGABLE GENOME, KINASEDHTANDROSTANOLONE1544711
5618PRLREXTERNAL SIDE OF PLASMA MEMBRANE, CELL SURFACE, DRUGGABLE GENOME, KINASESOMATROPIN RECOMBINANT
5618PRLREXTERNAL SIDE OF PLASMA MEMBRANE, CELL SURFACE, DRUGGABLE GENOME, KINASEagonist178101594
5618PRLREXTERNAL SIDE OF PLASMA MEMBRANE, CELL SURFACE, DRUGGABLE GENOME, KINASEProlanta
5618PRLREXTERNAL SIDE OF PLASMA MEMBRANE, CELL SURFACE, DRUGGABLE GENOME, KINASEEndostatinENDOSTATIN
5618PRLREXTERNAL SIDE OF PLASMA MEMBRANE, CELL SURFACE, DRUGGABLE GENOME, KINASEagonist178101593
Page: 1