| Tissue | Expression Dynamics | Abbreviation |
| Endometrium |  | AEH: Atypical endometrial hyperplasia |
| EEC: Endometrioid Cancer |
| Esophagus | 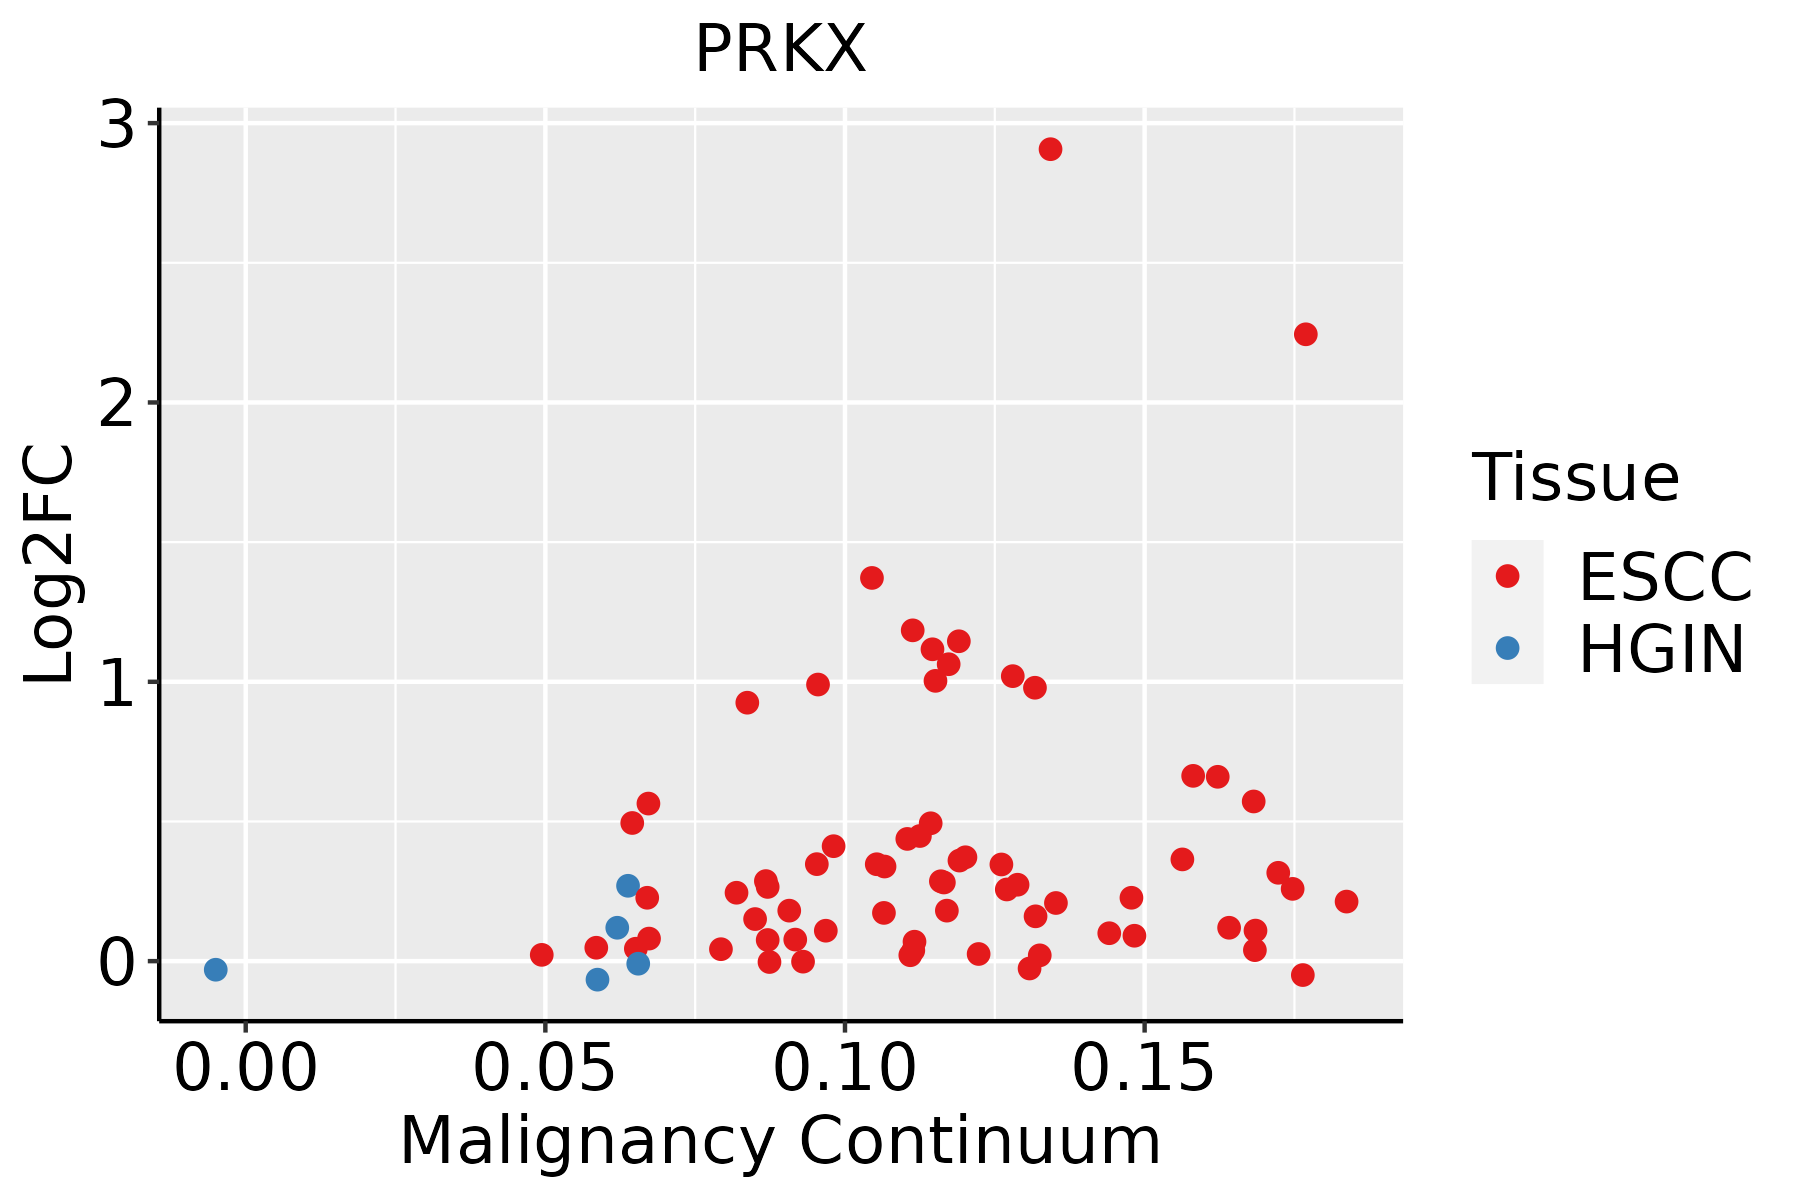 | ESCC: Esophageal squamous cell carcinoma |
| HGIN: High-grade intraepithelial neoplasias |
| LGIN: Low-grade intraepithelial neoplasias |
| Liver |  | HCC: Hepatocellular carcinoma |
| NAFLD: Non-alcoholic fatty liver disease |
| Oral Cavity | 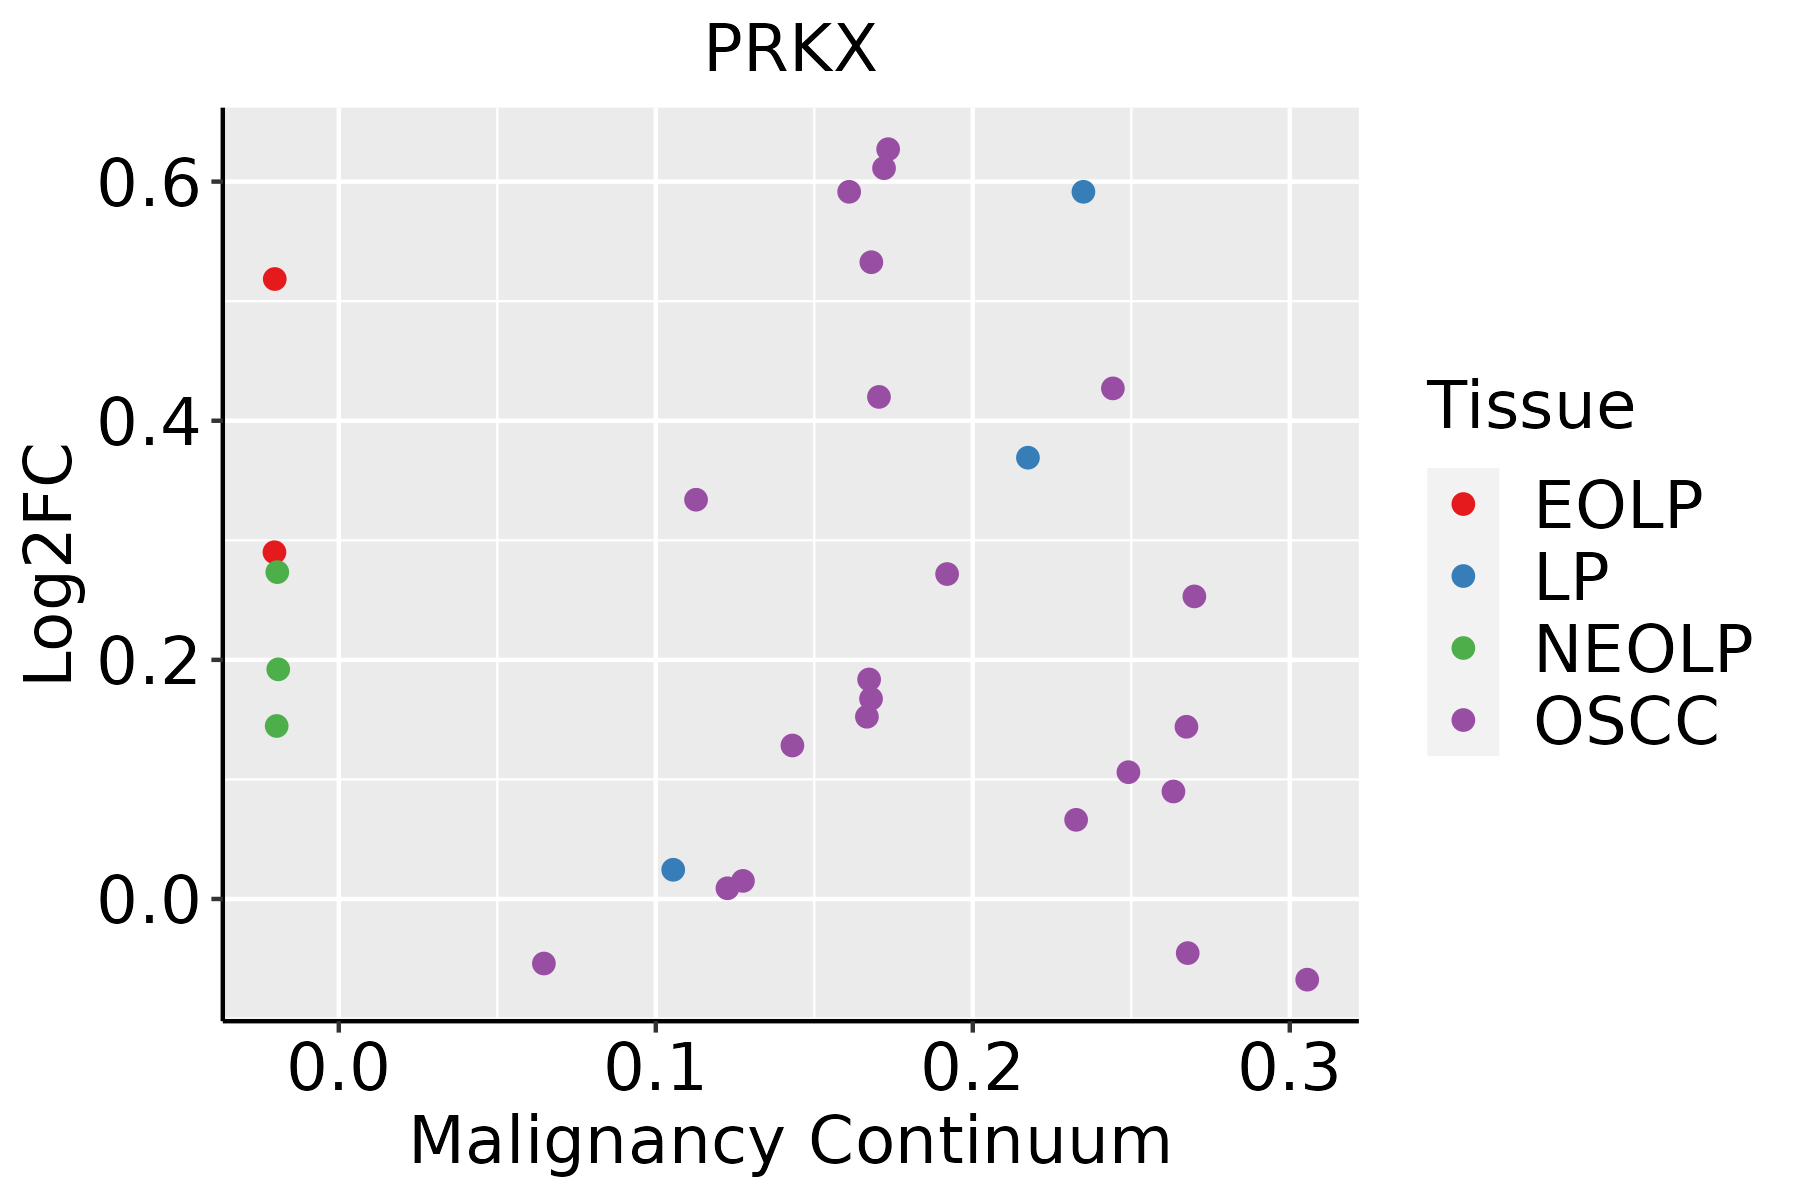 | EOLP: Erosive Oral lichen planus |
| LP: leukoplakia |
| NEOLP: Non-erosive oral lichen planus |
| OSCC: Oral squamous cell carcinoma |
| Thyroid | 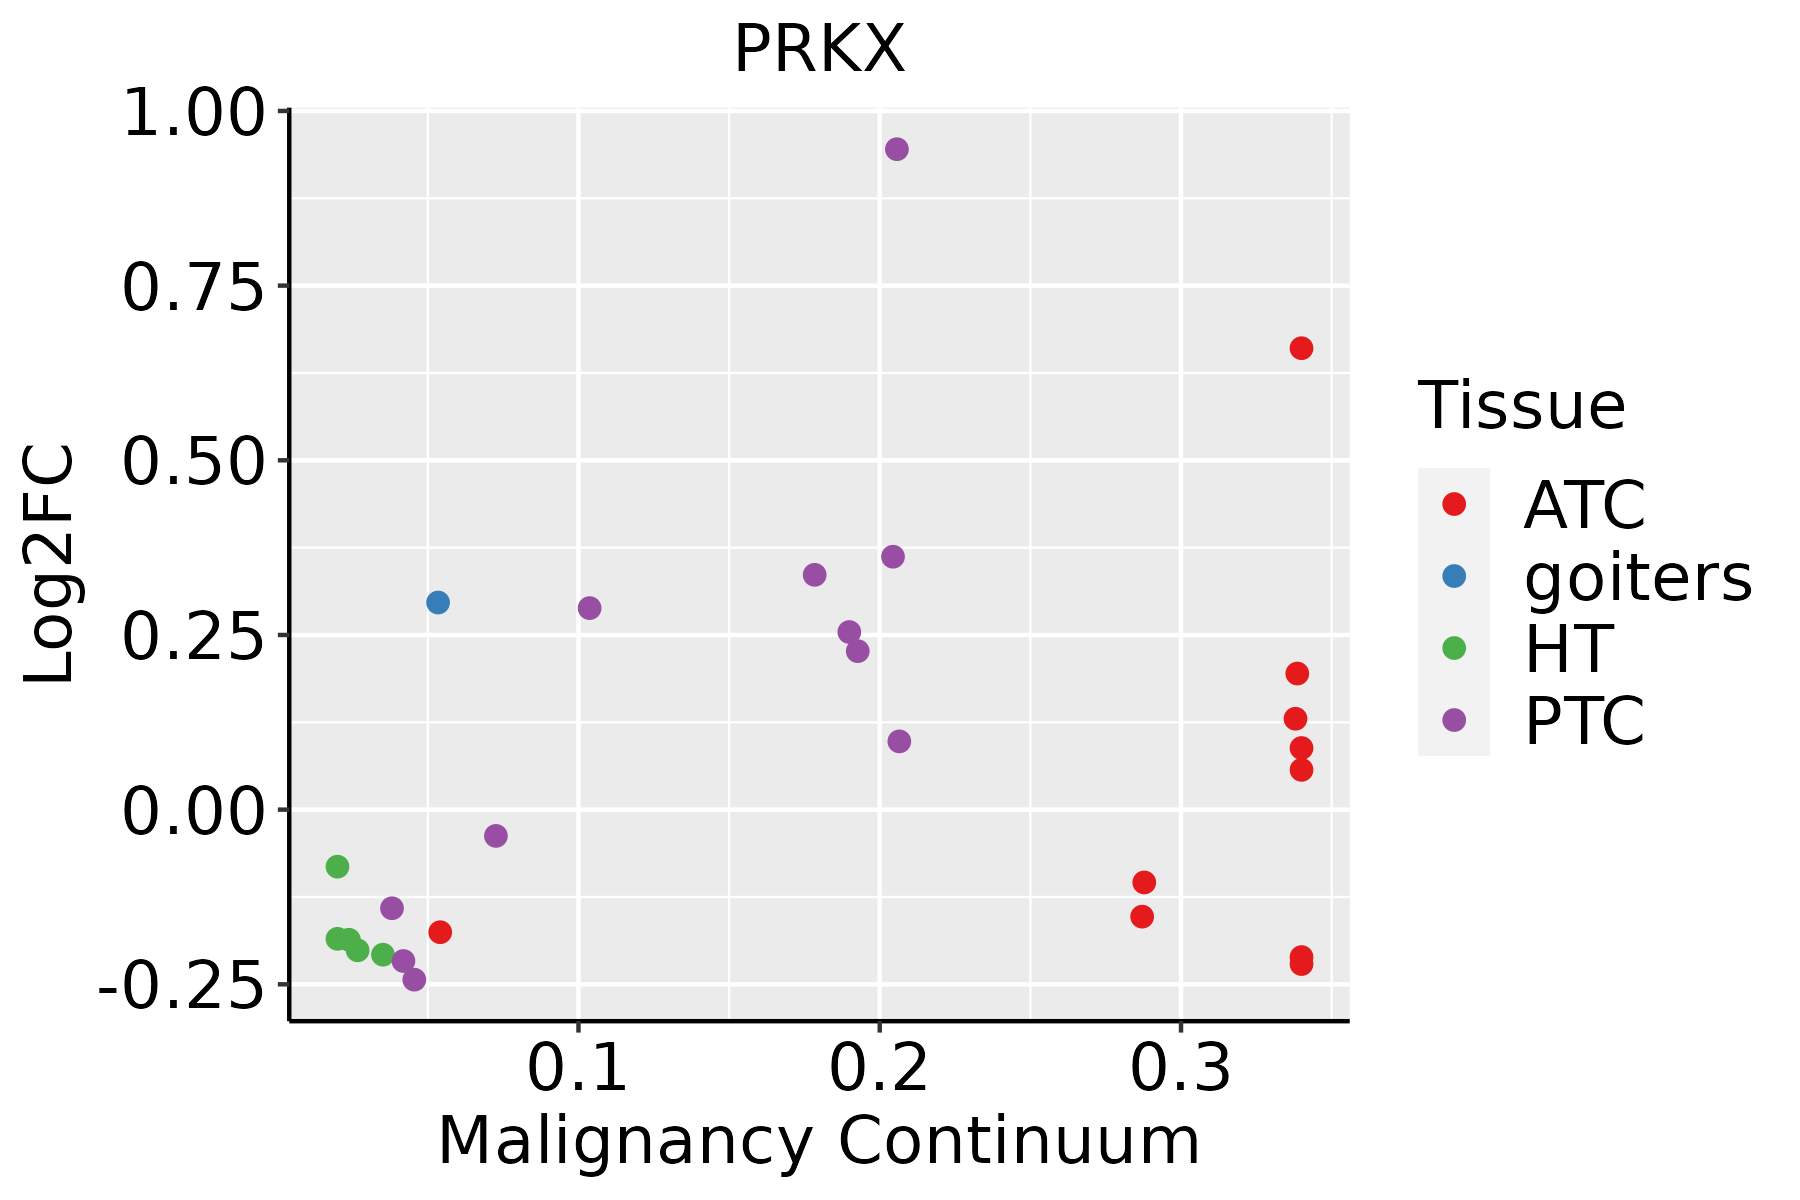 | ATC: Anaplastic thyroid cancer |
| HT: Hashimoto's thyroiditis |
| PTC: Papillary thyroid cancer |
| GO ID | Tissue | Disease Stage | Description | Gene Ratio | Bg Ratio | pvalue | p.adjust | Count |
| GO:00315899 | Endometrium | AEH | cell-substrate adhesion | 87/2100 | 363/18723 | 3.51e-12 | 5.70e-10 | 87 |
| GO:000166710 | Endometrium | AEH | ameboidal-type cell migration | 90/2100 | 475/18723 | 3.73e-07 | 1.57e-05 | 90 |
| GO:00506738 | Endometrium | AEH | epithelial cell proliferation | 84/2100 | 437/18723 | 4.88e-07 | 1.94e-05 | 84 |
| GO:009013014 | Endometrium | AEH | tissue migration | 73/2100 | 365/18723 | 5.79e-07 | 2.20e-05 | 73 |
| GO:009013214 | Endometrium | AEH | epithelium migration | 72/2100 | 360/18723 | 6.90e-07 | 2.55e-05 | 72 |
| GO:001063114 | Endometrium | AEH | epithelial cell migration | 71/2100 | 357/18723 | 1.02e-06 | 3.52e-05 | 71 |
| GO:00016556 | Endometrium | AEH | urogenital system development | 67/2100 | 338/18723 | 2.30e-06 | 6.76e-05 | 67 |
| GO:00720015 | Endometrium | AEH | renal system development | 61/2100 | 302/18723 | 3.43e-06 | 9.24e-05 | 61 |
| GO:00605627 | Endometrium | AEH | epithelial tube morphogenesis | 63/2100 | 325/18723 | 9.63e-06 | 2.23e-04 | 63 |
| GO:00435428 | Endometrium | AEH | endothelial cell migration | 55/2100 | 279/18723 | 2.11e-05 | 4.15e-04 | 55 |
| GO:00018224 | Endometrium | AEH | kidney development | 57/2100 | 293/18723 | 2.25e-05 | 4.35e-04 | 57 |
| GO:00609932 | Endometrium | AEH | kidney morphogenesis | 24/2100 | 93/18723 | 6.73e-05 | 1.04e-03 | 24 |
| GO:00308564 | Endometrium | AEH | regulation of epithelial cell differentiation | 33/2100 | 154/18723 | 1.81e-04 | 2.32e-03 | 33 |
| GO:00610052 | Endometrium | AEH | cell differentiation involved in kidney development | 15/2100 | 57/18723 | 1.20e-03 | 1.04e-02 | 15 |
| GO:00358504 | Endometrium | AEH | epithelial cell differentiation involved in kidney development | 13/2100 | 47/18723 | 1.53e-03 | 1.26e-02 | 13 |
| GO:2000696 | Endometrium | AEH | regulation of epithelial cell differentiation involved in kidney development | 7/2100 | 17/18723 | 1.55e-03 | 1.27e-02 | 7 |
| GO:003009916 | Endometrium | AEH | myeloid cell differentiation | 62/2100 | 381/18723 | 1.67e-03 | 1.36e-02 | 62 |
| GO:00181058 | Endometrium | AEH | peptidyl-serine phosphorylation | 50/2100 | 315/18723 | 7.20e-03 | 4.13e-02 | 50 |
| GO:0001935 | Endometrium | AEH | endothelial cell proliferation | 33/2100 | 193/18723 | 8.99e-03 | 4.87e-02 | 33 |
| GO:003158915 | Endometrium | EEC | cell-substrate adhesion | 87/2168 | 363/18723 | 1.95e-11 | 3.00e-09 | 87 |
| Hugo Symbol | Variant Class | Variant Classification | dbSNP RS | HGVSc | HGVSp | HGVSp Short | SWISSPROT | BIOTYPE | SIFT | PolyPhen | Tumor Sample Barcode | Tissue | Histology | Sex | Age | Stage | Therapy Types | Drugs | Outcome |
| PRKX | SNV | Missense_Mutation | | c.844N>A | p.Asp282Asn | p.D282N | P51817 | protein_coding | deleterious(0) | probably_damaging(1) | TCGA-AC-A23H-01 | Breast | breast invasive carcinoma | Female | >=65 | I/II | Unknown | Unknown | PD |
| PRKX | SNV | Missense_Mutation | | c.769C>A | p.Leu257Ile | p.L257I | P51817 | protein_coding | tolerated(0.08) | probably_damaging(0.999) | TCGA-AN-A046-01 | Breast | breast invasive carcinoma | Female | >=65 | I/II | Unknown | Unknown | SD |
| PRKX | SNV | Missense_Mutation | | c.178N>G | p.Phe60Val | p.F60V | P51817 | protein_coding | deleterious(0) | probably_damaging(0.974) | TCGA-B6-A0X1-01 | Breast | breast invasive carcinoma | Female | <65 | I/II | Unknown | Unknown | PD |
| PRKX | SNV | Missense_Mutation | rs141998823 | c.910N>T | p.Arg304Cys | p.R304C | P51817 | protein_coding | deleterious(0.01) | possibly_damaging(0.794) | TCGA-BH-A0EE-01 | Breast | breast invasive carcinoma | Female | >=65 | I/II | Chemotherapy | docetaxel | SD |
| PRKX | SNV | Missense_Mutation | | c.769N>A | p.Leu257Ile | p.L257I | P51817 | protein_coding | tolerated(0.08) | probably_damaging(0.999) | TCGA-BH-A201-01 | Breast | breast invasive carcinoma | Female | <65 | I/II | Unknown | Unknown | SD |
| PRKX | SNV | Missense_Mutation | rs770062921 | c.481G>A | p.Glu161Lys | p.E161K | P51817 | protein_coding | tolerated(0.06) | probably_damaging(0.91) | TCGA-VS-A959-01 | Cervix | cervical & endocervical cancer | Female | >=65 | I/II | Unknown | Unknown | SD |
| PRKX | SNV | Missense_Mutation | novel | c.250N>A | p.Asp84Asn | p.D84N | P51817 | protein_coding | deleterious(0.02) | probably_damaging(0.936) | TCGA-AA-3947-01 | Colorectum | colon adenocarcinoma | Female | <65 | I/II | Unknown | Unknown | SD |
| PRKX | SNV | Missense_Mutation | novel | c.995A>C | p.Asn332Thr | p.N332T | P51817 | protein_coding | deleterious(0) | possibly_damaging(0.882) | TCGA-A5-A0G1-01 | Endometrium | uterine corpus endometrioid carcinoma | Female | >=65 | I/II | Unknown | Unknown | SD |
| PRKX | SNV | Missense_Mutation | novel | c.385N>A | p.Val129Met | p.V129M | P51817 | protein_coding | deleterious(0) | probably_damaging(0.943) | TCGA-A5-A0G2-01 | Endometrium | uterine corpus endometrioid carcinoma | Female | <65 | III/IV | Unknown | Unknown | SD |
| PRKX | SNV | Missense_Mutation | | c.1000N>A | p.Glu334Lys | p.E334K | P51817 | protein_coding | deleterious(0.01) | benign(0.385) | TCGA-AP-A056-01 | Endometrium | uterine corpus endometrioid carcinoma | Female | <65 | I/II | Unknown | Unknown | SD |
| Entrez ID | Symbol | Category | Interaction Types | Drug Claim Name | Drug Name | PMIDs |
| 5613 | PRKX | DRUGGABLE GENOME, KINASE, ENZYME, SERINE THREONINE KINASE | inhibitor | 178101884 | GSK-690693 | |
| 5613 | PRKX | DRUGGABLE GENOME, KINASE, ENZYME, SERINE THREONINE KINASE | | FASUDIL | FASUDIL | 22257127 |
| 5613 | PRKX | DRUGGABLE GENOME, KINASE, ENZYME, SERINE THREONINE KINASE | | PD-0166285 | PD-0166285 | |
| 5613 | PRKX | DRUGGABLE GENOME, KINASE, ENZYME, SERINE THREONINE KINASE | | GSK-269962A | GSK-269962A | |
| 5613 | PRKX | DRUGGABLE GENOME, KINASE, ENZYME, SERINE THREONINE KINASE | | DOVITINIB | DOVITINIB | |
| 5613 | PRKX | DRUGGABLE GENOME, KINASE, ENZYME, SERINE THREONINE KINASE | | PALBOCICLIB | PALBOCICLIB | |
| 5613 | PRKX | DRUGGABLE GENOME, KINASE, ENZYME, SERINE THREONINE KINASE | | 681640 | CHEMBL379975 | |
| 5613 | PRKX | DRUGGABLE GENOME, KINASE, ENZYME, SERINE THREONINE KINASE | | CENISERTIB | CENISERTIB | |
| 5613 | PRKX | DRUGGABLE GENOME, KINASE, ENZYME, SERINE THREONINE KINASE | | GW843682X | GW843682X | |
| 5613 | PRKX | DRUGGABLE GENOME, KINASE, ENZYME, SERINE THREONINE KINASE | | Y-27632 | Y-27632 | 22257127 |


