| Tissue | Expression Dynamics | Abbreviation |
| Breast | 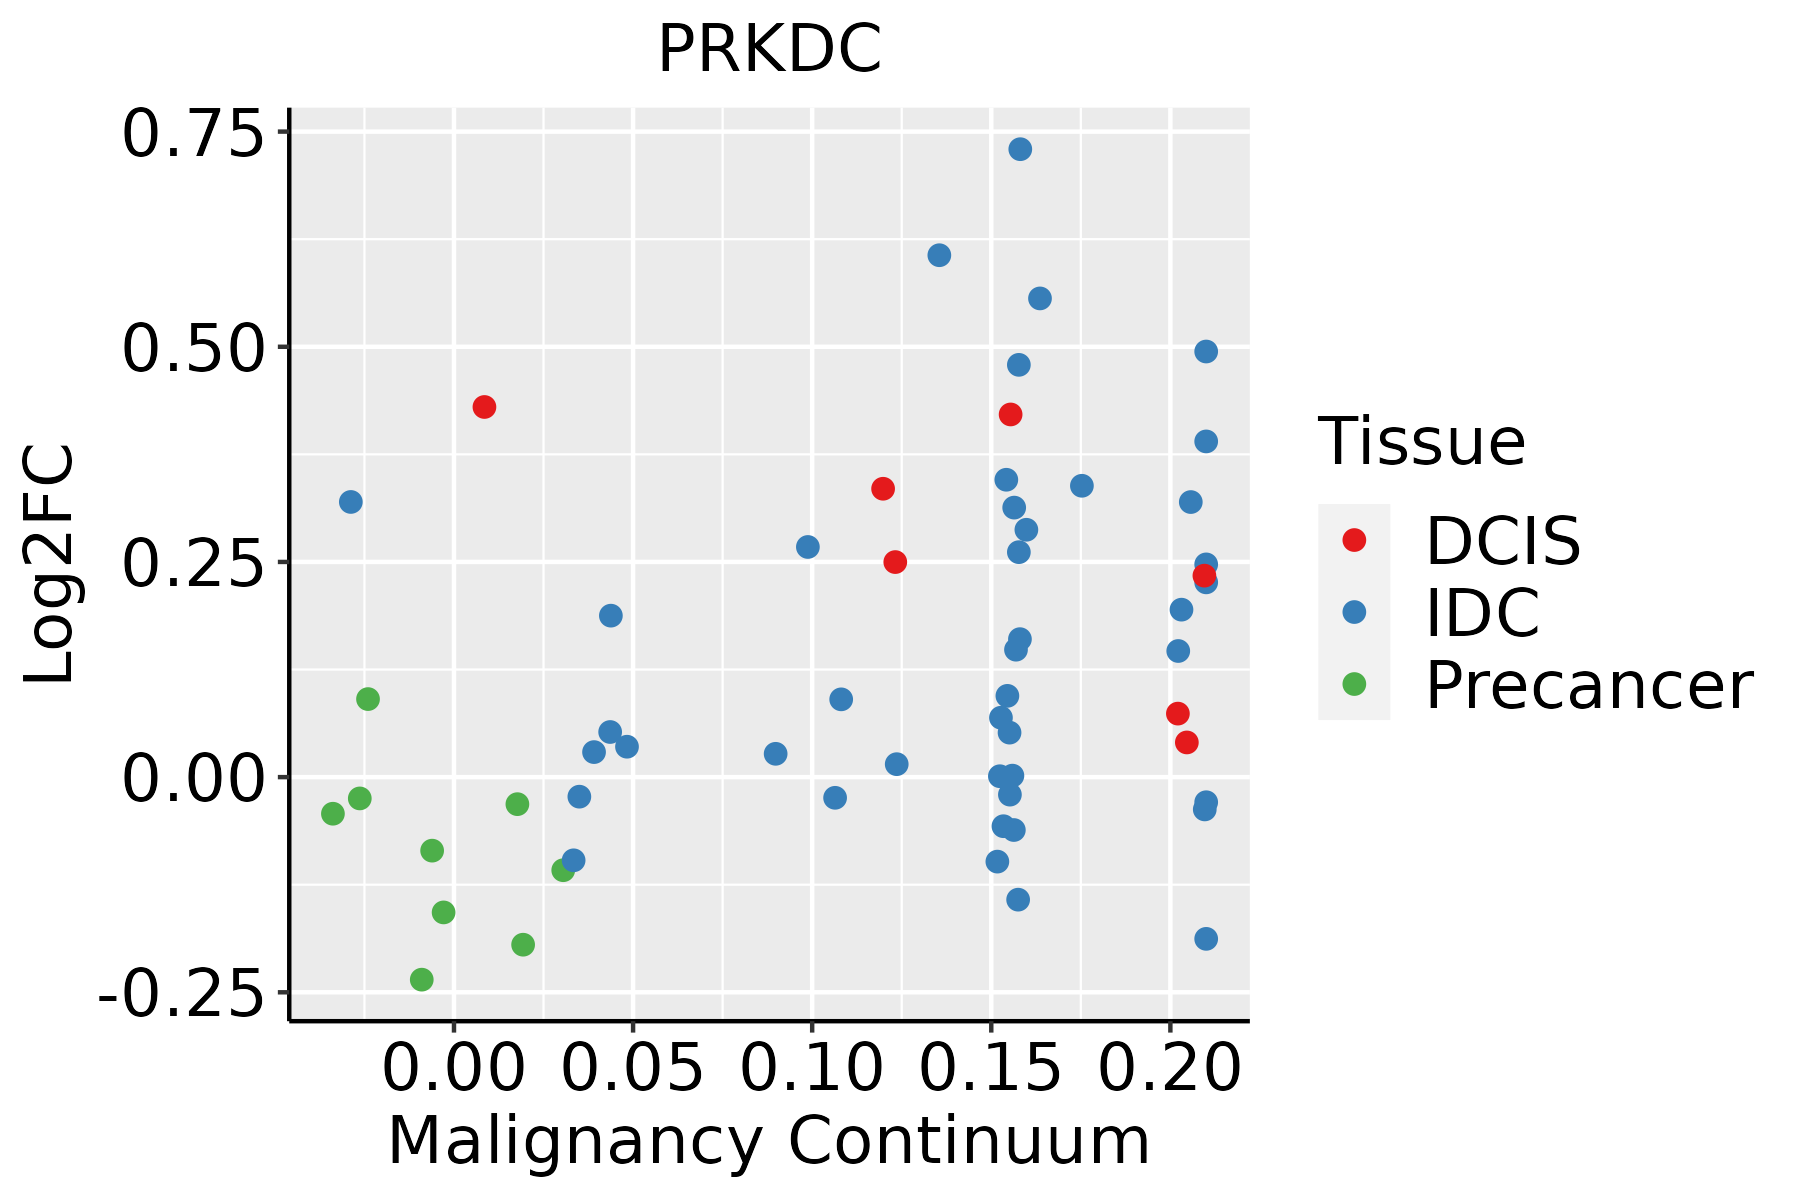 | IDC: Invasive ductal carcinoma |
| DCIS: Ductal carcinoma in situ |
| Precancer(BRCA1-mut): Precancerous lesion from BRCA1 mutation carriers |
| Cervix | 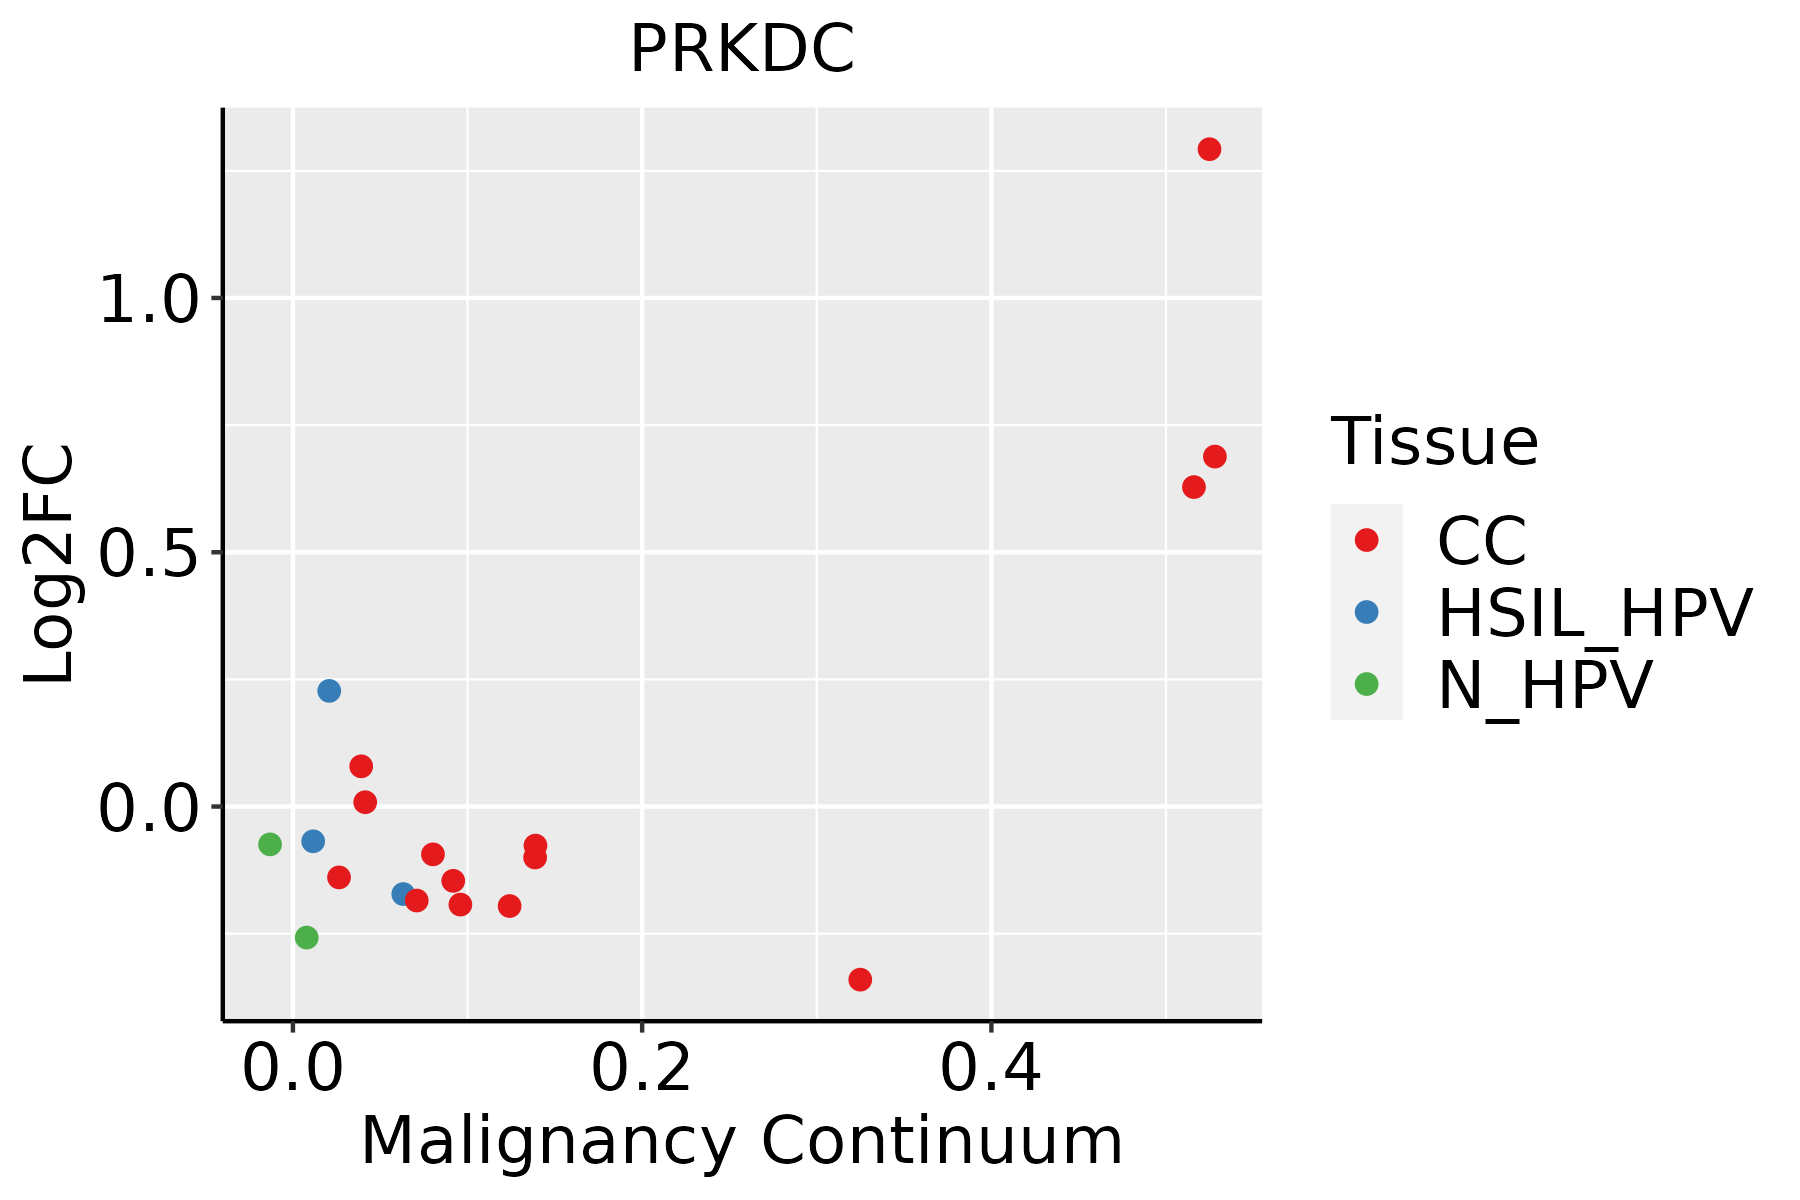 | CC: Cervix cancer |
| HSIL_HPV: HPV-infected high-grade squamous intraepithelial lesions |
| N_HPV: HPV-infected normal cervix |
| Esophagus | 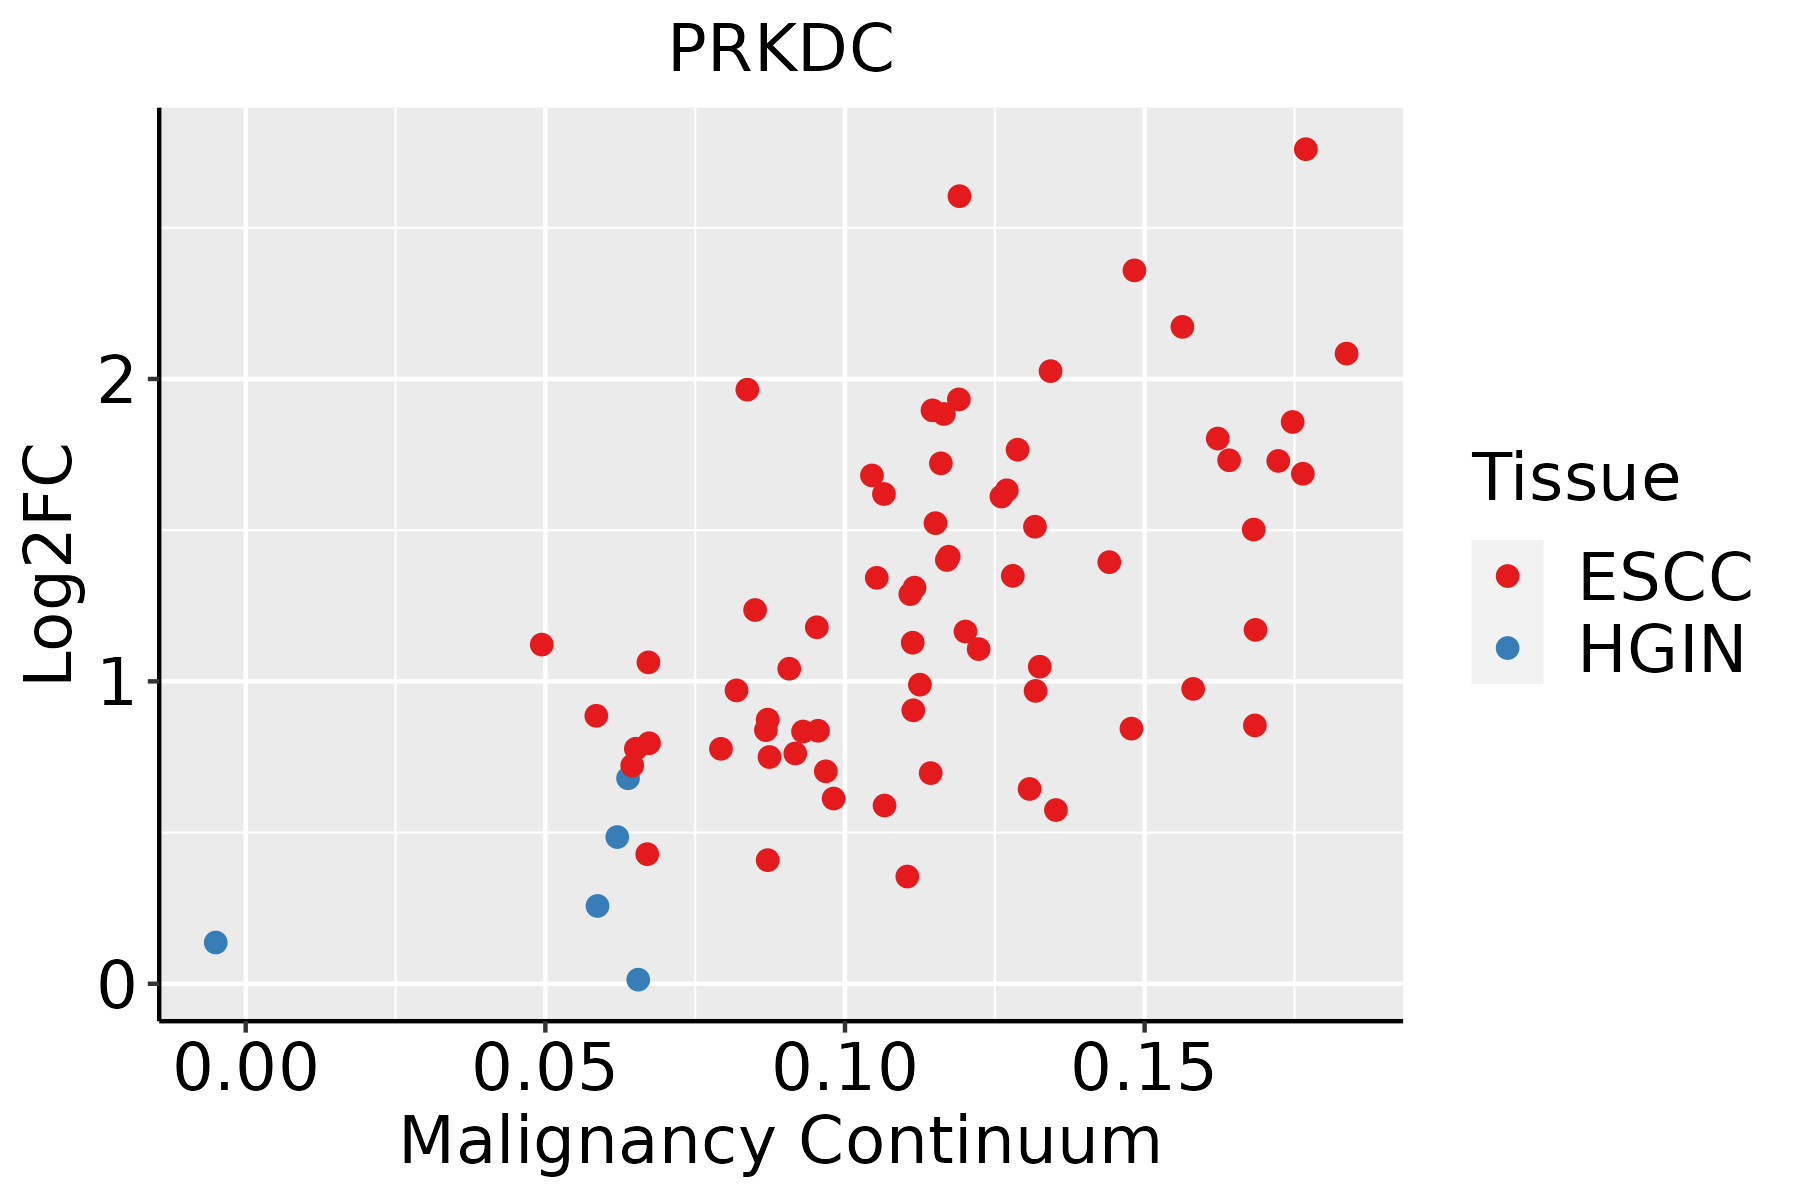 | ESCC: Esophageal squamous cell carcinoma |
| HGIN: High-grade intraepithelial neoplasias |
| LGIN: Low-grade intraepithelial neoplasias |
| Liver |  | HCC: Hepatocellular carcinoma |
| NAFLD: Non-alcoholic fatty liver disease |
| Lung | 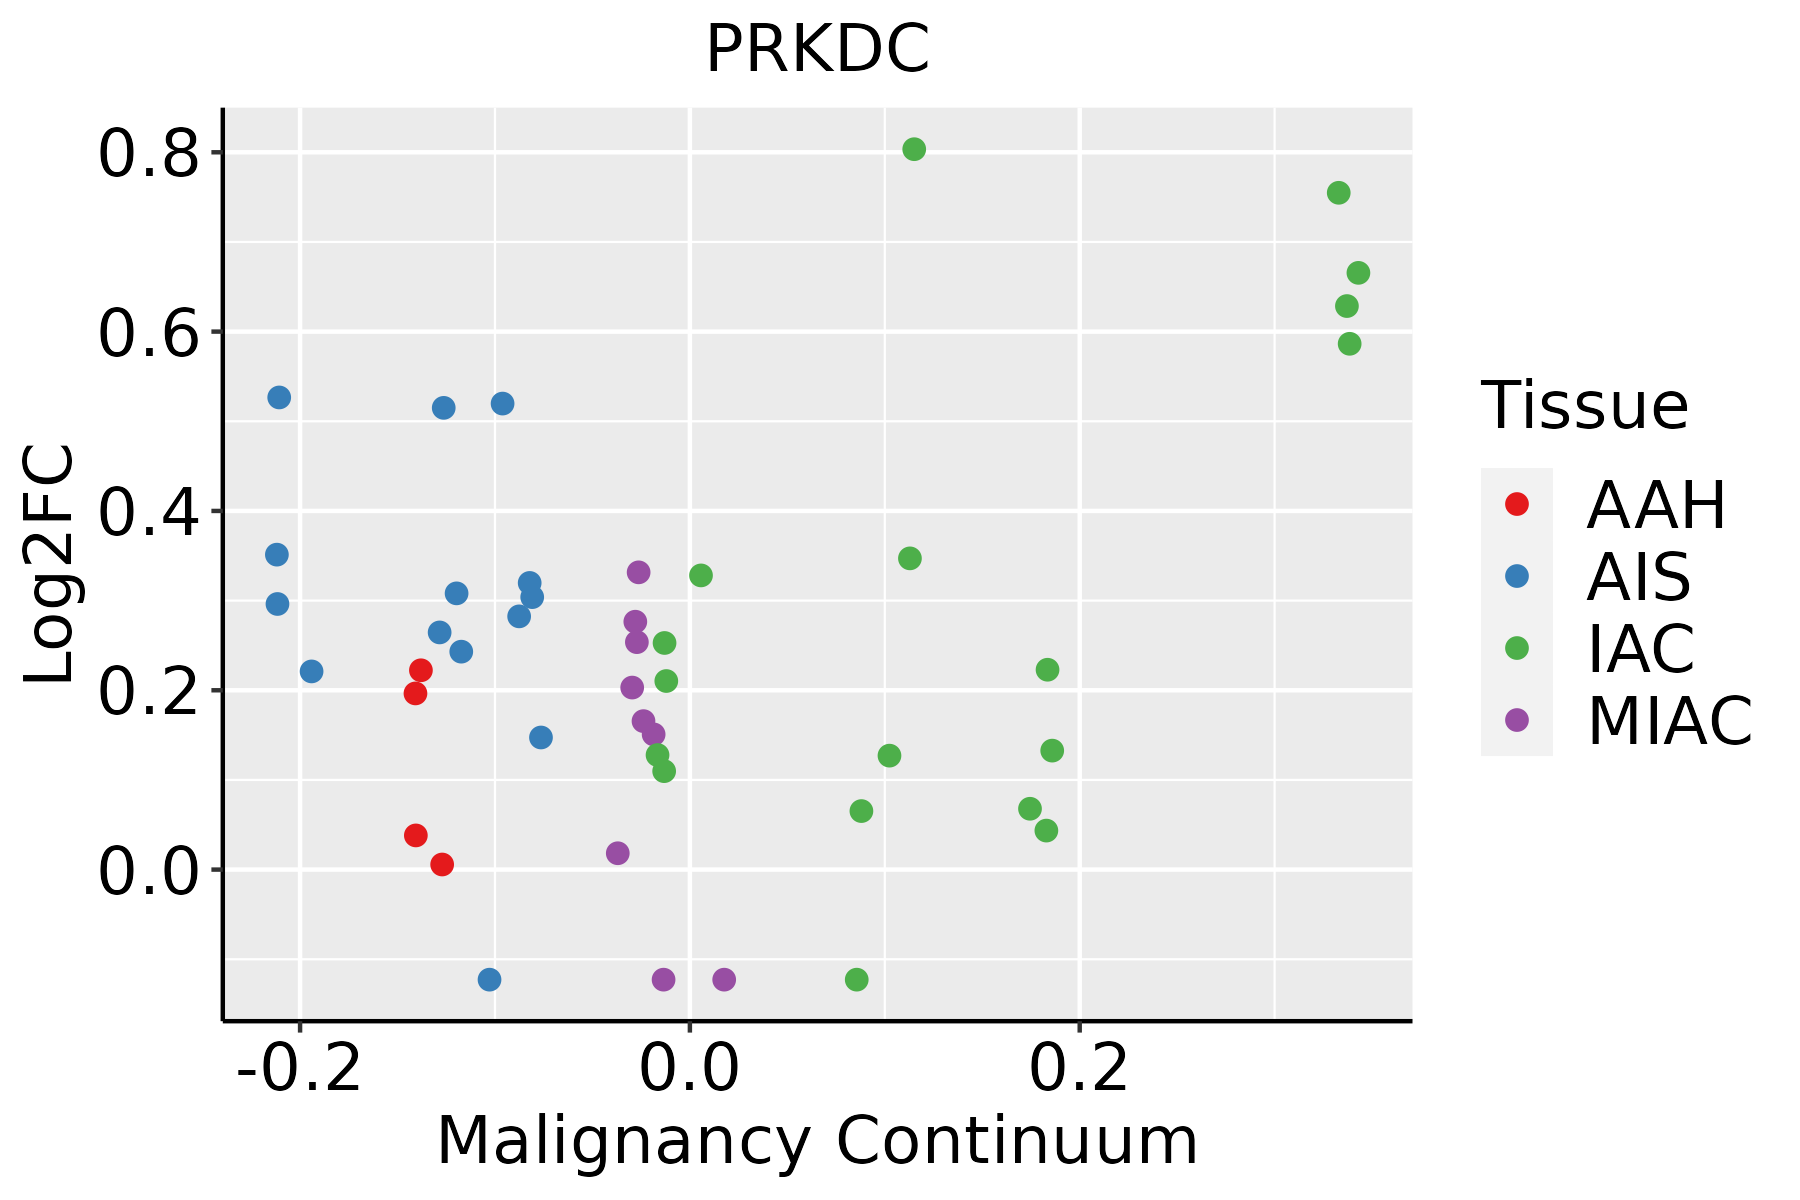 | AAH: Atypical adenomatous hyperplasia |
| AIS: Adenocarcinoma in situ |
| IAC: Invasive lung adenocarcinoma |
| MIA: Minimally invasive adenocarcinoma |
| Oral Cavity | 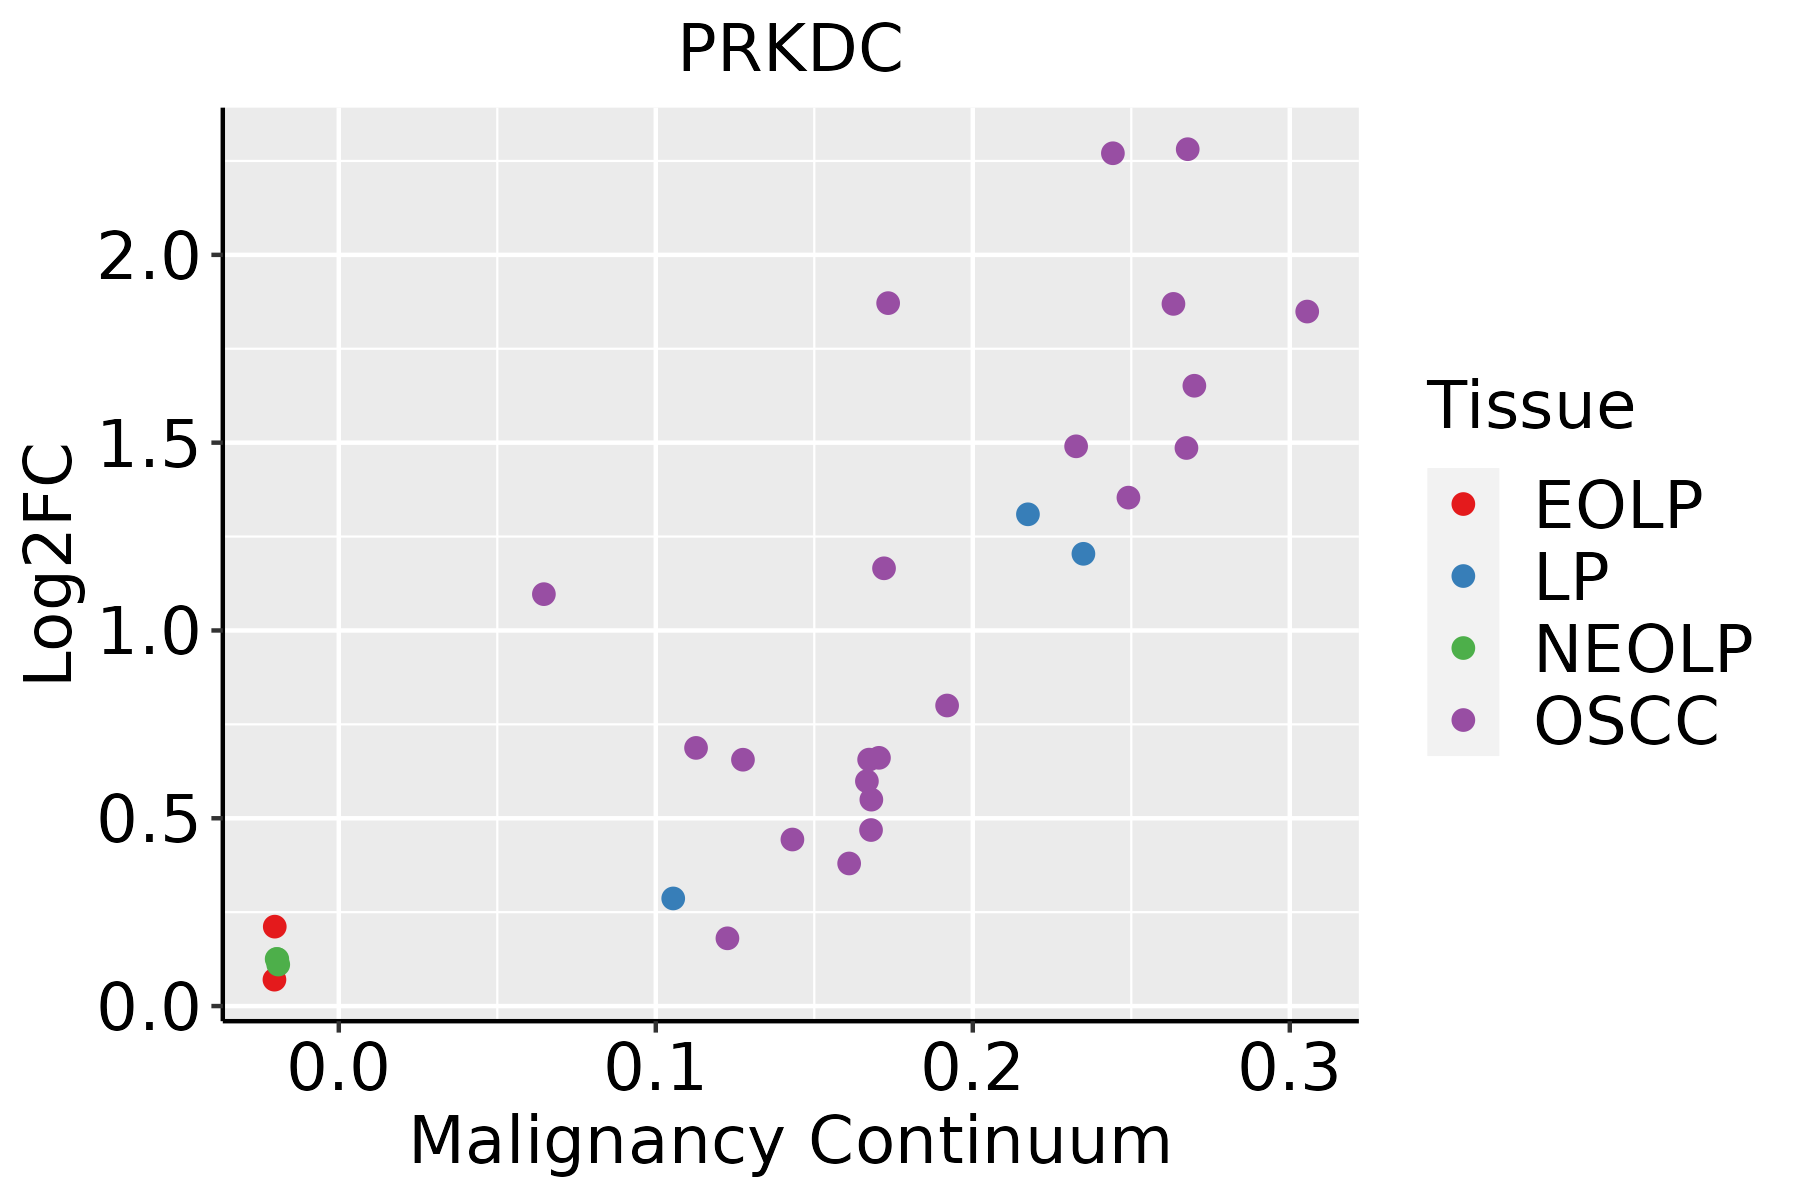 | EOLP: Erosive Oral lichen planus |
| LP: leukoplakia |
| NEOLP: Non-erosive oral lichen planus |
| OSCC: Oral squamous cell carcinoma |
| Prostate | 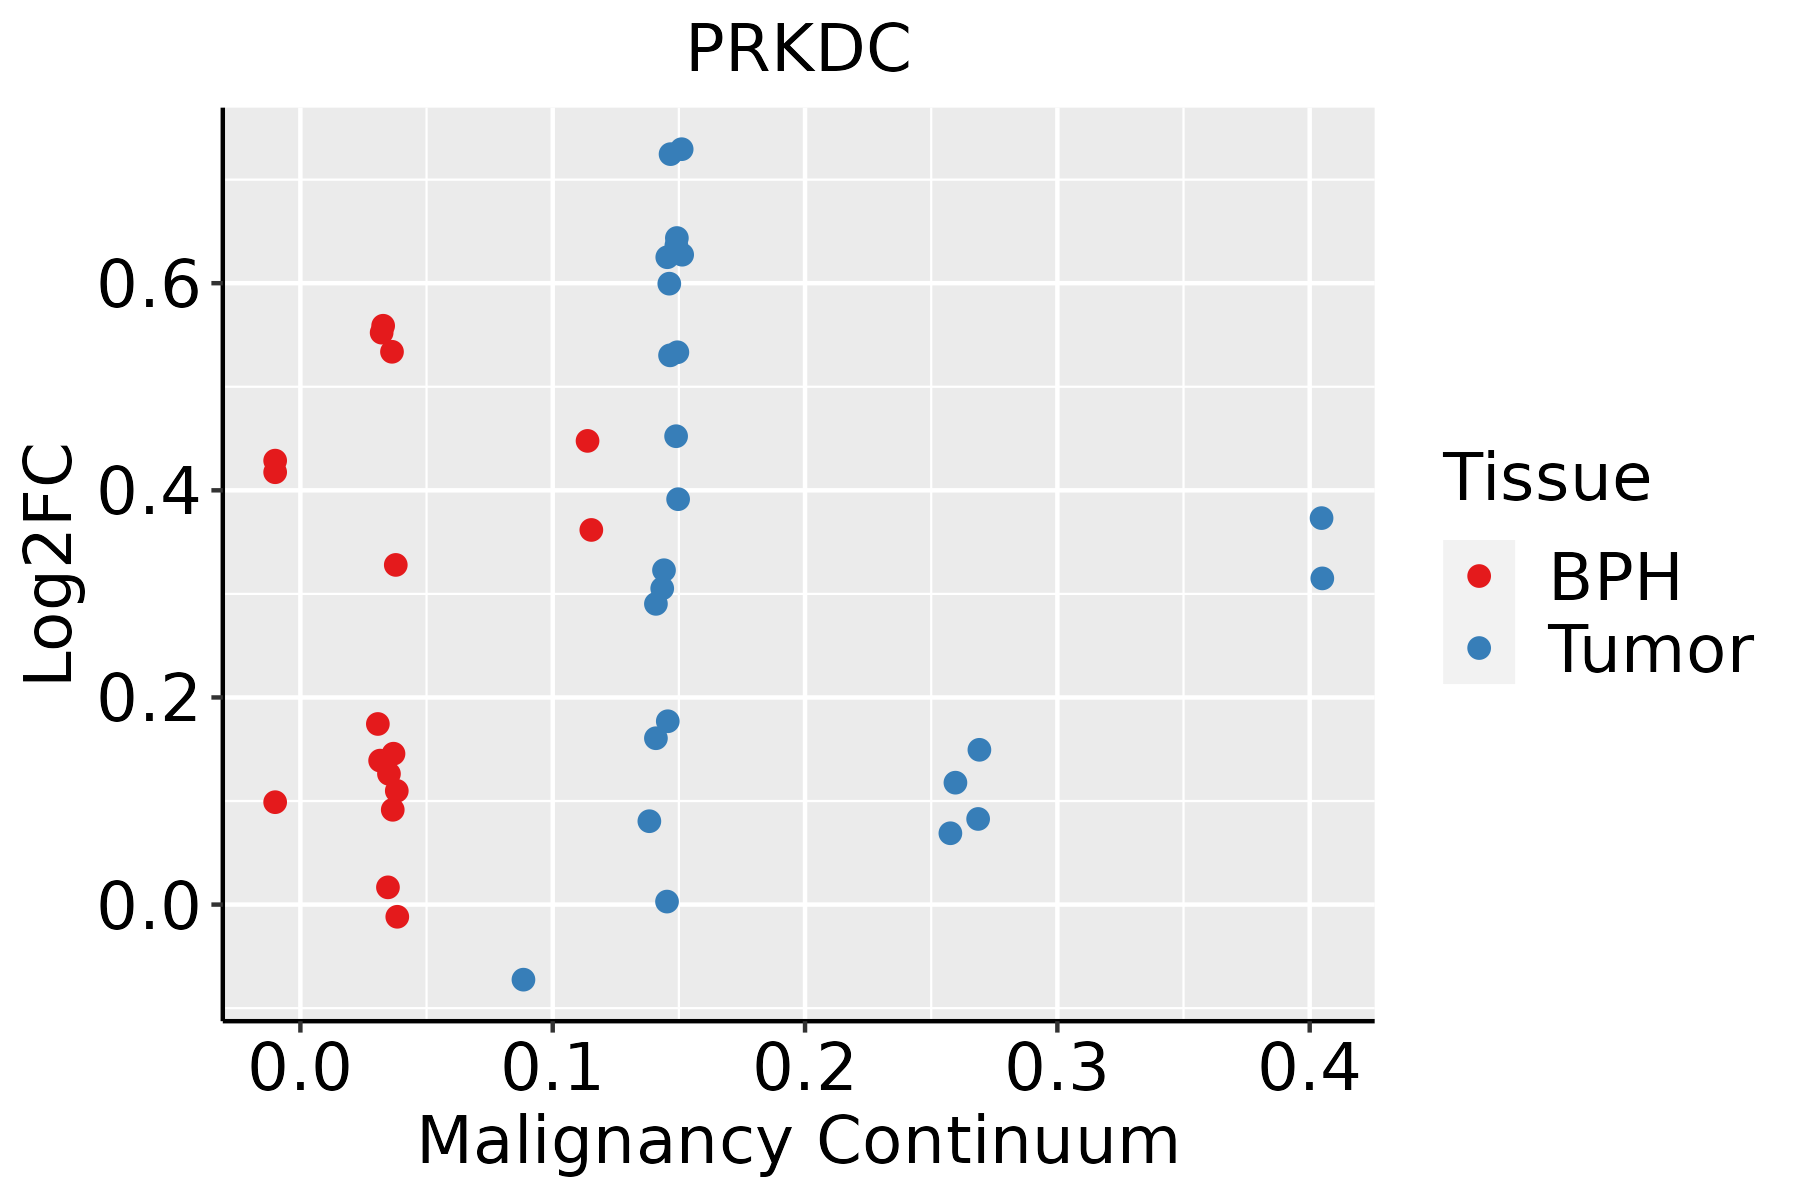 | BPH: Benign Prostatic Hyperplasia |
| Skin | 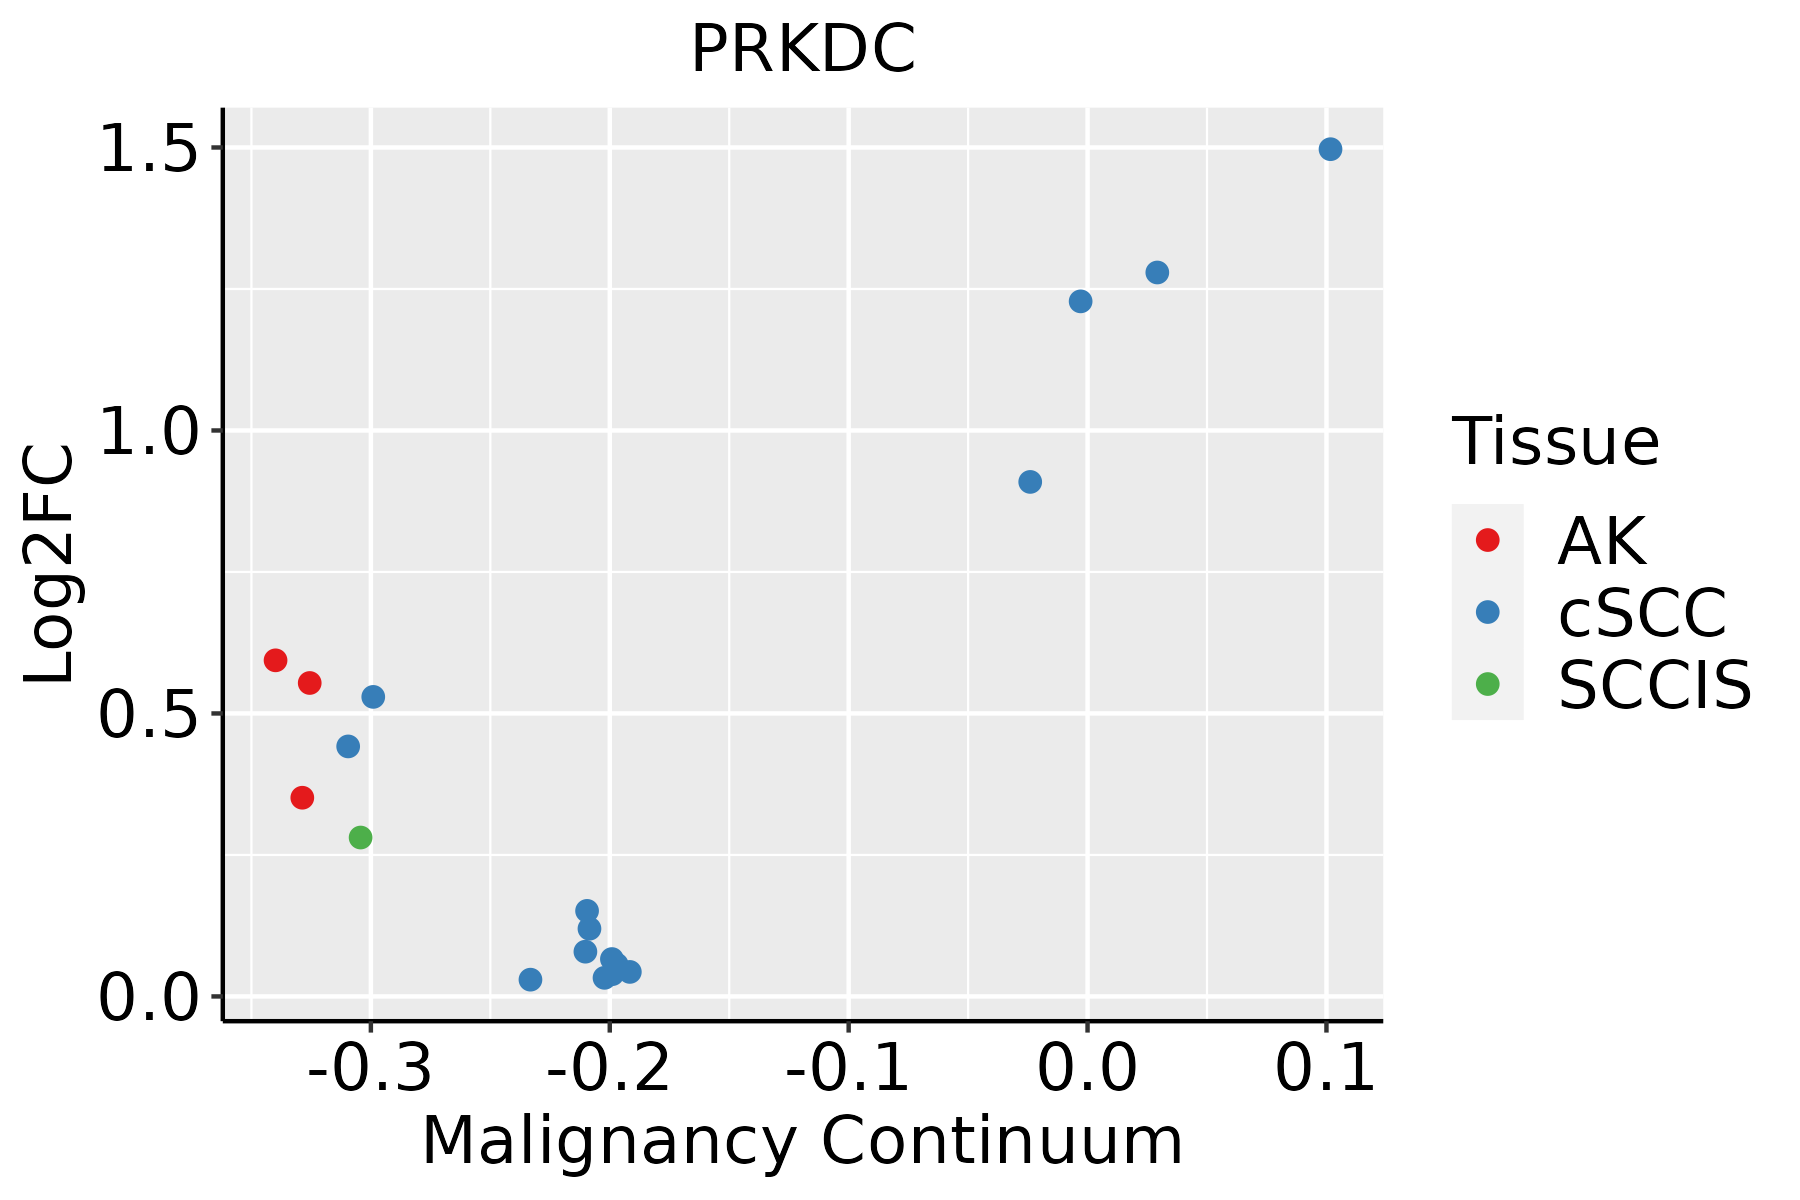 | AK: Actinic keratosis |
| cSCC: Cutaneous squamous cell carcinoma |
| SCCIS:squamous cell carcinoma in situ |
| Thyroid | 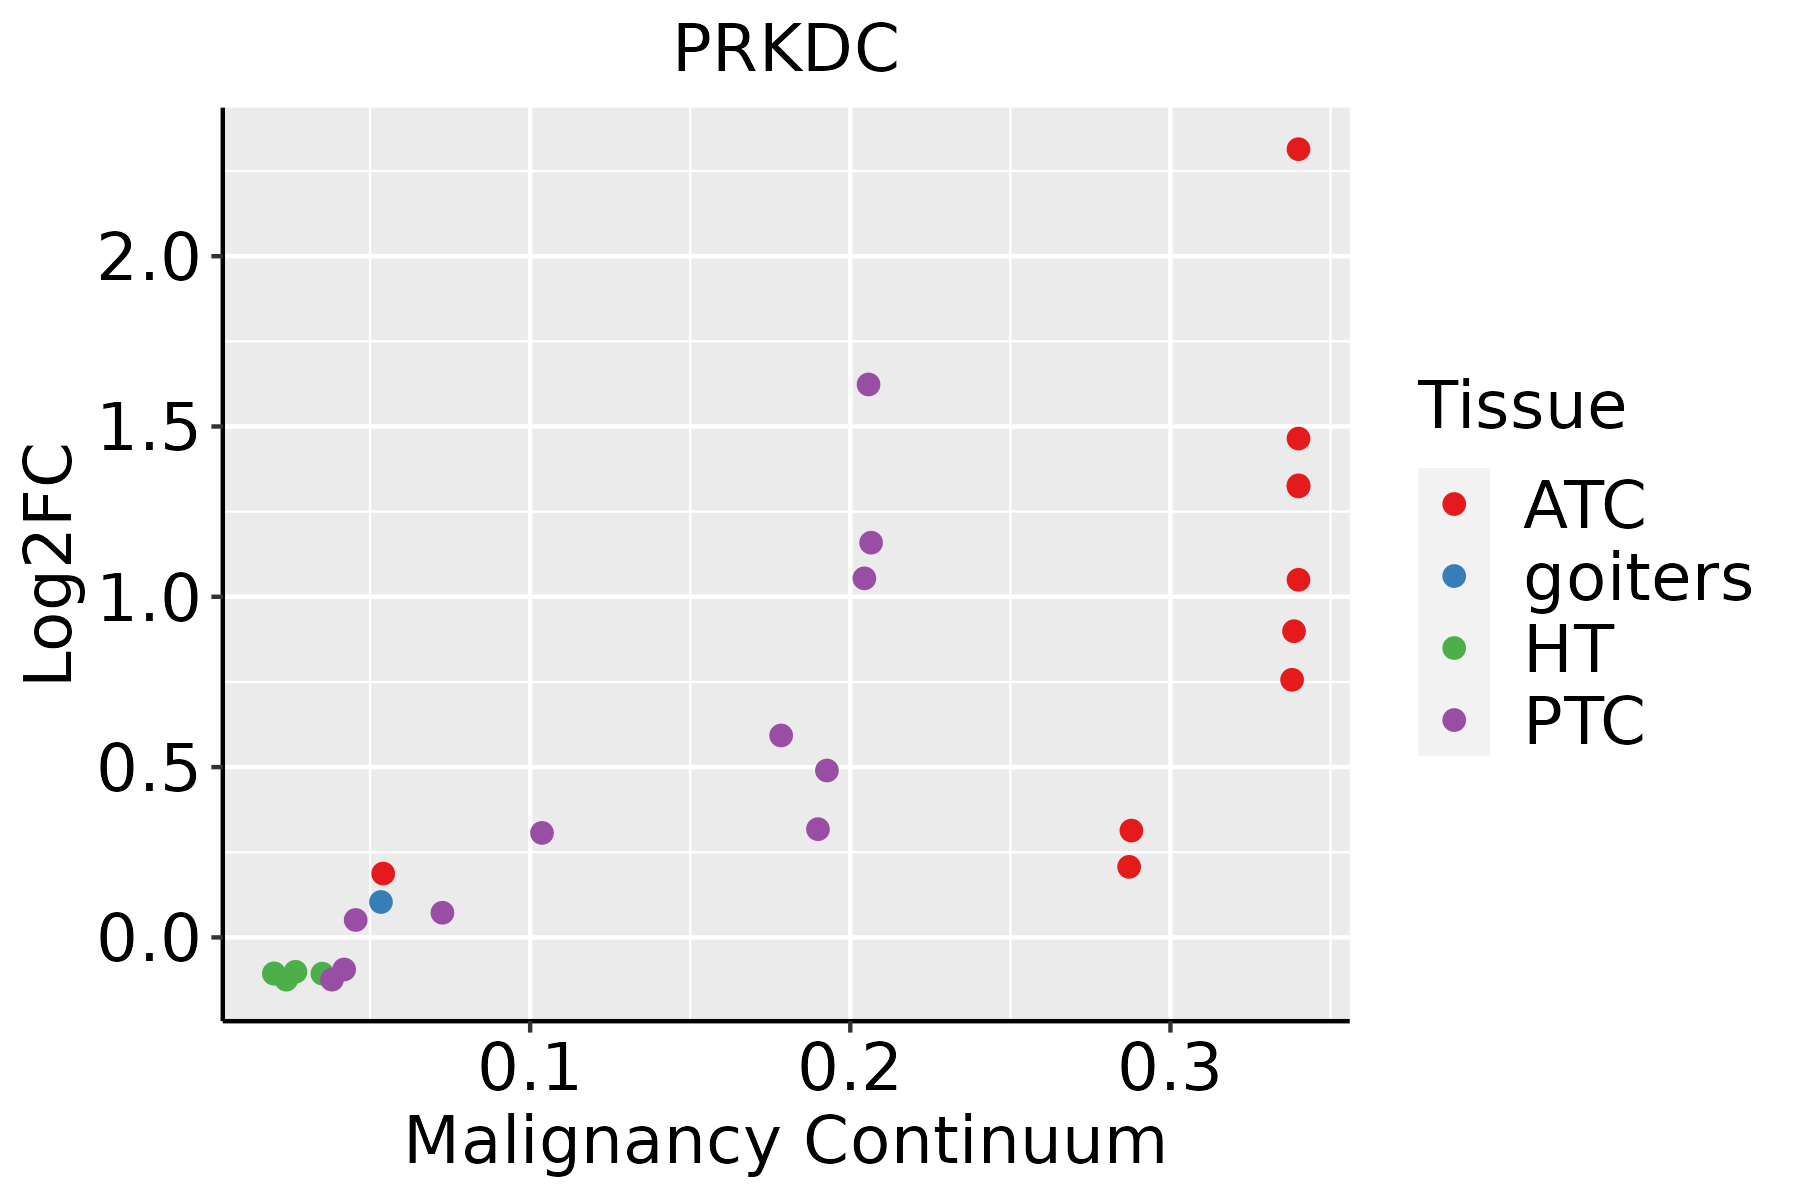 | ATC: Anaplastic thyroid cancer |
| HT: Hashimoto's thyroiditis |
| PTC: Papillary thyroid cancer |
| GO ID | Tissue | Disease Stage | Description | Gene Ratio | Bg Ratio | pvalue | p.adjust | Count |
| GO:00226139 | Breast | Precancer | ribonucleoprotein complex biogenesis | 79/1080 | 463/18723 | 2.11e-18 | 1.03e-15 | 79 |
| GO:00971939 | Breast | Precancer | intrinsic apoptotic signaling pathway | 59/1080 | 288/18723 | 8.07e-18 | 3.60e-15 | 59 |
| GO:00718269 | Breast | Precancer | ribonucleoprotein complex subunit organization | 48/1080 | 227/18723 | 2.68e-15 | 8.45e-13 | 48 |
| GO:00226189 | Breast | Precancer | ribonucleoprotein complex assembly | 47/1080 | 220/18723 | 3.47e-15 | 1.03e-12 | 47 |
| GO:00422549 | Breast | Precancer | ribosome biogenesis | 52/1080 | 299/18723 | 7.35e-13 | 1.51e-10 | 52 |
| GO:00064179 | Breast | Precancer | regulation of translation | 67/1080 | 468/18723 | 4.71e-12 | 7.64e-10 | 67 |
| GO:00457279 | Breast | Precancer | positive regulation of translation | 32/1080 | 136/18723 | 5.89e-12 | 9.27e-10 | 32 |
| GO:00422559 | Breast | Precancer | ribosome assembly | 21/1080 | 61/18723 | 1.06e-11 | 1.53e-09 | 21 |
| GO:00342509 | Breast | Precancer | positive regulation of cellular amide metabolic process | 33/1080 | 162/18723 | 1.72e-10 | 1.77e-08 | 33 |
| GO:00422749 | Breast | Precancer | ribosomal small subunit biogenesis | 21/1080 | 73/18723 | 4.84e-10 | 4.39e-08 | 21 |
| GO:00000289 | Breast | Precancer | ribosomal small subunit assembly | 10/1080 | 19/18723 | 2.24e-08 | 1.50e-06 | 10 |
| GO:00063646 | Breast | Precancer | rRNA processing | 35/1080 | 225/18723 | 7.90e-08 | 4.60e-06 | 35 |
| GO:00160726 | Breast | Precancer | rRNA metabolic process | 36/1080 | 236/18723 | 8.59e-08 | 4.84e-06 | 36 |
| GO:00022629 | Breast | Precancer | myeloid cell homeostasis | 27/1080 | 157/18723 | 3.10e-07 | 1.49e-05 | 27 |
| GO:00341019 | Breast | Precancer | erythrocyte homeostasis | 23/1080 | 129/18723 | 1.20e-06 | 4.60e-05 | 23 |
| GO:00316479 | Breast | Precancer | regulation of protein stability | 38/1080 | 298/18723 | 3.73e-06 | 1.19e-04 | 38 |
| GO:00300999 | Breast | Precancer | myeloid cell differentiation | 45/1080 | 381/18723 | 4.00e-06 | 1.25e-04 | 45 |
| GO:00075688 | Breast | Precancer | aging | 41/1080 | 339/18723 | 5.95e-06 | 1.71e-04 | 41 |
| GO:00487329 | Breast | Precancer | gland development | 49/1080 | 436/18723 | 6.11e-06 | 1.73e-04 | 49 |
| GO:00103323 | Breast | Precancer | response to gamma radiation | 13/1080 | 56/18723 | 1.35e-05 | 3.38e-04 | 13 |
| Hugo Symbol | Variant Class | Variant Classification | dbSNP RS | HGVSc | HGVSp | HGVSp Short | SWISSPROT | BIOTYPE | SIFT | PolyPhen | Tumor Sample Barcode | Tissue | Histology | Sex | Age | Stage | Therapy Types | Drugs | Outcome |
| PRKDC | SNV | Missense_Mutation | | c.1855G>C | p.Asp619His | p.D619H | P78527 | protein_coding | deleterious(0) | probably_damaging(0.998) | TCGA-3C-AALI-01 | Breast | breast invasive carcinoma | Female | <65 | I/II | Unspecific | Poly E | Complete Response |
| PRKDC | SNV | Missense_Mutation | novel | c.3658N>G | p.Leu1220Val | p.L1220V | P78527 | protein_coding | deleterious(0.01) | possibly_damaging(0.622) | TCGA-5L-AAT1-01 | Breast | breast invasive carcinoma | Female | <65 | III/IV | Hormone Therapy | letrozol | SD |
| PRKDC | SNV | Missense_Mutation | novel | c.1504N>A | p.Glu502Lys | p.E502K | P78527 | protein_coding | tolerated(0.18) | benign(0.076) | TCGA-5L-AAT1-01 | Breast | breast invasive carcinoma | Female | <65 | III/IV | Hormone Therapy | letrozol | SD |
| PRKDC | SNV | Missense_Mutation | novel | c.5396N>G | p.Glu1799Gly | p.E1799G | P78527 | protein_coding | tolerated(0.13) | benign(0.118) | TCGA-A2-A0EQ-01 | Breast | breast invasive carcinoma | Female | <65 | I/II | Chemotherapy | adriamycin | SD |
| PRKDC | SNV | Missense_Mutation | | c.9458C>G | p.Ser3153Cys | p.S3153C | P78527 | protein_coding | deleterious(0) | possibly_damaging(0.907) | TCGA-A7-A13D-01 | Breast | breast invasive carcinoma | Female | <65 | I/II | Chemotherapy | cytoxan | SD |
| PRKDC | SNV | Missense_Mutation | novel | c.5745N>C | p.Leu1915Phe | p.L1915F | P78527 | protein_coding | deleterious(0) | probably_damaging(0.914) | TCGA-A7-A6VV-01 | Breast | breast invasive carcinoma | Female | <65 | I/II | Chemotherapy | cyclophosphamide | CR |
| PRKDC | SNV | Missense_Mutation | | c.2706A>T | p.Lys902Asn | p.K902N | P78527 | protein_coding | deleterious(0) | probably_damaging(0.998) | TCGA-A7-A6VX-01 | Breast | breast invasive carcinoma | Female | >=65 | I/II | Chemotherapy | docetaxel | CR |
| PRKDC | SNV | Missense_Mutation | | c.2210N>T | p.Pro737Leu | p.P737L | P78527 | protein_coding | deleterious(0.01) | benign(0.354) | TCGA-A8-A099-01 | Breast | breast invasive carcinoma | Female | >=65 | III/IV | Hormone Therapy | exemestane | SD |
| PRKDC | SNV | Missense_Mutation | | c.6367N>T | p.Pro2123Ser | p.P2123S | P78527 | protein_coding | deleterious(0) | probably_damaging(0.999) | TCGA-AC-A23H-01 | Breast | breast invasive carcinoma | Female | >=65 | I/II | Unknown | Unknown | PD |
| PRKDC | SNV | Missense_Mutation | | c.3394N>A | p.Asp1132Asn | p.D1132N | P78527 | protein_coding | tolerated(0.21) | benign(0.055) | TCGA-AC-A23H-01 | Breast | breast invasive carcinoma | Female | >=65 | I/II | Unknown | Unknown | PD |
| Entrez ID | Symbol | Category | Interaction Types | Drug Claim Name | Drug Name | PMIDs |
| 5591 | PRKDC | TRANSCRIPTION FACTOR COMPLEX, SERINE THREONINE KINASE, KINASE, DRUGGABLE GENOME, ENZYME, PHOSPHATIDYLINOSITOL 3 KINASE, CLINICALLY ACTIONABLE | inhibitor | 252827496 | | |
| 5591 | PRKDC | TRANSCRIPTION FACTOR COMPLEX, SERINE THREONINE KINASE, KINASE, DRUGGABLE GENOME, ENZYME, PHOSPHATIDYLINOSITOL 3 KINASE, CLINICALLY ACTIONABLE | | M9831 | | |
| 5591 | PRKDC | TRANSCRIPTION FACTOR COMPLEX, SERINE THREONINE KINASE, KINASE, DRUGGABLE GENOME, ENZYME, PHOSPHATIDYLINOSITOL 3 KINASE, CLINICALLY ACTIONABLE | | KU-0060648 | CHEMBL1086377 | 23855836 |
| 5591 | PRKDC | TRANSCRIPTION FACTOR COMPLEX, SERINE THREONINE KINASE, KINASE, DRUGGABLE GENOME, ENZYME, PHOSPHATIDYLINOSITOL 3 KINASE, CLINICALLY ACTIONABLE | inhibitor | 178102582 | | |
| 5591 | PRKDC | TRANSCRIPTION FACTOR COMPLEX, SERINE THREONINE KINASE, KINASE, DRUGGABLE GENOME, ENZYME, PHOSPHATIDYLINOSITOL 3 KINASE, CLINICALLY ACTIONABLE | inhibitor | 249565693 | | |
| 5591 | PRKDC | TRANSCRIPTION FACTOR COMPLEX, SERINE THREONINE KINASE, KINASE, DRUGGABLE GENOME, ENZYME, PHOSPHATIDYLINOSITOL 3 KINASE, CLINICALLY ACTIONABLE | inhibitor | 354702239 | | |
| 5591 | PRKDC | TRANSCRIPTION FACTOR COMPLEX, SERINE THREONINE KINASE, KINASE, DRUGGABLE GENOME, ENZYME, PHOSPHATIDYLINOSITOL 3 KINASE, CLINICALLY ACTIONABLE | inhibitor | 178102681 | WORTMANNIN | |
| 5591 | PRKDC | TRANSCRIPTION FACTOR COMPLEX, SERINE THREONINE KINASE, KINASE, DRUGGABLE GENOME, ENZYME, PHOSPHATIDYLINOSITOL 3 KINASE, CLINICALLY ACTIONABLE | | SF1126 | | |
| 5591 | PRKDC | TRANSCRIPTION FACTOR COMPLEX, SERINE THREONINE KINASE, KINASE, DRUGGABLE GENOME, ENZYME, PHOSPHATIDYLINOSITOL 3 KINASE, CLINICALLY ACTIONABLE | inhibitor | 249565692 | | |
| 5591 | PRKDC | TRANSCRIPTION FACTOR COMPLEX, SERINE THREONINE KINASE, KINASE, DRUGGABLE GENOME, ENZYME, PHOSPHATIDYLINOSITOL 3 KINASE, CLINICALLY ACTIONABLE | inhibitor | 404859048 | | |


