
|
|||||
|
 | |
| |
| |
| |
| |
| |
|
Gene: PRKD2 |
Gene summary for PRKD2 |
| Gene information | Species | Human | Gene symbol | PRKD2 | Gene ID | 25865 |
| Gene name | protein kinase D2 | |
| Gene Alias | HSPC187 | |
| Cytomap | 19q13.32 | |
| Gene Type | protein-coding | GO ID | GO:0000165 | UniProtAcc | Q9BZL6 |
Top |
Malignant transformation analysis |
| Identification of the aberrant gene expression in precancerous and cancerous lesions by comparing the gene expression of stem-like cells in diseased tissues with normal stem cells |
| Entrez ID | Symbol | Replicates | Species | Organ | Tissue | Adj P-value | Log2FC | Malignancy |
| 25865 | PRKD2 | LZE4T | Human | Esophagus | ESCC | 5.61e-12 | 1.72e-01 | 0.0811 |
| 25865 | PRKD2 | LZE5T | Human | Esophagus | ESCC | 2.40e-02 | 1.63e-01 | 0.0514 |
| 25865 | PRKD2 | LZE7T | Human | Esophagus | ESCC | 1.01e-04 | 1.32e-01 | 0.0667 |
| 25865 | PRKD2 | LZE20T | Human | Esophagus | ESCC | 5.39e-13 | 1.44e-01 | 0.0662 |
| 25865 | PRKD2 | LZE22T | Human | Esophagus | ESCC | 1.26e-05 | 2.45e-01 | 0.068 |
| 25865 | PRKD2 | LZE24T | Human | Esophagus | ESCC | 5.90e-13 | 4.49e-01 | 0.0596 |
| 25865 | PRKD2 | P1T-E | Human | Esophagus | ESCC | 2.13e-05 | 4.68e-01 | 0.0875 |
| 25865 | PRKD2 | P2T-E | Human | Esophagus | ESCC | 2.24e-19 | 2.97e-01 | 0.1177 |
| 25865 | PRKD2 | P4T-E | Human | Esophagus | ESCC | 4.96e-14 | 2.69e-01 | 0.1323 |
| 25865 | PRKD2 | P5T-E | Human | Esophagus | ESCC | 1.08e-11 | 2.34e-01 | 0.1327 |
| 25865 | PRKD2 | P8T-E | Human | Esophagus | ESCC | 1.71e-30 | 7.55e-01 | 0.0889 |
| 25865 | PRKD2 | P9T-E | Human | Esophagus | ESCC | 4.42e-05 | 1.55e-01 | 0.1131 |
| 25865 | PRKD2 | P10T-E | Human | Esophagus | ESCC | 1.75e-14 | 2.46e-01 | 0.116 |
| 25865 | PRKD2 | P11T-E | Human | Esophagus | ESCC | 2.65e-09 | 4.21e-01 | 0.1426 |
| 25865 | PRKD2 | P12T-E | Human | Esophagus | ESCC | 2.77e-11 | 2.90e-01 | 0.1122 |
| 25865 | PRKD2 | P15T-E | Human | Esophagus | ESCC | 4.14e-17 | 3.68e-01 | 0.1149 |
| 25865 | PRKD2 | P16T-E | Human | Esophagus | ESCC | 1.36e-08 | 1.04e-01 | 0.1153 |
| 25865 | PRKD2 | P17T-E | Human | Esophagus | ESCC | 1.27e-03 | 1.82e-01 | 0.1278 |
| 25865 | PRKD2 | P20T-E | Human | Esophagus | ESCC | 2.75e-12 | 3.31e-01 | 0.1124 |
| 25865 | PRKD2 | P21T-E | Human | Esophagus | ESCC | 6.90e-23 | 2.09e-01 | 0.1617 |
| Page: 1 2 3 4 5 |
| Tissue | Expression Dynamics | Abbreviation |
| Esophagus |  | ESCC: Esophageal squamous cell carcinoma |
| HGIN: High-grade intraepithelial neoplasias | ||
| LGIN: Low-grade intraepithelial neoplasias | ||
| Liver | 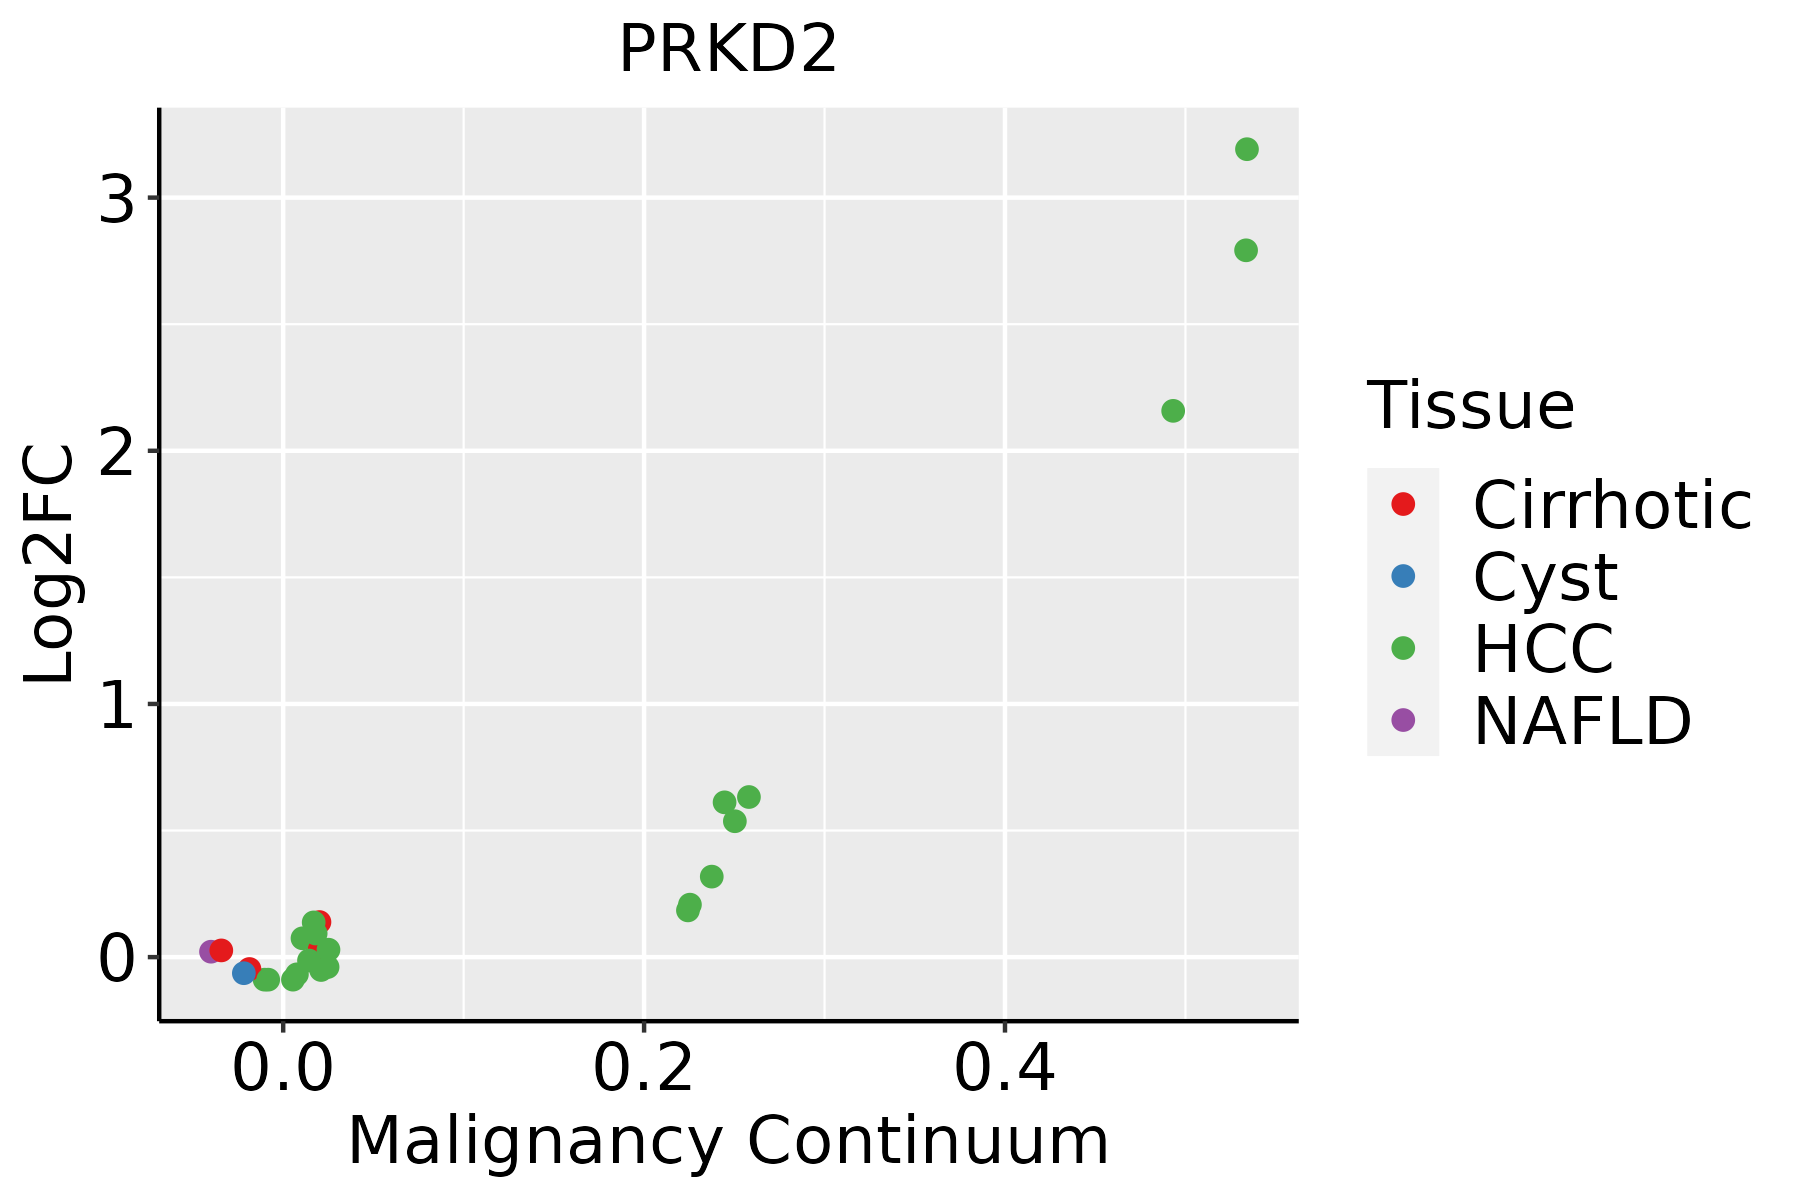 | HCC: Hepatocellular carcinoma |
| NAFLD: Non-alcoholic fatty liver disease | ||
| Oral Cavity | 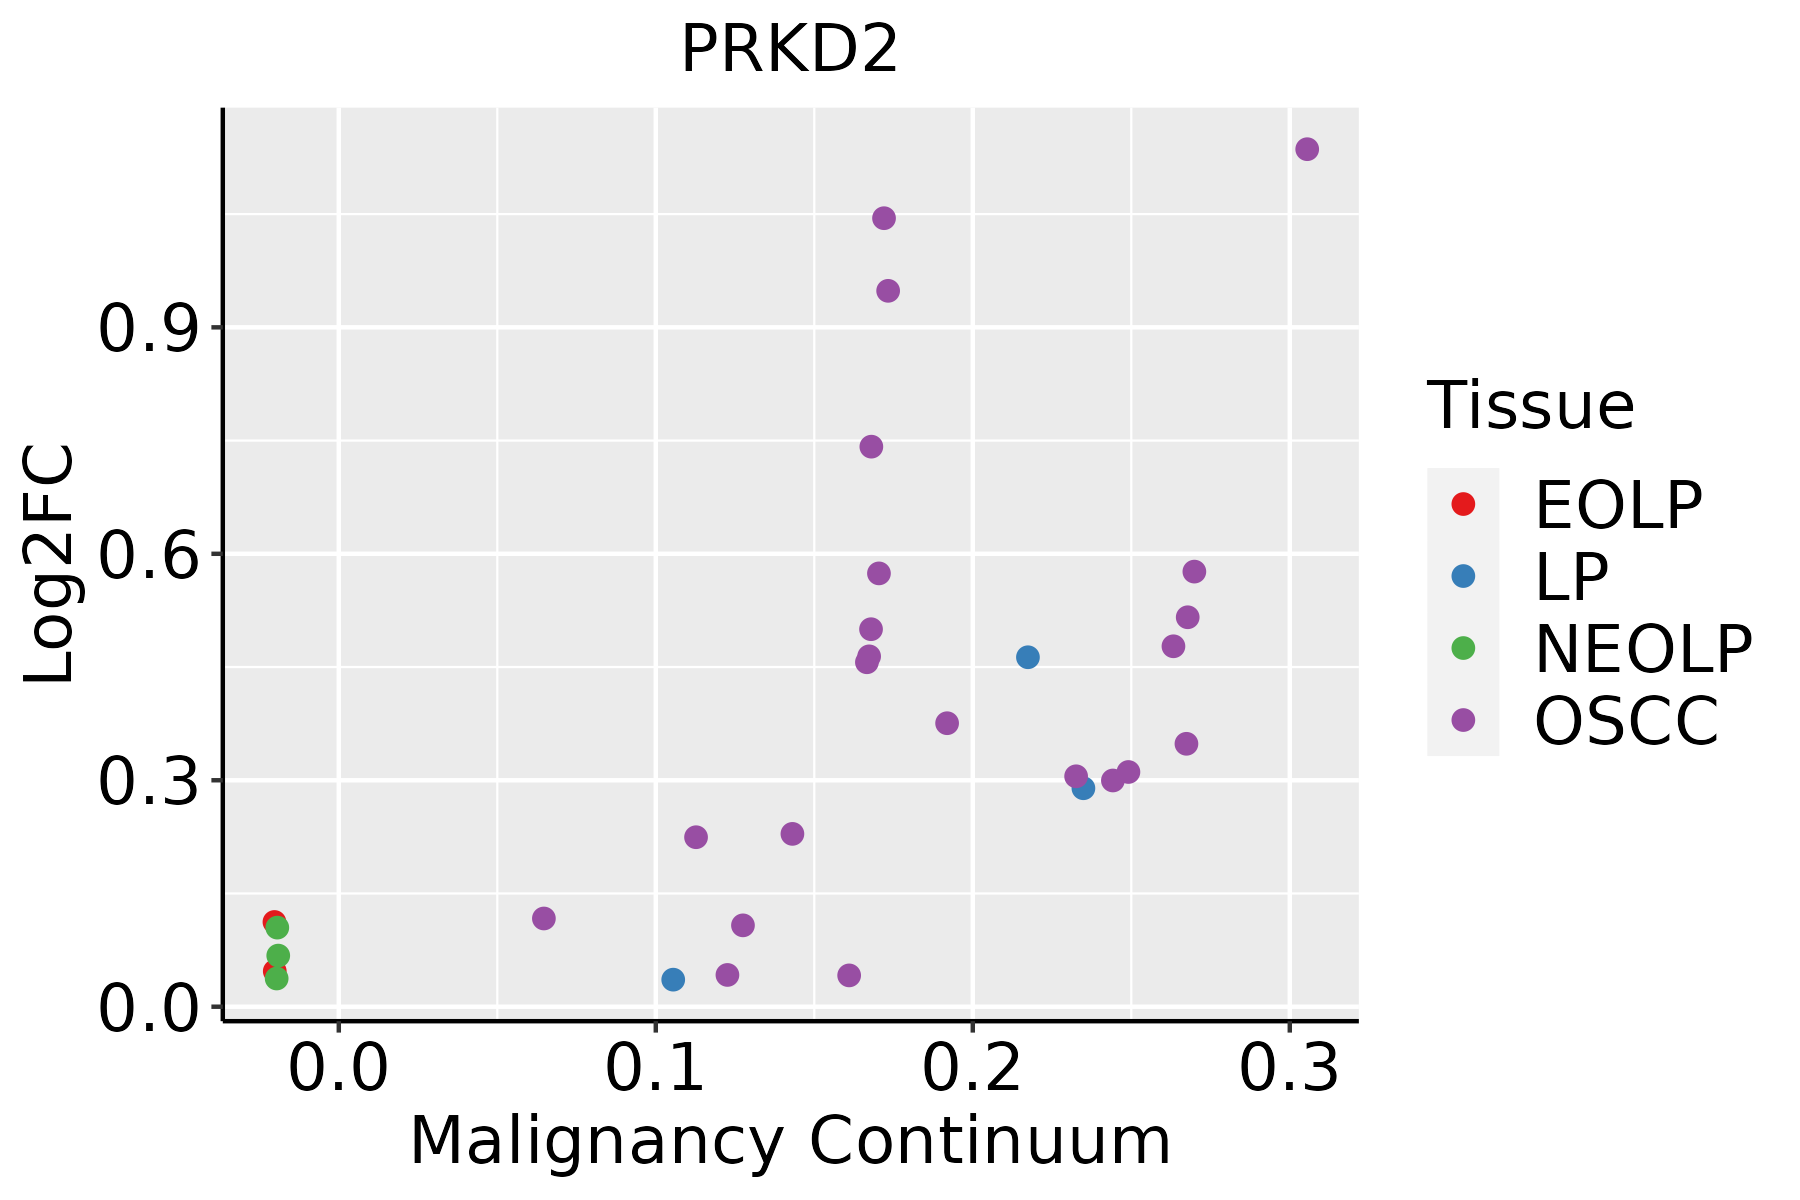 | EOLP: Erosive Oral lichen planus |
| LP: leukoplakia | ||
| NEOLP: Non-erosive oral lichen planus | ||
| OSCC: Oral squamous cell carcinoma | ||
| Skin | 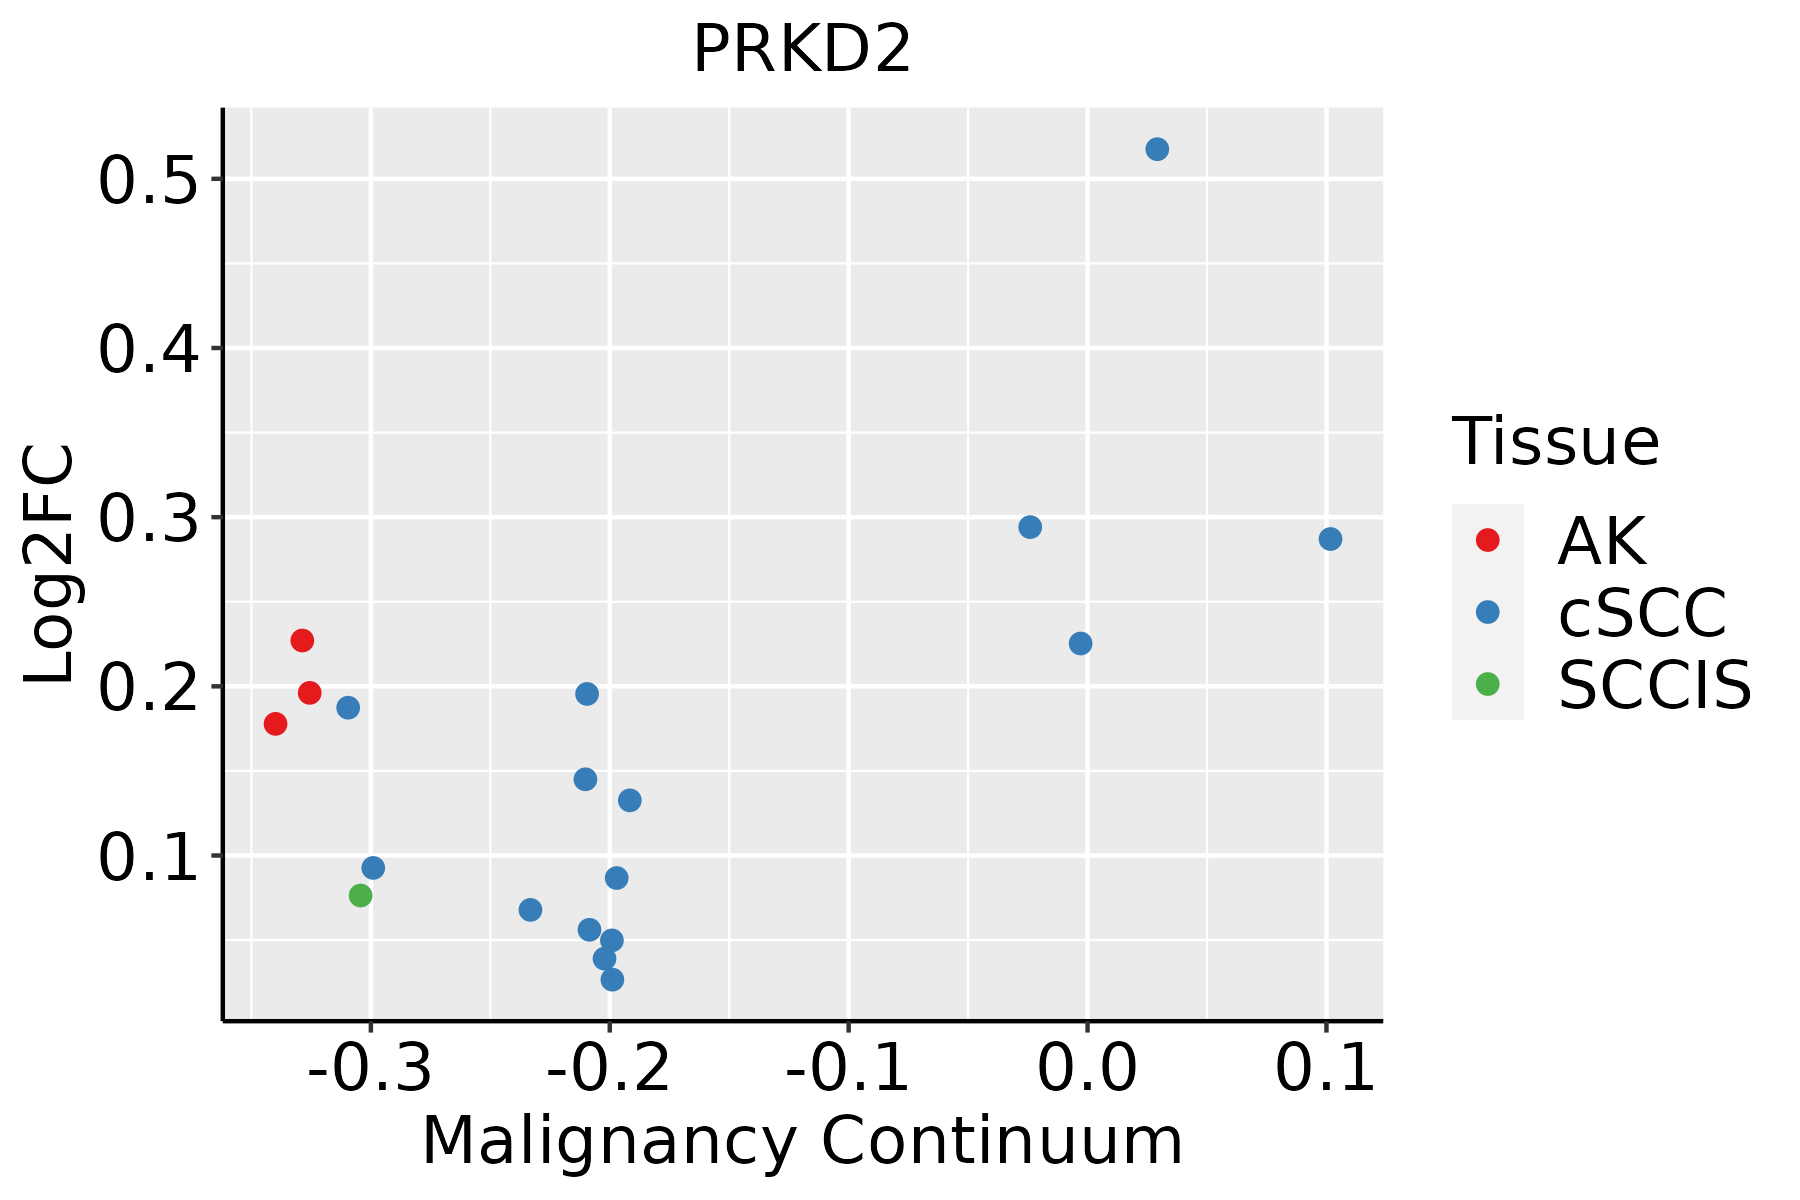 | AK: Actinic keratosis |
| cSCC: Cutaneous squamous cell carcinoma | ||
| SCCIS:squamous cell carcinoma in situ |
| ∗log2FC in expression of this searched gene in stem-like cells from each diseased tissue sample relative to stem-like cells in normal samples in each tissue plotted against the malignancy continuum. Samples are colored based on if they are from different disease stage. |
Top |
Malignant transformation related pathway analysis |
| Find out the enriched GO biological processes and KEGG pathways involved in transition from healthy to precancer to cancer |
| Tissue | Disease Stage | Enriched GO biological Processes |
| Colorectum | AD |  |
| Colorectum | SER |  |
| Colorectum | MSS |  |
| Colorectum | MSI-H |  |
| Colorectum | FAP |  |
| ∗Top 15 enriched GO BP terms are showed in the bar plot of each disease state in each tissue. Each row represents a significant GO biological process which is colored according to the -log10(p.adjust). |
| Page: 1 2 3 4 5 6 7 8 9 |
| GO ID | Tissue | Disease Stage | Description | Gene Ratio | Bg Ratio | pvalue | p.adjust | Count |
| GO:001657015 | Esophagus | ESCC | histone modification | 323/8552 | 463/18723 | 2.61e-26 | 7.88e-24 | 323 |
| GO:005105215 | Esophagus | ESCC | regulation of DNA metabolic process | 232/8552 | 359/18723 | 2.40e-13 | 1.13e-11 | 232 |
| GO:007189716 | Esophagus | ESCC | DNA biosynthetic process | 127/8552 | 180/18723 | 1.04e-11 | 3.85e-10 | 127 |
| GO:005105417 | Esophagus | ESCC | positive regulation of DNA metabolic process | 139/8552 | 201/18723 | 1.20e-11 | 4.33e-10 | 139 |
| GO:200057319 | Esophagus | ESCC | positive regulation of DNA biosynthetic process | 56/8552 | 66/18723 | 4.51e-11 | 1.45e-09 | 56 |
| GO:2000278110 | Esophagus | ESCC | regulation of DNA biosynthetic process | 81/8552 | 106/18723 | 9.81e-11 | 2.96e-09 | 81 |
| GO:003105614 | Esophagus | ESCC | regulation of histone modification | 106/8552 | 152/18723 | 1.52e-09 | 3.55e-08 | 106 |
| GO:004578527 | Esophagus | ESCC | positive regulation of cell adhesion | 255/8552 | 437/18723 | 5.07e-08 | 9.11e-07 | 255 |
| GO:00356015 | Esophagus | ESCC | protein deacylation | 79/8552 | 112/18723 | 8.30e-08 | 1.42e-06 | 79 |
| GO:00066433 | Esophagus | ESCC | membrane lipid metabolic process | 130/8552 | 203/18723 | 9.29e-08 | 1.54e-06 | 130 |
| GO:00987325 | Esophagus | ESCC | macromolecule deacylation | 80/8552 | 116/18723 | 3.19e-07 | 4.50e-06 | 80 |
| GO:00165754 | Esophagus | ESCC | histone deacetylation | 60/8552 | 82/18723 | 3.85e-07 | 5.32e-06 | 60 |
| GO:00510908 | Esophagus | ESCC | regulation of DNA-binding transcription factor activity | 252/8552 | 440/18723 | 5.22e-07 | 6.97e-06 | 252 |
| GO:00310583 | Esophagus | ESCC | positive regulation of histone modification | 65/8552 | 92/18723 | 1.04e-06 | 1.31e-05 | 65 |
| GO:00064765 | Esophagus | ESCC | protein deacetylation | 70/8552 | 101/18723 | 1.29e-06 | 1.58e-05 | 70 |
| GO:004677710 | Esophagus | ESCC | protein autophosphorylation | 138/8552 | 227/18723 | 2.98e-06 | 3.38e-05 | 138 |
| GO:00182099 | Esophagus | ESCC | peptidyl-serine modification | 196/8552 | 338/18723 | 3.07e-06 | 3.47e-05 | 196 |
| GO:001810515 | Esophagus | ESCC | peptidyl-serine phosphorylation | 184/8552 | 315/18723 | 3.22e-06 | 3.61e-05 | 184 |
| GO:00510918 | Esophagus | ESCC | positive regulation of DNA-binding transcription factor activity | 155/8552 | 260/18723 | 3.83e-06 | 4.14e-05 | 155 |
| GO:00464673 | Esophagus | ESCC | membrane lipid biosynthetic process | 91/8552 | 142/18723 | 7.19e-06 | 7.19e-05 | 91 |
| Page: 1 2 3 4 5 6 7 8 9 10 11 |
| Pathway ID | Tissue | Disease Stage | Description | Gene Ratio | Bg Ratio | pvalue | p.adjust | qvalue | Count |
| hsa05208211 | Esophagus | ESCC | Chemical carcinogenesis - reactive oxygen species | 168/4205 | 223/8465 | 1.83e-15 | 6.81e-14 | 3.49e-14 | 168 |
| hsa05208310 | Esophagus | ESCC | Chemical carcinogenesis - reactive oxygen species | 168/4205 | 223/8465 | 1.83e-15 | 6.81e-14 | 3.49e-14 | 168 |
| hsa0520842 | Liver | HCC | Chemical carcinogenesis - reactive oxygen species | 167/4020 | 223/8465 | 2.85e-17 | 1.91e-15 | 1.06e-15 | 167 |
| hsa0520852 | Liver | HCC | Chemical carcinogenesis - reactive oxygen species | 167/4020 | 223/8465 | 2.85e-17 | 1.91e-15 | 1.06e-15 | 167 |
| hsa0520830 | Oral cavity | OSCC | Chemical carcinogenesis - reactive oxygen species | 150/3704 | 223/8465 | 6.45e-13 | 1.20e-11 | 6.11e-12 | 150 |
| hsa0401518 | Oral cavity | OSCC | Rap1 signaling pathway | 107/3704 | 210/8465 | 2.01e-02 | 4.34e-02 | 2.21e-02 | 107 |
| hsa05208114 | Oral cavity | OSCC | Chemical carcinogenesis - reactive oxygen species | 150/3704 | 223/8465 | 6.45e-13 | 1.20e-11 | 6.11e-12 | 150 |
| hsa0401519 | Oral cavity | OSCC | Rap1 signaling pathway | 107/3704 | 210/8465 | 2.01e-02 | 4.34e-02 | 2.21e-02 | 107 |
| hsa05208210 | Oral cavity | LP | Chemical carcinogenesis - reactive oxygen species | 119/2418 | 223/8465 | 3.00e-15 | 8.32e-14 | 5.37e-14 | 119 |
| hsa0520838 | Oral cavity | LP | Chemical carcinogenesis - reactive oxygen species | 119/2418 | 223/8465 | 3.00e-15 | 8.32e-14 | 5.37e-14 | 119 |
| Page: 1 |
Top |
Cell-cell communication analysis |
| Identification of potential cell-cell interactions between two cell types and their ligand-receptor pairs for different disease states |
| Ligand | Receptor | LRpair | Pathway | Tissue | Disease Stage |
| Page: 1 |
Top |
Single-cell gene regulatory network inference analysis |
| Find out the significant the regulons (TFs) and the target genes of each regulon across cell types for different disease states |
| TF | Cell Type | Tissue | Disease Stage | Target Gene | RSS | Regulon Activity |
| ∗The dot plots of a searched regulon are shown for all cell subpopulations in each disease state of each tissue based on the regulon specific score inferred using pySCENIC and by calculating the average expression. |
| Page: 1 |
Top |
Somatic mutation of malignant transformation related genes |
| Annotation of somatic variants for genes involved in malignant transformation |
| Hugo Symbol | Variant Class | Variant Classification | dbSNP RS | HGVSc | HGVSp | HGVSp Short | SWISSPROT | BIOTYPE | SIFT | PolyPhen | Tumor Sample Barcode | Tissue | Histology | Sex | Age | Stage | Therapy Types | Drugs | Outcome |
| PRKD2 | SNV | Missense_Mutation | rs750665196 | c.1757G>A | p.Arg586His | p.R586H | Q9BZL6 | protein_coding | deleterious(0) | probably_damaging(0.994) | TCGA-A7-A0CJ-01 | Breast | breast invasive carcinoma | Female | <65 | I/II | Chemotherapy | cytoxan | SD |
| PRKD2 | SNV | Missense_Mutation | c.2004N>C | p.Lys668Asn | p.K668N | Q9BZL6 | protein_coding | deleterious(0.02) | probably_damaging(0.994) | TCGA-AC-A23H-01 | Breast | breast invasive carcinoma | Female | >=65 | I/II | Unknown | Unknown | PD | |
| PRKD2 | SNV | Missense_Mutation | c.1067N>G | p.Glu356Gly | p.E356G | Q9BZL6 | protein_coding | tolerated(0.16) | benign(0.186) | TCGA-AR-A1AX-01 | Breast | breast invasive carcinoma | Female | <65 | I/II | Chemotherapy | cytoxan | SD | |
| PRKD2 | SNV | Missense_Mutation | c.2277N>G | p.Asp759Glu | p.D759E | Q9BZL6 | protein_coding | tolerated(0.12) | benign(0.075) | TCGA-BH-A0DK-01 | Breast | breast invasive carcinoma | Female | <65 | I/II | Hormone Therapy | tamoxiphen | SD | |
| PRKD2 | SNV | Missense_Mutation | c.1226N>T | p.Asn409Ile | p.N409I | Q9BZL6 | protein_coding | deleterious(0) | benign(0.303) | TCGA-BH-A18P-01 | Breast | breast invasive carcinoma | Female | <65 | I/II | Unknown | Unknown | PD | |
| PRKD2 | SNV | Missense_Mutation | c.1942G>A | p.Glu648Lys | p.E648K | Q9BZL6 | protein_coding | deleterious(0) | probably_damaging(0.987) | TCGA-D8-A1J8-01 | Breast | breast invasive carcinoma | Female | >=65 | I/II | Hormone Therapy | nolvadex | SD | |
| PRKD2 | SNV | Missense_Mutation | c.1287N>A | p.Phe429Leu | p.F429L | Q9BZL6 | protein_coding | deleterious(0.02) | probably_damaging(0.965) | TCGA-JX-A3Q0-01 | Cervix | cervical & endocervical cancer | Female | <65 | III/IV | Unknown | Unknown | SD | |
| PRKD2 | SNV | Missense_Mutation | c.1942G>C | p.Glu648Gln | p.E648Q | Q9BZL6 | protein_coding | deleterious(0.01) | probably_damaging(0.991) | TCGA-VS-A958-01 | Cervix | cervical & endocervical cancer | Female | <65 | I/II | Chemotherapy | cisplatin | CR | |
| PRKD2 | SNV | Missense_Mutation | c.577N>G | p.Lys193Glu | p.K193E | Q9BZL6 | protein_coding | deleterious(0.04) | probably_damaging(0.991) | TCGA-A6-5665-01 | Colorectum | colon adenocarcinoma | Female | >=65 | I/II | Unknown | Unknown | PD | |
| PRKD2 | SNV | Missense_Mutation | c.2378N>A | p.Arg793His | p.R793H | Q9BZL6 | protein_coding | deleterious(0) | probably_damaging(0.996) | TCGA-AA-3492-01 | Colorectum | colon adenocarcinoma | Female | >=65 | I/II | Unknown | Unknown | SD |
| Page: 1 2 3 4 5 6 7 8 9 |
Top |
Related drugs of malignant transformation related genes |
| Identification of chemicals and drugs interact with genes involved in malignant transfromation |
| (DGIdb 4.0) |
| Entrez ID | Symbol | Category | Interaction Types | Drug Claim Name | Drug Name | PMIDs |
| 25865 | PRKD2 | SERINE THREONINE KINASE, KINASE, DRUGGABLE GENOME, ENZYME, TRANSCRIPTION FACTOR | VER-49009 | CHEMBL365617 | ||
| 25865 | PRKD2 | SERINE THREONINE KINASE, KINASE, DRUGGABLE GENOME, ENZYME, TRANSCRIPTION FACTOR | RUCAPARIB | RUCAPARIB | ||
| 25865 | PRKD2 | SERINE THREONINE KINASE, KINASE, DRUGGABLE GENOME, ENZYME, TRANSCRIPTION FACTOR | LAUROGUADINE | LAUROGUADINE | ||
| 25865 | PRKD2 | SERINE THREONINE KINASE, KINASE, DRUGGABLE GENOME, ENZYME, TRANSCRIPTION FACTOR | BRYOSTATIN | BRYOSTATIN | ||
| 25865 | PRKD2 | SERINE THREONINE KINASE, KINASE, DRUGGABLE GENOME, ENZYME, TRANSCRIPTION FACTOR | SP-600125 | SP-600125 | ||
| 25865 | PRKD2 | SERINE THREONINE KINASE, KINASE, DRUGGABLE GENOME, ENZYME, TRANSCRIPTION FACTOR | GO-6976 | GO-6976 | ||
| 25865 | PRKD2 | SERINE THREONINE KINASE, KINASE, DRUGGABLE GENOME, ENZYME, TRANSCRIPTION FACTOR | GEFITINIB | GEFITINIB | ||
| 25865 | PRKD2 | SERINE THREONINE KINASE, KINASE, DRUGGABLE GENOME, ENZYME, TRANSCRIPTION FACTOR | BAY-613606 | CHEMBL541400 | ||
| 25865 | PRKD2 | SERINE THREONINE KINASE, KINASE, DRUGGABLE GENOME, ENZYME, TRANSCRIPTION FACTOR | JNK INHIBITOR VIII | CHEMBL210618 | ||
| 25865 | PRKD2 | SERINE THREONINE KINASE, KINASE, DRUGGABLE GENOME, ENZYME, TRANSCRIPTION FACTOR | BRYOSTATIN-1 |
| Page: 1 2 3 4 |

Copyright 2023-Present -The University of Texas Health Science Center at Houston |