
|
|||||
|
 | |
| |
| |
| |
| |
| |
|
Gene: PRKCZ |
Gene summary for PRKCZ |
| Gene information | Species | Human | Gene symbol | PRKCZ | Gene ID | 5590 |
| Gene name | protein kinase C zeta | |
| Gene Alias | PKC-ZETA | |
| Cytomap | 1p36.33 | |
| Gene Type | protein-coding | GO ID | GO:0000165 | UniProtAcc | Q05513 |
Top |
Malignant transformation analysis |
| Identification of the aberrant gene expression in precancerous and cancerous lesions by comparing the gene expression of stem-like cells in diseased tissues with normal stem cells |
| Entrez ID | Symbol | Replicates | Species | Organ | Tissue | Adj P-value | Log2FC | Malignancy |
| 5590 | PRKCZ | LZE22D1 | Human | Esophagus | HGIN | 3.38e-04 | 2.05e-01 | 0.0595 |
| 5590 | PRKCZ | LZE22T | Human | Esophagus | ESCC | 8.96e-04 | 3.56e-01 | 0.068 |
| 5590 | PRKCZ | LZE24T | Human | Esophagus | ESCC | 1.84e-23 | 5.55e-01 | 0.0596 |
| 5590 | PRKCZ | LZE21T | Human | Esophagus | ESCC | 4.23e-02 | 1.49e-01 | 0.0655 |
| 5590 | PRKCZ | P1T-E | Human | Esophagus | ESCC | 3.29e-07 | 2.62e-01 | 0.0875 |
| 5590 | PRKCZ | P2T-E | Human | Esophagus | ESCC | 4.38e-24 | 3.88e-01 | 0.1177 |
| 5590 | PRKCZ | P4T-E | Human | Esophagus | ESCC | 5.81e-29 | 5.62e-01 | 0.1323 |
| 5590 | PRKCZ | P5T-E | Human | Esophagus | ESCC | 1.58e-03 | 9.70e-02 | 0.1327 |
| 5590 | PRKCZ | P8T-E | Human | Esophagus | ESCC | 3.53e-28 | 4.75e-01 | 0.0889 |
| 5590 | PRKCZ | P9T-E | Human | Esophagus | ESCC | 3.39e-04 | 9.56e-02 | 0.1131 |
| 5590 | PRKCZ | P10T-E | Human | Esophagus | ESCC | 2.11e-28 | 4.62e-01 | 0.116 |
| 5590 | PRKCZ | P11T-E | Human | Esophagus | ESCC | 3.50e-07 | 2.89e-01 | 0.1426 |
| 5590 | PRKCZ | P12T-E | Human | Esophagus | ESCC | 1.06e-46 | 7.88e-01 | 0.1122 |
| 5590 | PRKCZ | P15T-E | Human | Esophagus | ESCC | 1.08e-24 | 4.71e-01 | 0.1149 |
| 5590 | PRKCZ | P16T-E | Human | Esophagus | ESCC | 1.03e-21 | 3.53e-01 | 0.1153 |
| 5590 | PRKCZ | P17T-E | Human | Esophagus | ESCC | 2.48e-09 | 3.54e-01 | 0.1278 |
| 5590 | PRKCZ | P19T-E | Human | Esophagus | ESCC | 3.03e-05 | 4.30e-01 | 0.1662 |
| 5590 | PRKCZ | P20T-E | Human | Esophagus | ESCC | 1.02e-19 | 3.94e-01 | 0.1124 |
| 5590 | PRKCZ | P21T-E | Human | Esophagus | ESCC | 2.58e-24 | 5.31e-01 | 0.1617 |
| 5590 | PRKCZ | P22T-E | Human | Esophagus | ESCC | 3.90e-07 | 1.20e-01 | 0.1236 |
| Page: 1 2 3 4 5 |
| Tissue | Expression Dynamics | Abbreviation |
| Esophagus | 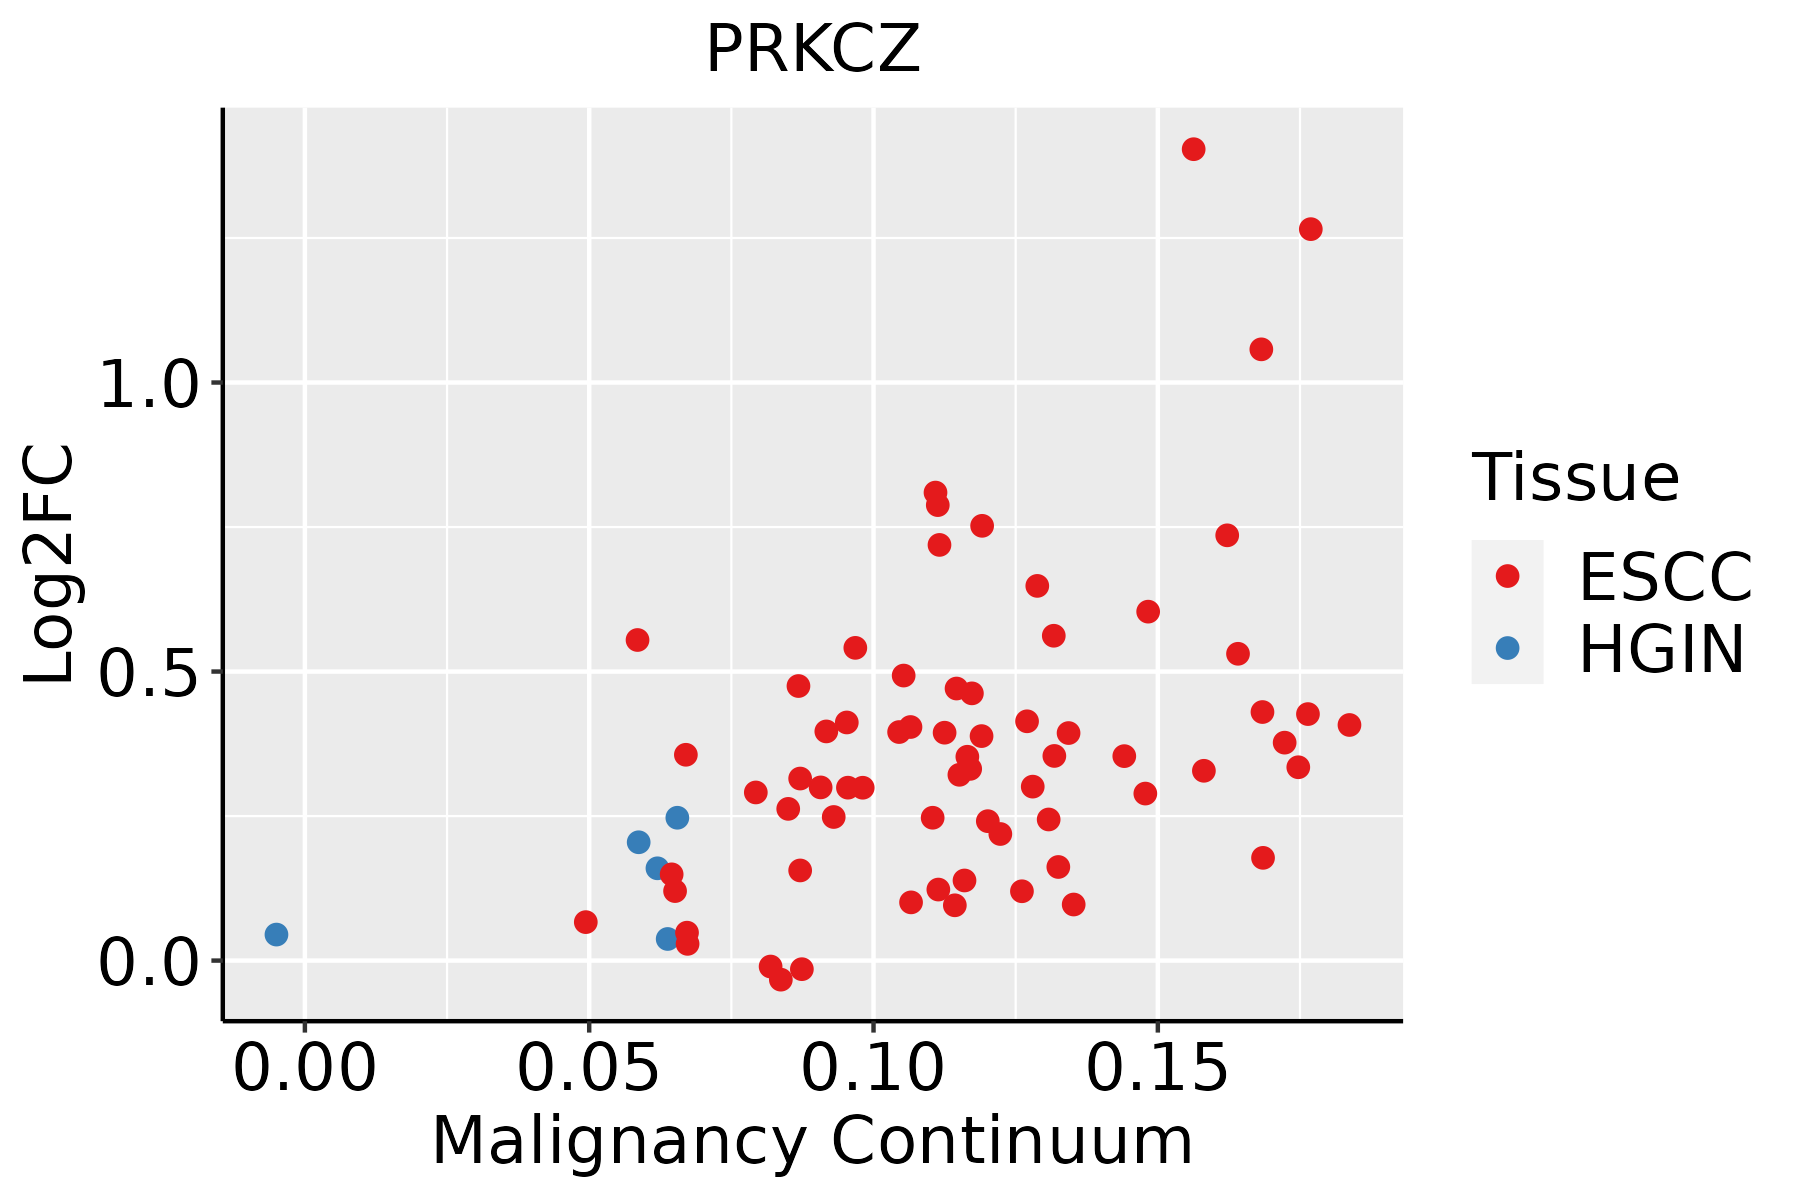 | ESCC: Esophageal squamous cell carcinoma |
| HGIN: High-grade intraepithelial neoplasias | ||
| LGIN: Low-grade intraepithelial neoplasias | ||
| Liver |  | HCC: Hepatocellular carcinoma |
| NAFLD: Non-alcoholic fatty liver disease | ||
| Lung | 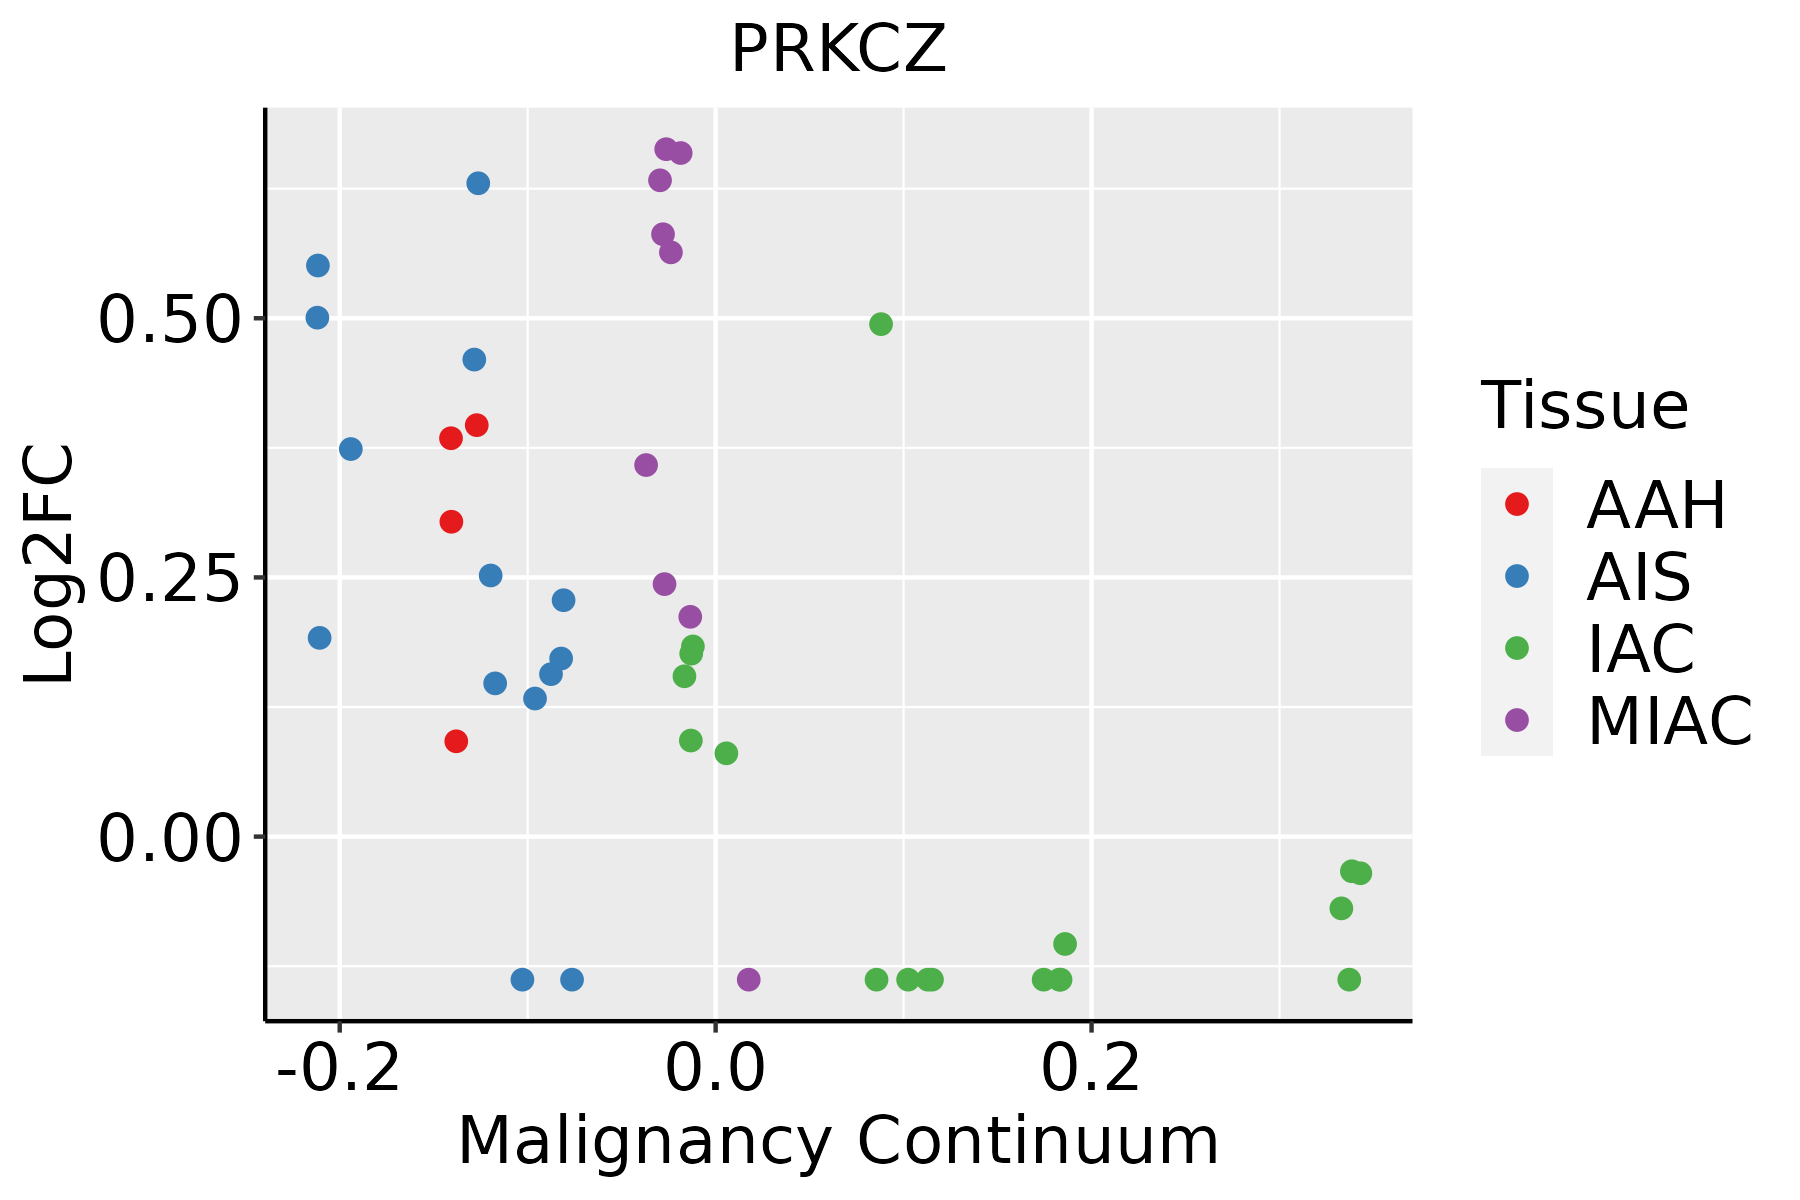 | AAH: Atypical adenomatous hyperplasia |
| AIS: Adenocarcinoma in situ | ||
| IAC: Invasive lung adenocarcinoma | ||
| MIA: Minimally invasive adenocarcinoma | ||
| Oral Cavity |  | EOLP: Erosive Oral lichen planus |
| LP: leukoplakia | ||
| NEOLP: Non-erosive oral lichen planus | ||
| OSCC: Oral squamous cell carcinoma | ||
| Thyroid | 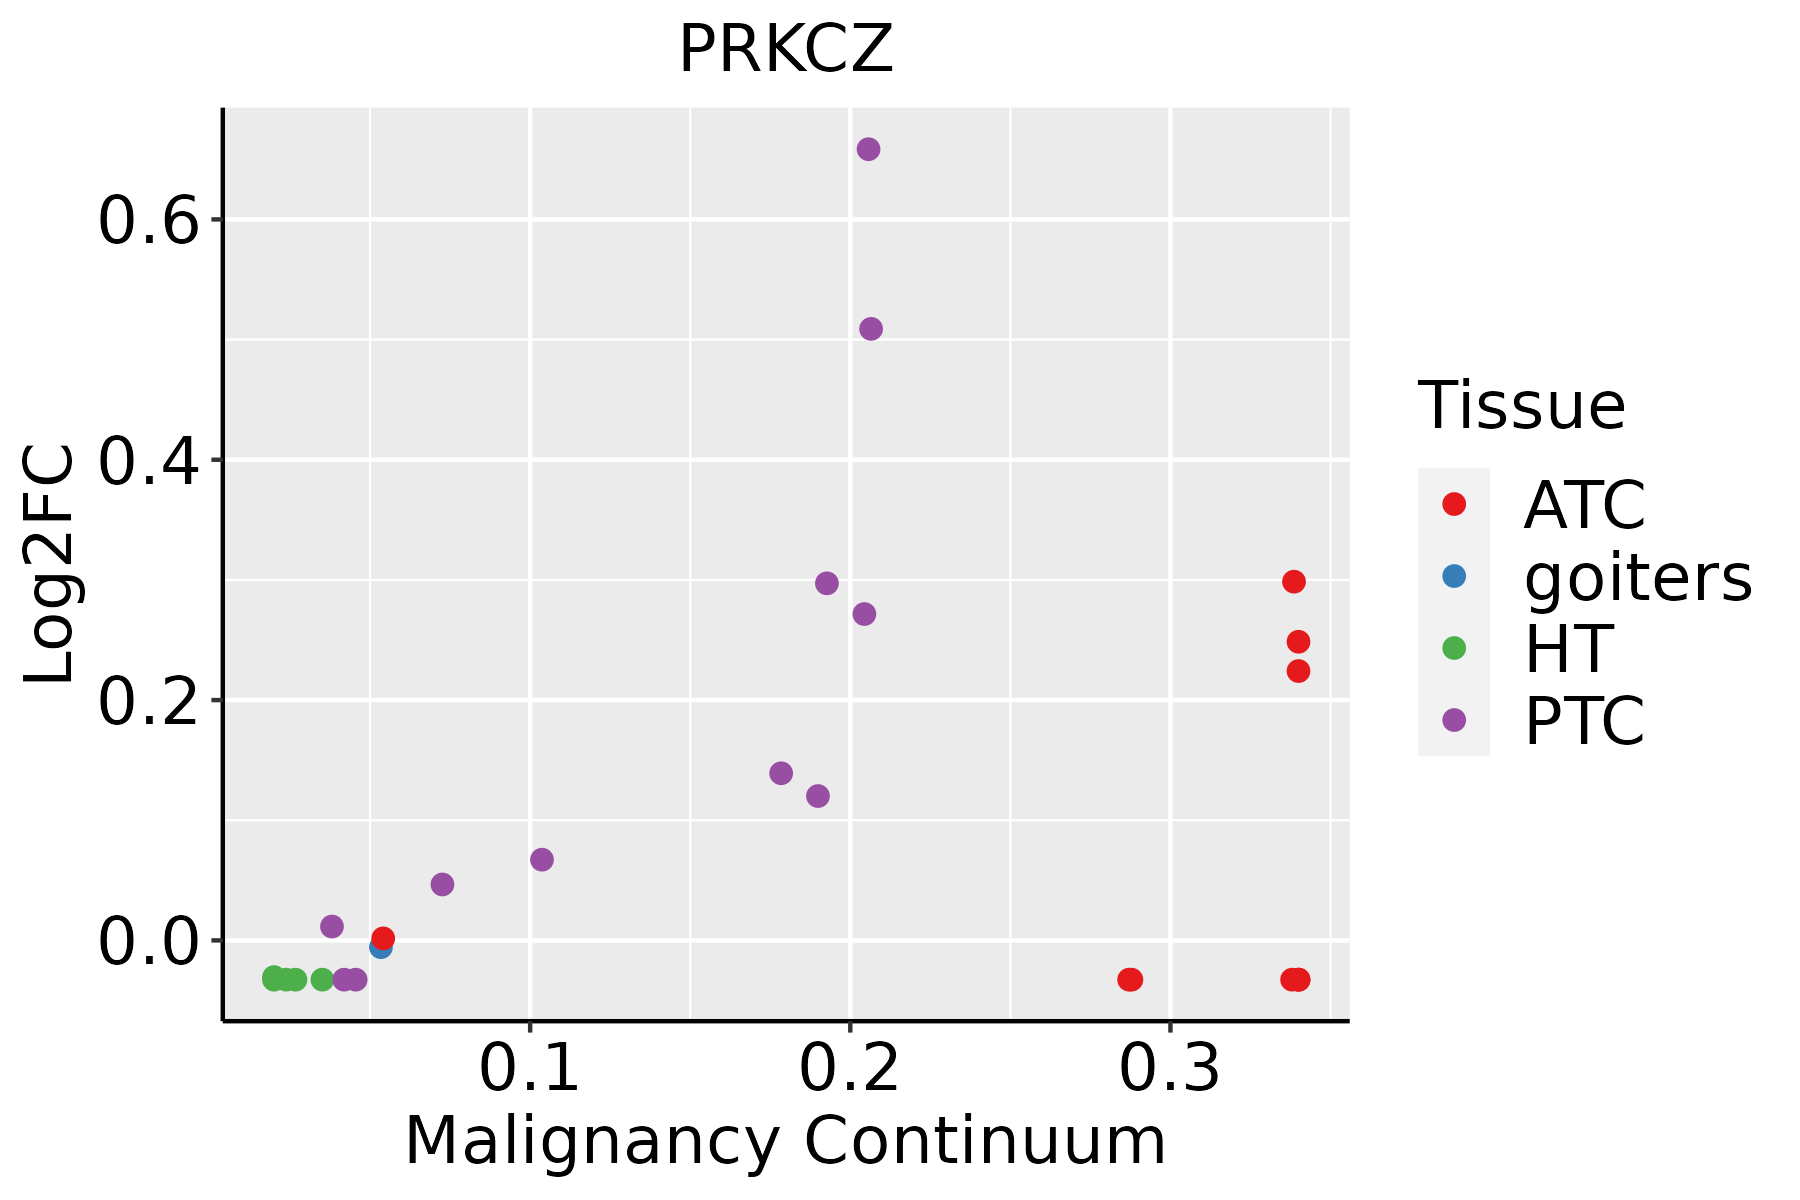 | ATC: Anaplastic thyroid cancer |
| HT: Hashimoto's thyroiditis | ||
| PTC: Papillary thyroid cancer |
| ∗log2FC in expression of this searched gene in stem-like cells from each diseased tissue sample relative to stem-like cells in normal samples in each tissue plotted against the malignancy continuum. Samples are colored based on if they are from different disease stage. |
Top |
Malignant transformation related pathway analysis |
| Find out the enriched GO biological processes and KEGG pathways involved in transition from healthy to precancer to cancer |
| Tissue | Disease Stage | Enriched GO biological Processes |
| Colorectum | AD |  |
| Colorectum | SER |  |
| Colorectum | MSS |  |
| Colorectum | MSI-H |  |
| Colorectum | FAP |  |
| ∗Top 15 enriched GO BP terms are showed in the bar plot of each disease state in each tissue. Each row represents a significant GO biological process which is colored according to the -log10(p.adjust). |
| Page: 1 2 3 4 5 6 7 8 9 |
| GO ID | Tissue | Disease Stage | Description | Gene Ratio | Bg Ratio | pvalue | p.adjust | Count |
| GO:005165616 | Esophagus | HGIN | establishment of organelle localization | 90/2587 | 390/18723 | 4.27e-07 | 1.94e-05 | 90 |
| GO:004325427 | Esophagus | HGIN | regulation of protein-containing complex assembly | 94/2587 | 428/18723 | 2.39e-06 | 8.55e-05 | 94 |
| GO:190495120 | Esophagus | HGIN | positive regulation of establishment of protein localization | 73/2587 | 319/18723 | 6.99e-06 | 2.14e-04 | 73 |
| GO:007265920 | Esophagus | HGIN | protein localization to plasma membrane | 66/2587 | 284/18723 | 1.11e-05 | 3.18e-04 | 66 |
| GO:005122220 | Esophagus | HGIN | positive regulation of protein transport | 67/2587 | 303/18723 | 5.13e-05 | 1.22e-03 | 67 |
| GO:190547518 | Esophagus | HGIN | regulation of protein localization to membrane | 43/2587 | 175/18723 | 9.45e-05 | 2.03e-03 | 43 |
| GO:199077818 | Esophagus | HGIN | protein localization to cell periphery | 71/2587 | 333/18723 | 1.05e-04 | 2.24e-03 | 71 |
| GO:004593626 | Esophagus | HGIN | negative regulation of phosphate metabolic process | 89/2587 | 441/18723 | 1.24e-04 | 2.54e-03 | 89 |
| GO:001056326 | Esophagus | HGIN | negative regulation of phosphorus metabolic process | 89/2587 | 442/18723 | 1.34e-04 | 2.71e-03 | 89 |
| GO:00315035 | Esophagus | HGIN | protein-containing complex localization | 50/2587 | 220/18723 | 2.18e-04 | 3.98e-03 | 50 |
| GO:004232620 | Esophagus | HGIN | negative regulation of phosphorylation | 78/2587 | 385/18723 | 2.77e-04 | 4.77e-03 | 78 |
| GO:003070517 | Esophagus | HGIN | cytoskeleton-dependent intracellular transport | 45/2587 | 195/18723 | 3.07e-04 | 5.15e-03 | 45 |
| GO:190437518 | Esophagus | HGIN | regulation of protein localization to cell periphery | 32/2587 | 125/18723 | 3.23e-04 | 5.39e-03 | 32 |
| GO:001604919 | Esophagus | HGIN | cell growth | 93/2587 | 482/18723 | 4.49e-04 | 6.62e-03 | 93 |
| GO:000193320 | Esophagus | HGIN | negative regulation of protein phosphorylation | 69/2587 | 342/18723 | 6.81e-04 | 9.26e-03 | 69 |
| GO:004343420 | Esophagus | HGIN | response to peptide hormone | 79/2587 | 414/18723 | 1.60e-03 | 1.79e-02 | 79 |
| GO:00109707 | Esophagus | HGIN | transport along microtubule | 35/2587 | 155/18723 | 2.01e-03 | 2.12e-02 | 35 |
| GO:003133320 | Esophagus | HGIN | negative regulation of protein-containing complex assembly | 32/2587 | 141/18723 | 2.80e-03 | 2.74e-02 | 32 |
| GO:005134620 | Esophagus | HGIN | negative regulation of hydrolase activity | 72/2587 | 379/18723 | 2.81e-03 | 2.75e-02 | 72 |
| GO:190165318 | Esophagus | HGIN | cellular response to peptide | 68/2587 | 359/18723 | 3.88e-03 | 3.54e-02 | 68 |
| Page: 1 2 3 4 5 6 7 8 9 10 11 12 13 14 15 16 17 18 19 20 |
| Pathway ID | Tissue | Disease Stage | Description | Gene Ratio | Bg Ratio | pvalue | p.adjust | qvalue | Count |
| hsa0541530 | Esophagus | HGIN | Diabetic cardiomyopathy | 80/1383 | 203/8465 | 1.35e-15 | 3.38e-14 | 2.69e-14 | 80 |
| hsa0414429 | Esophagus | HGIN | Endocytosis | 76/1383 | 251/8465 | 1.74e-08 | 3.34e-07 | 2.65e-07 | 76 |
| hsa0541839 | Esophagus | HGIN | Fluid shear stress and atherosclerosis | 42/1383 | 139/8465 | 2.92e-05 | 3.81e-04 | 3.02e-04 | 42 |
| hsa0453039 | Esophagus | HGIN | Tight junction | 40/1383 | 169/8465 | 8.18e-03 | 4.71e-02 | 3.74e-02 | 40 |
| hsa05415114 | Esophagus | HGIN | Diabetic cardiomyopathy | 80/1383 | 203/8465 | 1.35e-15 | 3.38e-14 | 2.69e-14 | 80 |
| hsa04144113 | Esophagus | HGIN | Endocytosis | 76/1383 | 251/8465 | 1.74e-08 | 3.34e-07 | 2.65e-07 | 76 |
| hsa05418115 | Esophagus | HGIN | Fluid shear stress and atherosclerosis | 42/1383 | 139/8465 | 2.92e-05 | 3.81e-04 | 3.02e-04 | 42 |
| hsa04530115 | Esophagus | HGIN | Tight junction | 40/1383 | 169/8465 | 8.18e-03 | 4.71e-02 | 3.74e-02 | 40 |
| hsa04144210 | Esophagus | ESCC | Endocytosis | 186/4205 | 251/8465 | 9.74e-16 | 4.66e-14 | 2.39e-14 | 186 |
| hsa05418211 | Esophagus | ESCC | Fluid shear stress and atherosclerosis | 109/4205 | 139/8465 | 2.00e-12 | 3.72e-11 | 1.90e-11 | 109 |
| hsa05415211 | Esophagus | ESCC | Diabetic cardiomyopathy | 146/4205 | 203/8465 | 5.81e-11 | 7.78e-10 | 3.99e-10 | 146 |
| hsa0516510 | Esophagus | ESCC | Human papillomavirus infection | 215/4205 | 331/8465 | 7.86e-09 | 7.12e-08 | 3.65e-08 | 215 |
| hsa0407116 | Esophagus | ESCC | Sphingolipid signaling pathway | 85/4205 | 121/8465 | 3.04e-06 | 1.73e-05 | 8.84e-06 | 85 |
| hsa0493310 | Esophagus | ESCC | AGE-RAGE signaling pathway in diabetic complications | 72/4205 | 100/8465 | 4.15e-06 | 2.28e-05 | 1.17e-05 | 72 |
| hsa049109 | Esophagus | ESCC | Insulin signaling pathway | 89/4205 | 137/8465 | 1.97e-04 | 7.32e-04 | 3.75e-04 | 89 |
| hsa04530211 | Esophagus | ESCC | Tight junction | 105/4205 | 169/8465 | 6.73e-04 | 2.23e-03 | 1.14e-03 | 105 |
| hsa049268 | Esophagus | ESCC | Relaxin signaling pathway | 81/4205 | 129/8465 | 1.72e-03 | 5.09e-03 | 2.61e-03 | 81 |
| hsa049318 | Esophagus | ESCC | Insulin resistance | 69/4205 | 108/8465 | 1.92e-03 | 5.54e-03 | 2.84e-03 | 69 |
| hsa0436016 | Esophagus | ESCC | Axon guidance | 108/4205 | 182/8465 | 5.13e-03 | 1.30e-02 | 6.67e-03 | 108 |
| hsa0439018 | Esophagus | ESCC | Hippo signaling pathway | 92/4205 | 157/8465 | 1.46e-02 | 3.31e-02 | 1.69e-02 | 92 |
| Page: 1 2 3 4 5 |
Top |
Cell-cell communication analysis |
| Identification of potential cell-cell interactions between two cell types and their ligand-receptor pairs for different disease states |
| Ligand | Receptor | LRpair | Pathway | Tissue | Disease Stage |
| Page: 1 |
Top |
Single-cell gene regulatory network inference analysis |
| Find out the significant the regulons (TFs) and the target genes of each regulon across cell types for different disease states |
| TF | Cell Type | Tissue | Disease Stage | Target Gene | RSS | Regulon Activity |
| ∗The dot plots of a searched regulon are shown for all cell subpopulations in each disease state of each tissue based on the regulon specific score inferred using pySCENIC and by calculating the average expression. |
| Page: 1 |
Top |
Somatic mutation of malignant transformation related genes |
| Annotation of somatic variants for genes involved in malignant transformation |
| Hugo Symbol | Variant Class | Variant Classification | dbSNP RS | HGVSc | HGVSp | HGVSp Short | SWISSPROT | BIOTYPE | SIFT | PolyPhen | Tumor Sample Barcode | Tissue | Histology | Sex | Age | Stage | Therapy Types | Drugs | Outcome |
| PRKCZ | SNV | Missense_Mutation | rs75260030 | c.376N>G | p.Tyr126Asp | p.Y126D | Q05513 | protein_coding | deleterious(0) | probably_damaging(0.917) | TCGA-A2-A0YJ-01 | Breast | breast invasive carcinoma | Female | <65 | III/IV | Chemotherapy | cytoxan | PD |
| PRKCZ | SNV | Missense_Mutation | novel | c.1201N>C | p.Gly401Arg | p.G401R | Q05513 | protein_coding | deleterious(0) | possibly_damaging(0.837) | TCGA-A2-A3Y0-01 | Breast | breast invasive carcinoma | Female | <65 | I/II | Chemotherapy | adriamycin | CR |
| PRKCZ | SNV | Missense_Mutation | rs75260030 | c.376T>G | p.Tyr126Asp | p.Y126D | Q05513 | protein_coding | deleterious(0) | probably_damaging(0.917) | TCGA-AO-A12H-01 | Breast | breast invasive carcinoma | Female | >=65 | I/II | Hormone Therapy | arimidex | SD |
| PRKCZ | SNV | Missense_Mutation | rs75260030 | c.376N>G | p.Tyr126Asp | p.Y126D | Q05513 | protein_coding | deleterious(0) | probably_damaging(0.917) | TCGA-B6-A0WS-01 | Breast | breast invasive carcinoma | Female | <65 | I/II | Unknown | Unknown | SD |
| PRKCZ | SNV | Missense_Mutation | rs75260030 | c.376N>G | p.Tyr126Asp | p.Y126D | Q05513 | protein_coding | deleterious(0) | probably_damaging(0.917) | TCGA-BH-A0B7-01 | Breast | breast invasive carcinoma | Female | <65 | I/II | Chemotherapy | adriamycin | CR |
| PRKCZ | SNV | Missense_Mutation | rs75260030 | c.376N>G | p.Tyr126Asp | p.Y126D | Q05513 | protein_coding | deleterious(0) | probably_damaging(0.917) | TCGA-BH-A0BF-01 | Breast | breast invasive carcinoma | Female | <65 | I/II | Unknown | Unknown | SD |
| PRKCZ | SNV | Missense_Mutation | rs75260030 | c.376N>G | p.Tyr126Asp | p.Y126D | Q05513 | protein_coding | deleterious(0) | probably_damaging(0.917) | TCGA-BH-A0C7-01 | Breast | breast invasive carcinoma | Female | <65 | I/II | Chemotherapy | adriamycin | CR |
| PRKCZ | SNV | Missense_Mutation | rs75260030 | c.376N>G | p.Tyr126Asp | p.Y126D | Q05513 | protein_coding | deleterious(0) | probably_damaging(0.917) | TCGA-BH-A0DE-01 | Breast | breast invasive carcinoma | Female | <65 | I/II | Unknown | Unknown | SD |
| PRKCZ | SNV | Missense_Mutation | rs75260030 | c.376N>G | p.Tyr126Asp | p.Y126D | Q05513 | protein_coding | deleterious(0) | probably_damaging(0.917) | TCGA-C8-A12M-01 | Breast | breast invasive carcinoma | Female | >=65 | I/II | Unknown | Unknown | SD |
| PRKCZ | SNV | Missense_Mutation | rs75260030 | c.376N>G | p.Tyr126Asp | p.Y126D | Q05513 | protein_coding | deleterious(0) | probably_damaging(0.917) | TCGA-E2-A10A-01 | Breast | breast invasive carcinoma | Female | <65 | I/II | Hormone Therapy | zoladex | SD |
| Page: 1 2 3 4 5 6 7 |
Top |
Related drugs of malignant transformation related genes |
| Identification of chemicals and drugs interact with genes involved in malignant transfromation |
| (DGIdb 4.0) |
| Entrez ID | Symbol | Category | Interaction Types | Drug Claim Name | Drug Name | PMIDs |
| 5590 | PRKCZ | DRUGGABLE GENOME, KINASE, TRANSPORTER, ENZYME, SERINE THREONINE KINASE | CENISERTIB | CENISERTIB | ||
| 5590 | PRKCZ | DRUGGABLE GENOME, KINASE, TRANSPORTER, ENZYME, SERINE THREONINE KINASE | inhibitor | CHEMBL608533 | MIDOSTAURIN | |
| 5590 | PRKCZ | DRUGGABLE GENOME, KINASE, TRANSPORTER, ENZYME, SERINE THREONINE KINASE | inhibitor | CHEMBL574737 | UCN-01 | |
| 5590 | PRKCZ | DRUGGABLE GENOME, KINASE, TRANSPORTER, ENZYME, SERINE THREONINE KINASE | inhibitor | 178101880 | ||
| 5590 | PRKCZ | DRUGGABLE GENOME, KINASE, TRANSPORTER, ENZYME, SERINE THREONINE KINASE | inhibitor | SOPHORETIN | QUERCETIN | |
| 5590 | PRKCZ | DRUGGABLE GENOME, KINASE, TRANSPORTER, ENZYME, SERINE THREONINE KINASE | SOTRASTAURIN | SOTRASTAURIN | ||
| 5590 | PRKCZ | DRUGGABLE GENOME, KINASE, TRANSPORTER, ENZYME, SERINE THREONINE KINASE | INGENOL MEBUTATE | |||
| 5590 | PRKCZ | DRUGGABLE GENOME, KINASE, TRANSPORTER, ENZYME, SERINE THREONINE KINASE | PHA-767491 | CHEMBL225519 | ||
| 5590 | PRKCZ | DRUGGABLE GENOME, KINASE, TRANSPORTER, ENZYME, SERINE THREONINE KINASE | US8889672, 252-036-001 | |||
| 5590 | PRKCZ | DRUGGABLE GENOME, KINASE, TRANSPORTER, ENZYME, SERINE THREONINE KINASE | inhibitor | CHEMBL3545332 | CEP-2563 |
| Page: 1 2 3 |

Copyright 2023-Present -The University of Texas Health Science Center at Houston |