
|
|||||
|
 | |
| |
| |
| |
| |
| |
|
Gene: PRKCSH |
Gene summary for PRKCSH |
| Gene information | Species | Human | Gene symbol | PRKCSH | Gene ID | 5589 |
| Gene name | protein kinase C substrate 80K-H | |
| Gene Alias | AGE-R2 | |
| Cytomap | 19p13.2 | |
| Gene Type | protein-coding | GO ID | GO:0001889 | UniProtAcc | P14314 |
Top |
Malignant transformation analysis |
| Identification of the aberrant gene expression in precancerous and cancerous lesions by comparing the gene expression of stem-like cells in diseased tissues with normal stem cells |
| Entrez ID | Symbol | Replicates | Species | Organ | Tissue | Adj P-value | Log2FC | Malignancy |
| 5589 | PRKCSH | HTA11_3410_2000001011 | Human | Colorectum | AD | 4.66e-04 | 2.02e-01 | 0.0155 |
| 5589 | PRKCSH | HTA11_2487_2000001011 | Human | Colorectum | SER | 6.92e-11 | 4.94e-01 | -0.1808 |
| 5589 | PRKCSH | HTA11_1938_2000001011 | Human | Colorectum | AD | 2.45e-09 | 5.43e-01 | -0.0811 |
| 5589 | PRKCSH | HTA11_347_2000001011 | Human | Colorectum | AD | 2.81e-14 | 4.82e-01 | -0.1954 |
| 5589 | PRKCSH | HTA11_411_2000001011 | Human | Colorectum | SER | 4.61e-05 | 8.12e-01 | -0.2602 |
| 5589 | PRKCSH | HTA11_3361_2000001011 | Human | Colorectum | AD | 1.01e-05 | 4.15e-01 | -0.1207 |
| 5589 | PRKCSH | HTA11_696_2000001011 | Human | Colorectum | AD | 2.79e-29 | 6.15e-01 | -0.1464 |
| 5589 | PRKCSH | HTA11_866_2000001011 | Human | Colorectum | AD | 3.90e-12 | 4.00e-01 | -0.1001 |
| 5589 | PRKCSH | HTA11_1391_2000001011 | Human | Colorectum | AD | 1.03e-08 | 5.53e-01 | -0.059 |
| 5589 | PRKCSH | HTA11_546_2000001011 | Human | Colorectum | AD | 6.14e-06 | 5.09e-01 | -0.0842 |
| 5589 | PRKCSH | HTA11_866_3004761011 | Human | Colorectum | AD | 5.73e-08 | 4.36e-01 | 0.096 |
| 5589 | PRKCSH | HTA11_7663_2000001011 | Human | Colorectum | SER | 2.41e-02 | 3.81e-01 | 0.0131 |
| 5589 | PRKCSH | HTA11_10623_2000001011 | Human | Colorectum | AD | 3.26e-10 | 6.95e-01 | -0.0177 |
| 5589 | PRKCSH | HTA11_10711_2000001011 | Human | Colorectum | AD | 8.19e-15 | 6.81e-01 | 0.0338 |
| 5589 | PRKCSH | HTA11_7696_3000711011 | Human | Colorectum | AD | 1.87e-23 | 5.80e-01 | 0.0674 |
| 5589 | PRKCSH | HTA11_6818_2000001011 | Human | Colorectum | AD | 1.66e-02 | 3.94e-01 | 0.0112 |
| 5589 | PRKCSH | HTA11_7469_2000001011 | Human | Colorectum | AD | 1.21e-06 | 8.33e-01 | -0.0124 |
| 5589 | PRKCSH | HTA11_6818_2000001021 | Human | Colorectum | AD | 1.07e-03 | 2.25e-01 | 0.0588 |
| 5589 | PRKCSH | HTA11_99999970781_79442 | Human | Colorectum | MSS | 3.70e-07 | 2.29e-01 | 0.294 |
| 5589 | PRKCSH | HTA11_99999965062_69753 | Human | Colorectum | MSI-H | 3.57e-06 | 7.08e-01 | 0.3487 |
| Page: 1 2 3 4 5 6 7 8 9 |
| Tissue | Expression Dynamics | Abbreviation |
| Colorectum (GSE201348) |  | FAP: Familial adenomatous polyposis |
| CRC: Colorectal cancer | ||
| Colorectum (HTA11) |  | AD: Adenomas |
| SER: Sessile serrated lesions | ||
| MSI-H: Microsatellite-high colorectal cancer | ||
| MSS: Microsatellite stable colorectal cancer | ||
| Endometrium | 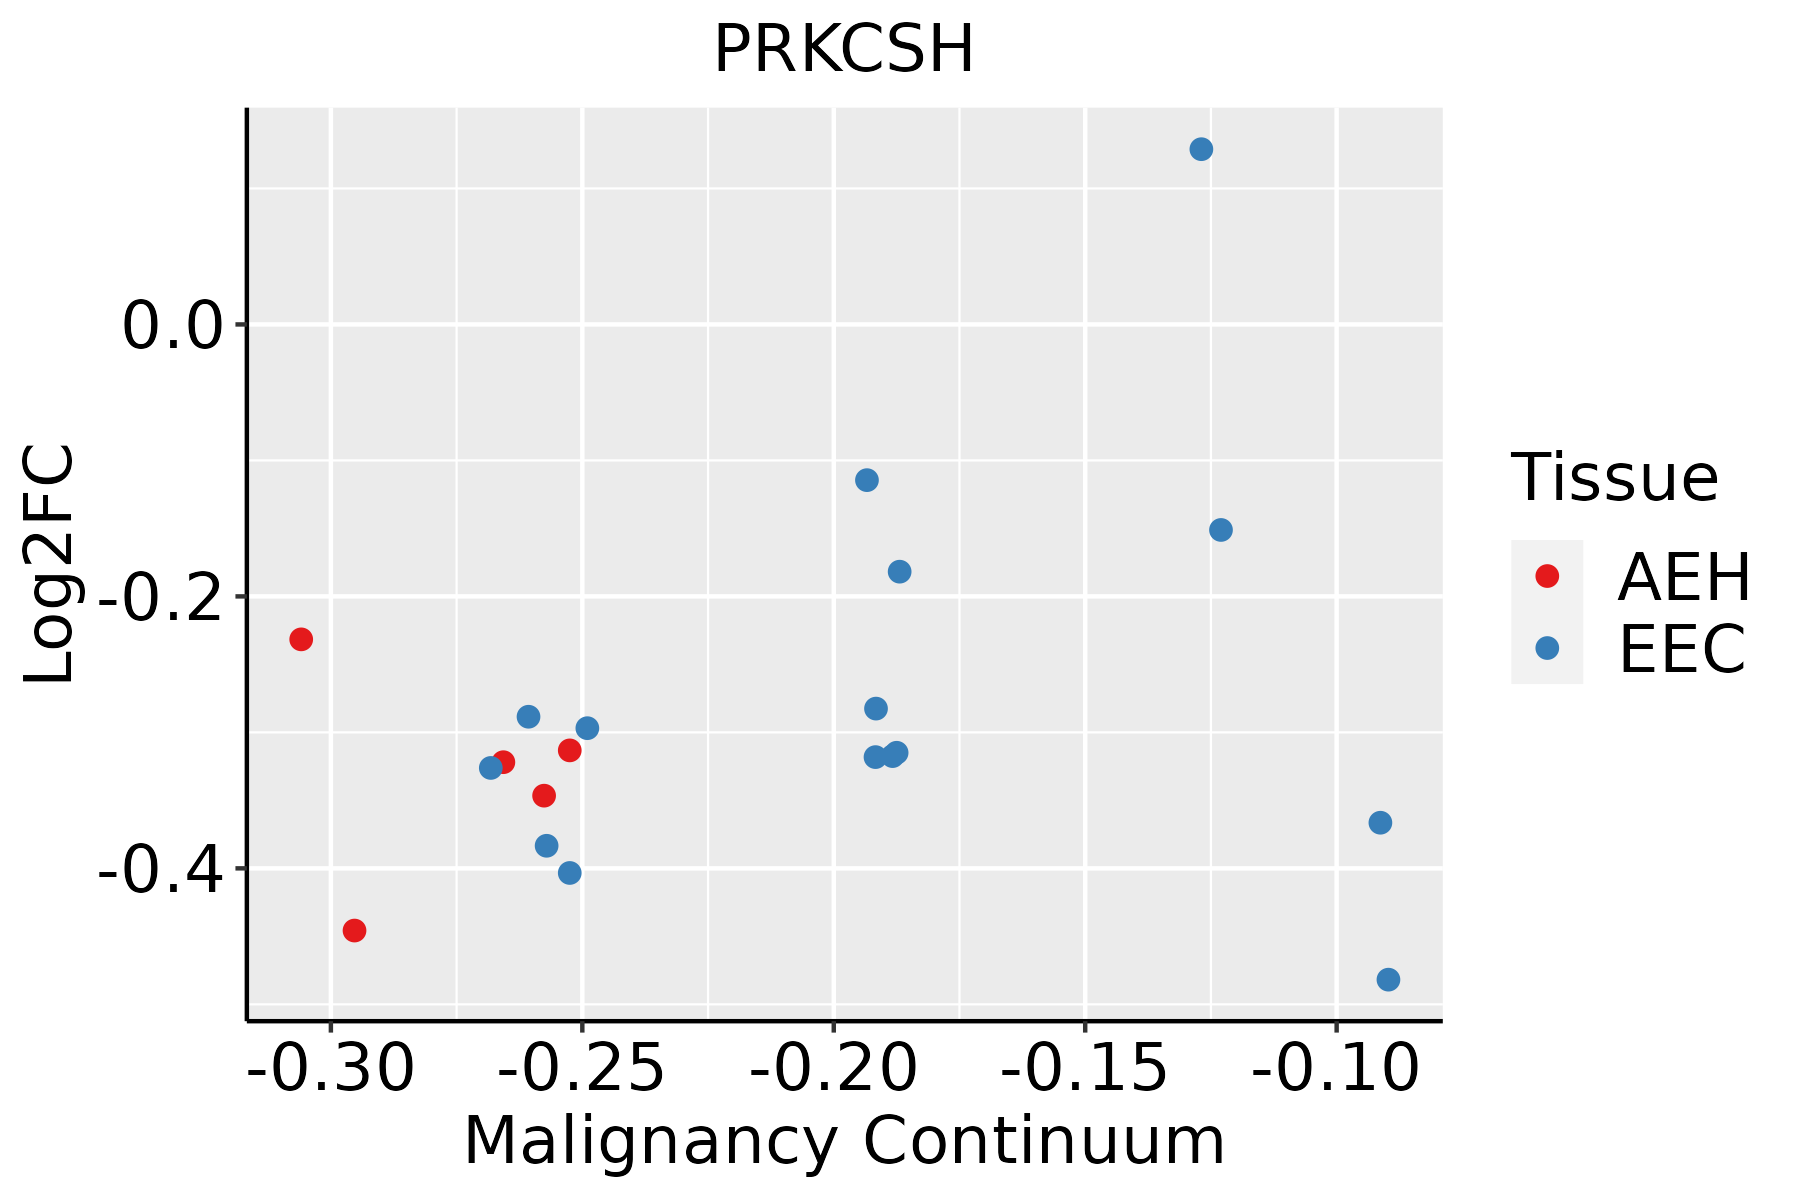 | AEH: Atypical endometrial hyperplasia |
| EEC: Endometrioid Cancer | ||
| Esophagus | 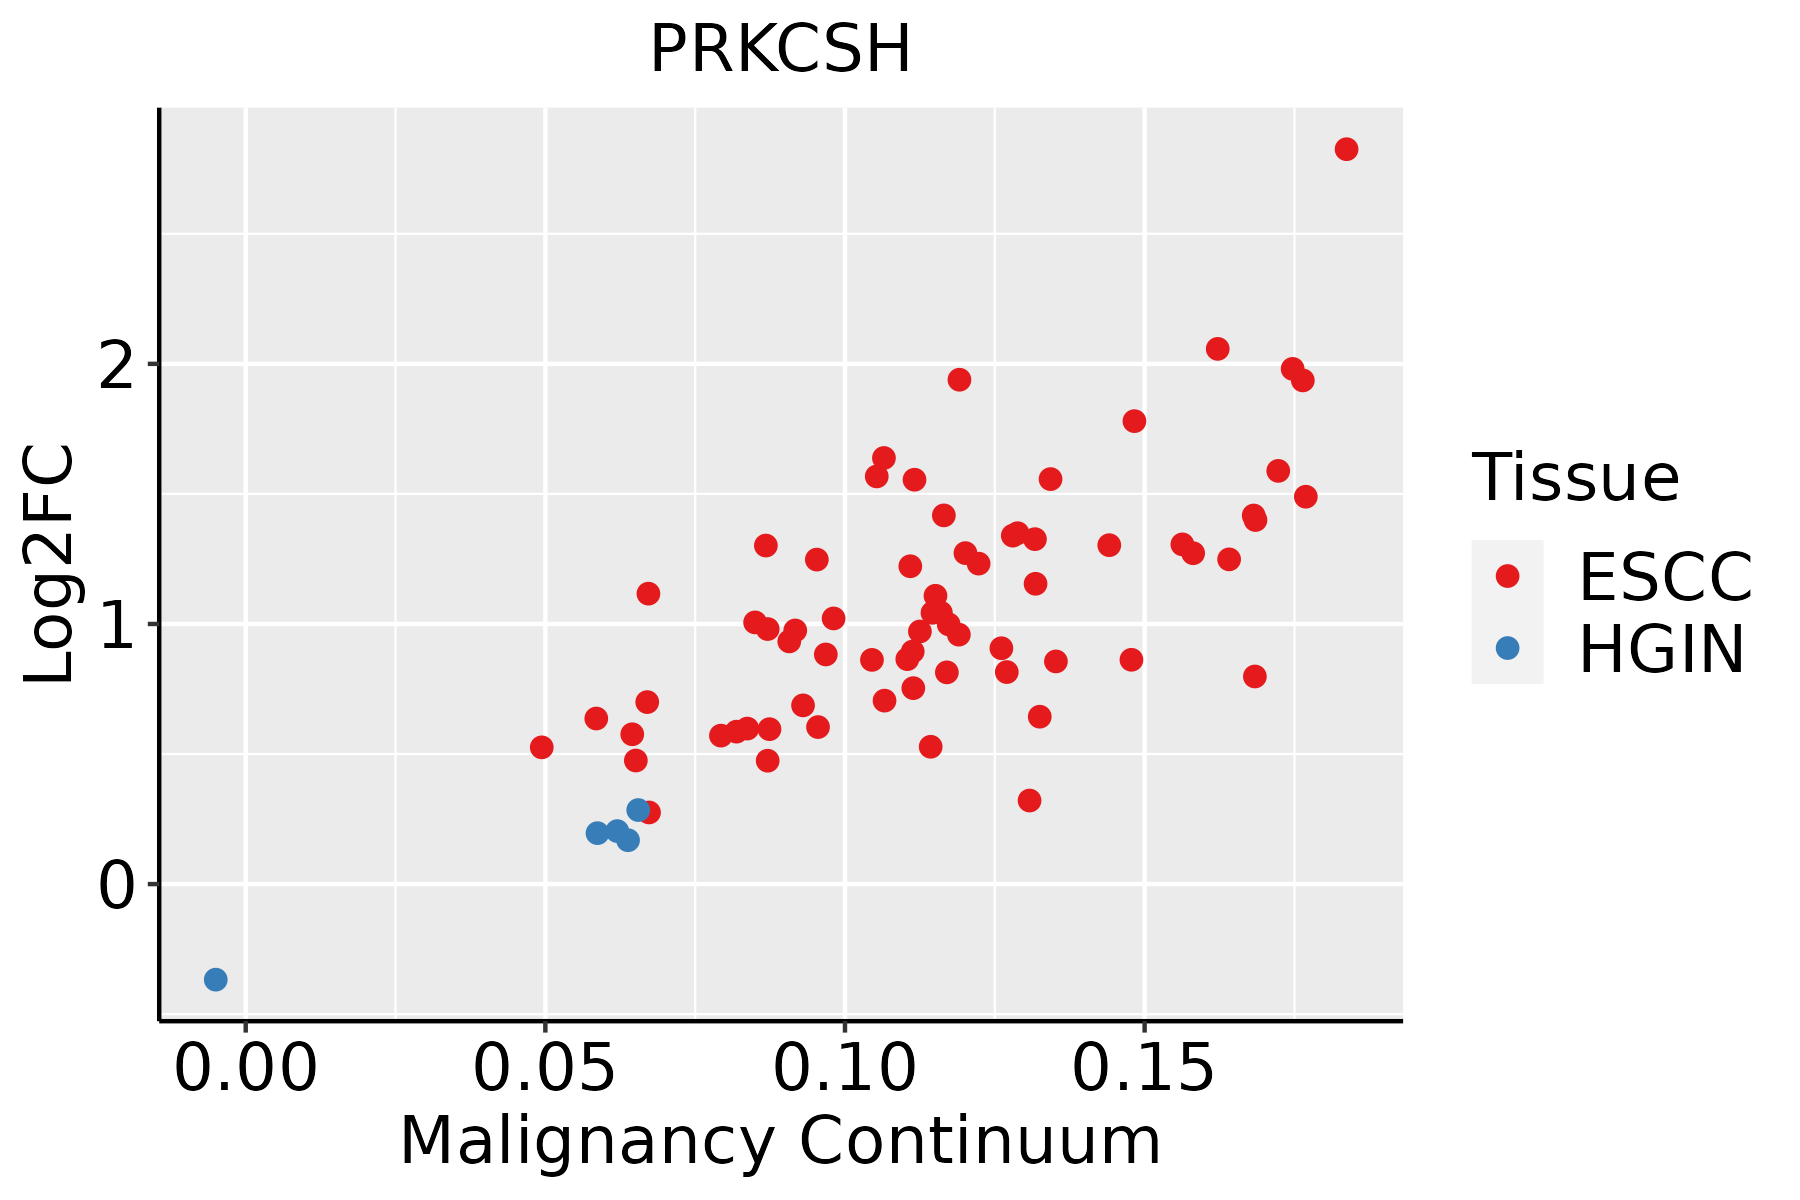 | ESCC: Esophageal squamous cell carcinoma |
| HGIN: High-grade intraepithelial neoplasias | ||
| LGIN: Low-grade intraepithelial neoplasias | ||
| Liver |  | HCC: Hepatocellular carcinoma |
| NAFLD: Non-alcoholic fatty liver disease | ||
| Oral Cavity | 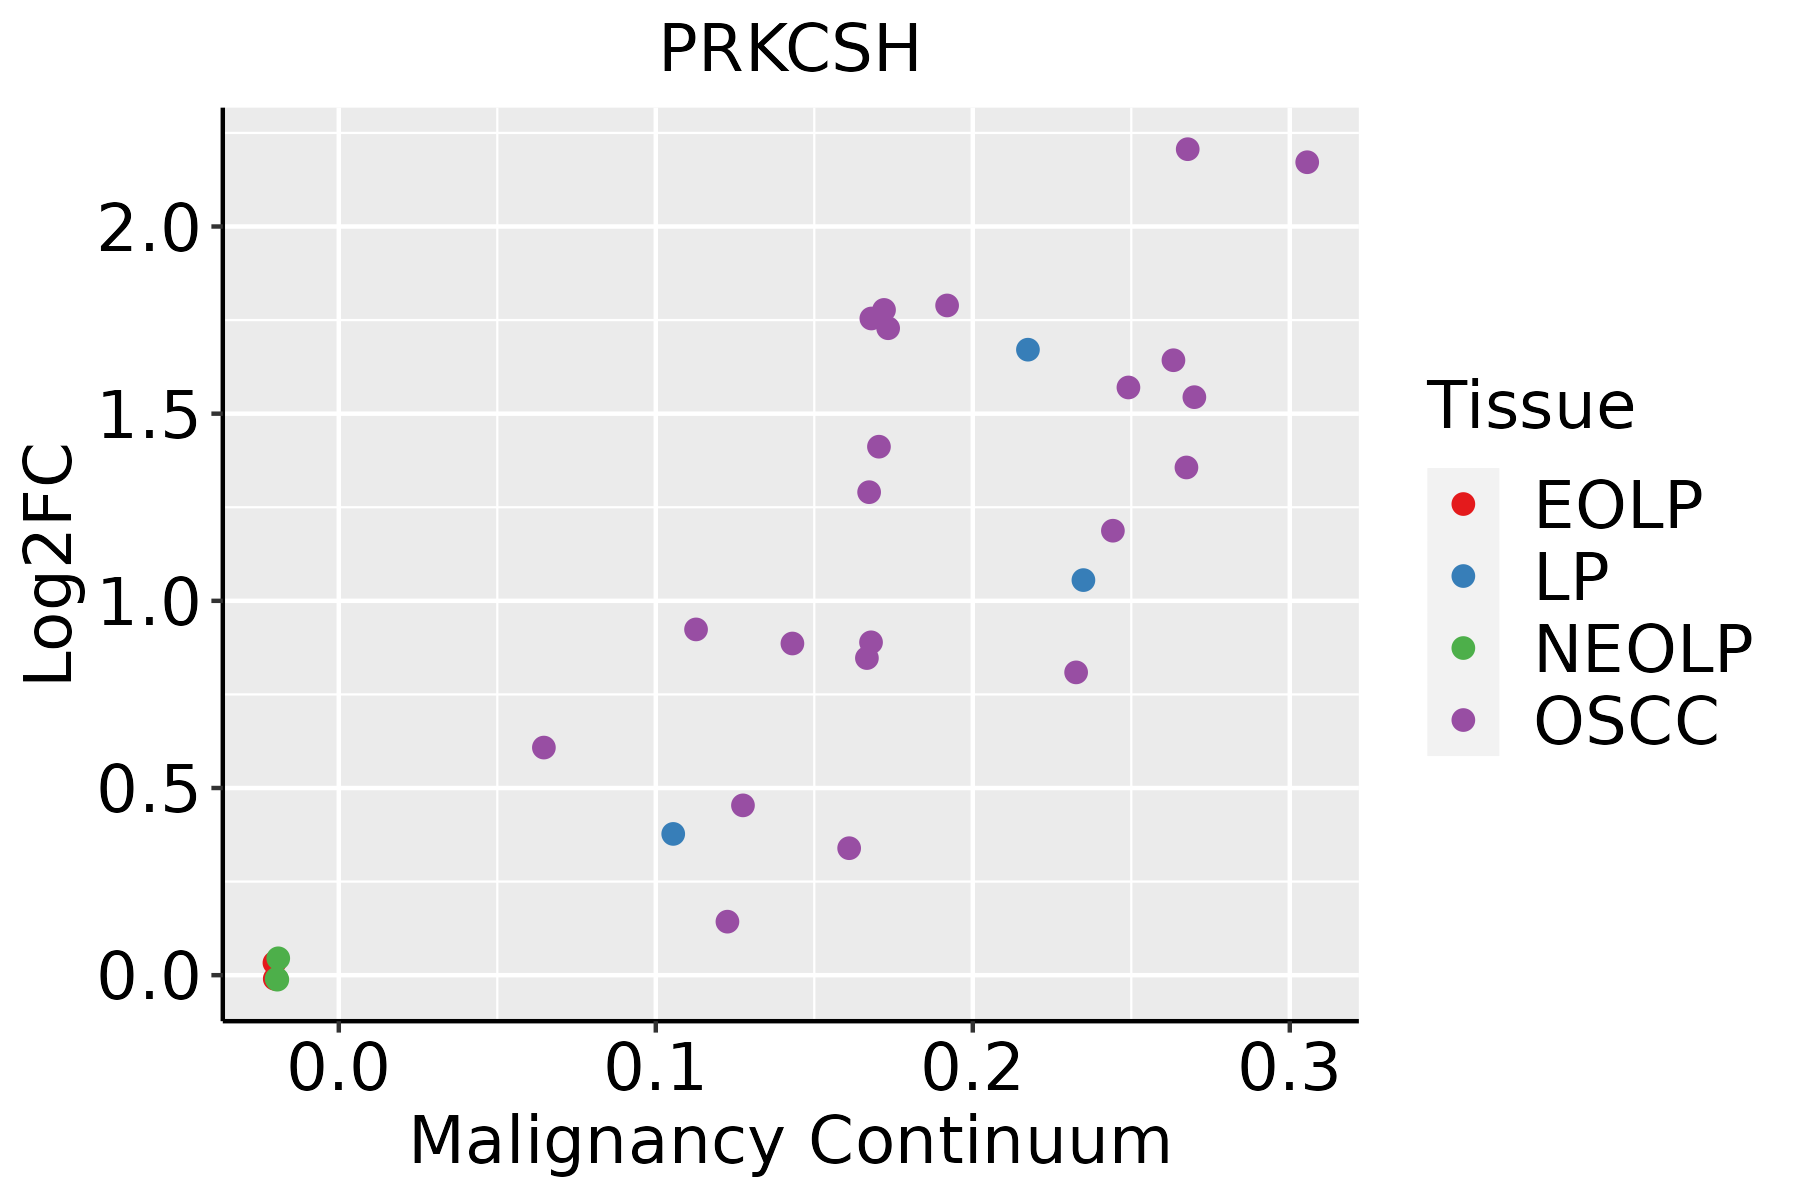 | EOLP: Erosive Oral lichen planus |
| LP: leukoplakia | ||
| NEOLP: Non-erosive oral lichen planus | ||
| OSCC: Oral squamous cell carcinoma | ||
| Prostate | 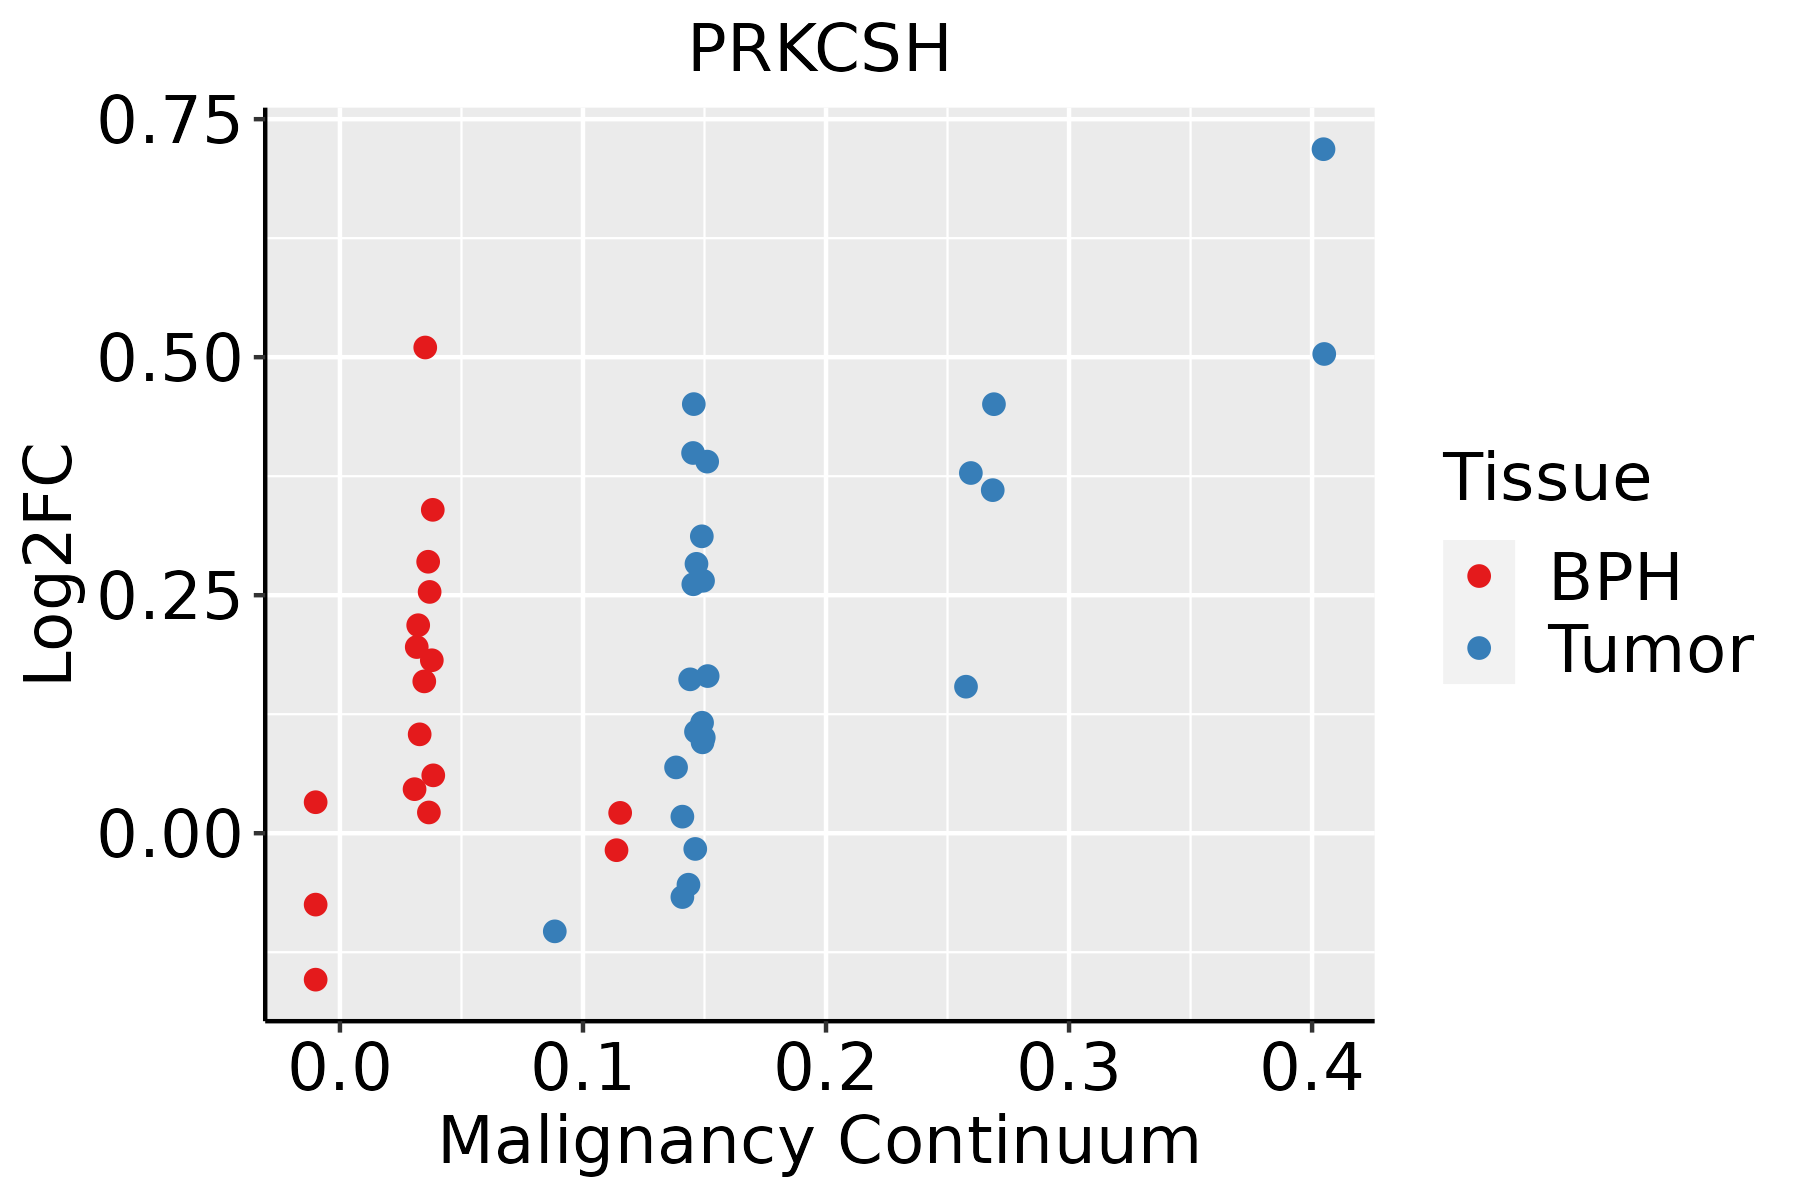 | BPH: Benign Prostatic Hyperplasia |
| Skin | 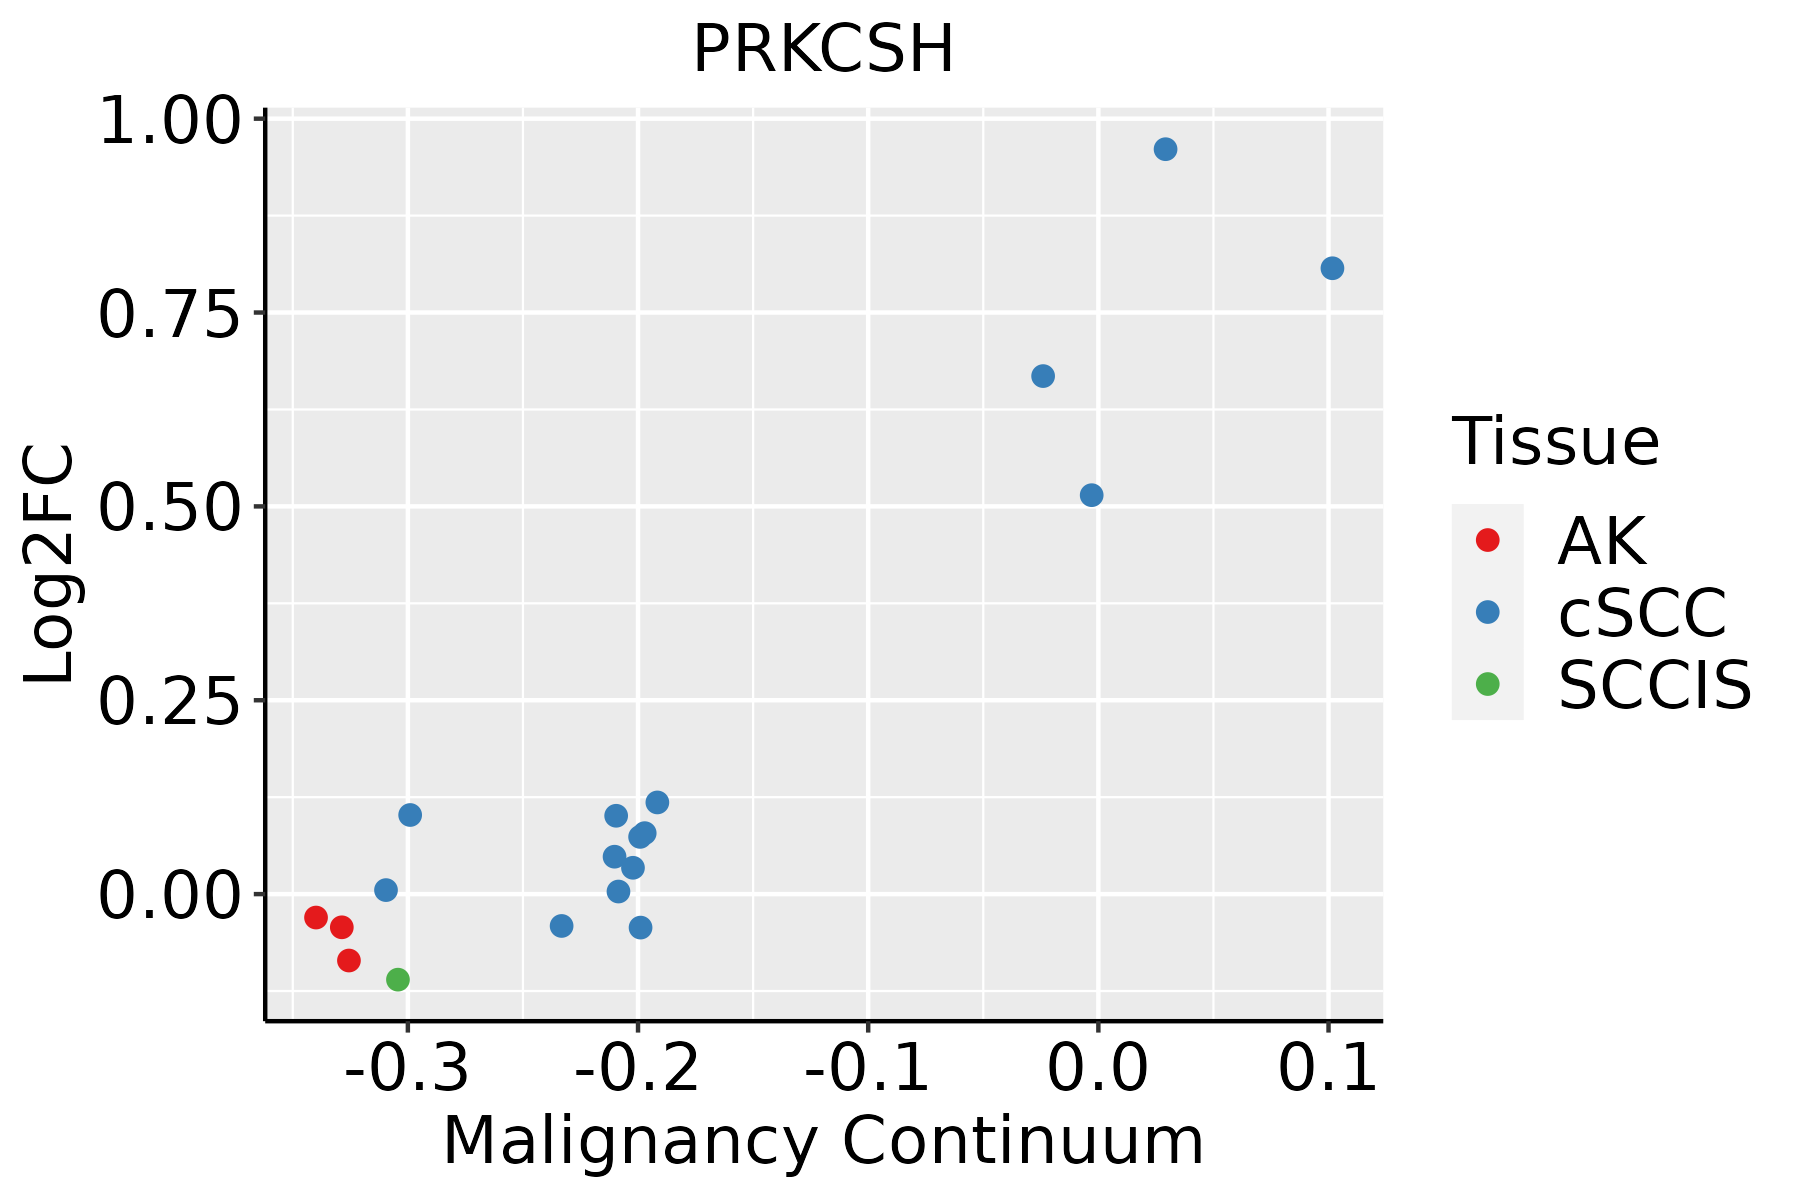 | AK: Actinic keratosis |
| cSCC: Cutaneous squamous cell carcinoma | ||
| SCCIS:squamous cell carcinoma in situ | ||
| Thyroid | 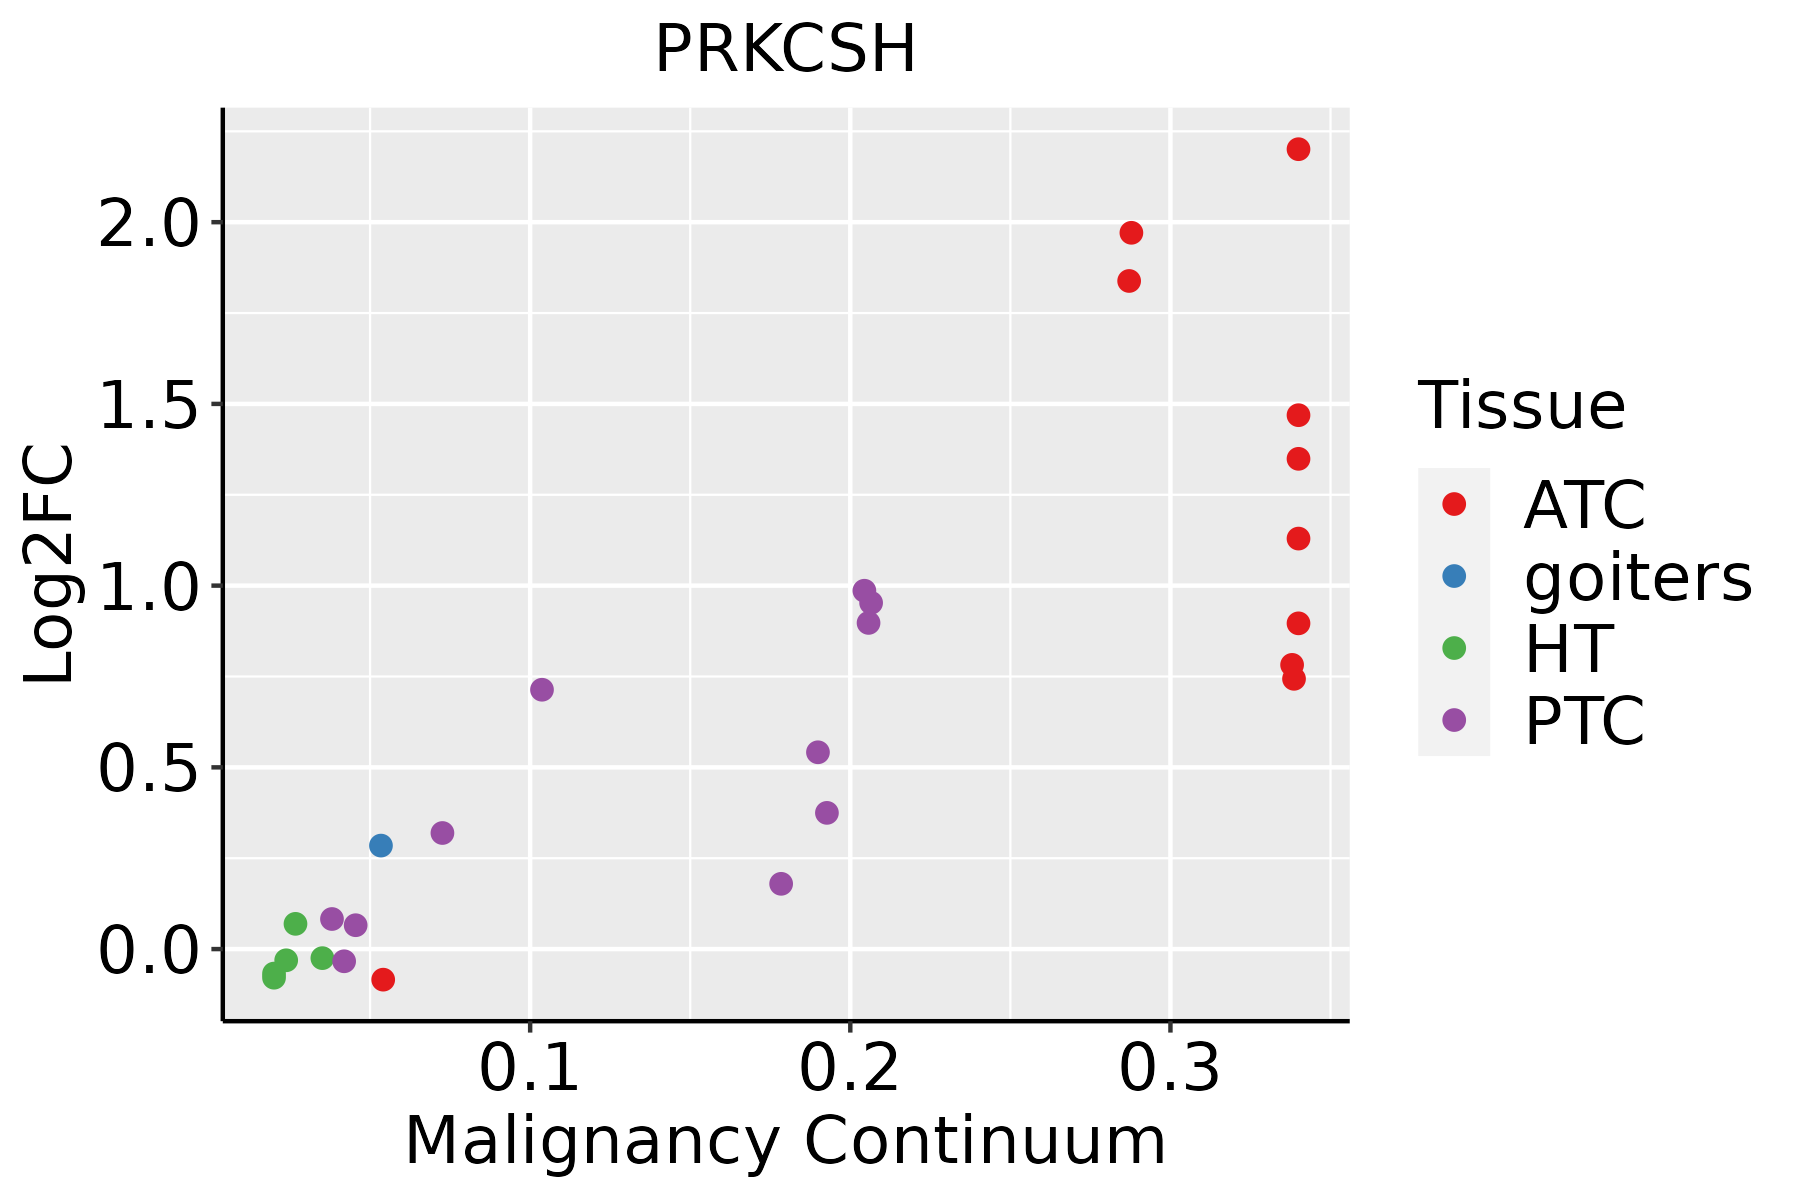 | ATC: Anaplastic thyroid cancer |
| HT: Hashimoto's thyroiditis | ||
| PTC: Papillary thyroid cancer |
| ∗log2FC in expression of this searched gene in stem-like cells from each diseased tissue sample relative to stem-like cells in normal samples in each tissue plotted against the malignancy continuum. Samples are colored based on if they are from different disease stage. |
Top |
Malignant transformation related pathway analysis |
| Find out the enriched GO biological processes and KEGG pathways involved in transition from healthy to precancer to cancer |
| Tissue | Disease Stage | Enriched GO biological Processes |
| Colorectum | AD |  |
| Colorectum | SER |  |
| Colorectum | MSS |  |
| Colorectum | MSI-H |  |
| Colorectum | FAP |  |
| ∗Top 15 enriched GO BP terms are showed in the bar plot of each disease state in each tissue. Each row represents a significant GO biological process which is colored according to the -log10(p.adjust). |
| Page: 1 2 3 4 5 6 7 8 9 |
| GO ID | Tissue | Disease Stage | Description | Gene Ratio | Bg Ratio | pvalue | p.adjust | Count |
| GO:0048732 | Colorectum | AD | gland development | 149/3918 | 436/18723 | 6.07e-11 | 6.33e-09 | 149 |
| GO:0061008 | Colorectum | AD | hepaticobiliary system development | 55/3918 | 150/18723 | 6.34e-06 | 1.59e-04 | 55 |
| GO:0001889 | Colorectum | AD | liver development | 54/3918 | 147/18723 | 7.20e-06 | 1.77e-04 | 54 |
| GO:00487321 | Colorectum | SER | gland development | 112/2897 | 436/18723 | 1.75e-08 | 1.28e-06 | 112 |
| GO:00610081 | Colorectum | SER | hepaticobiliary system development | 45/2897 | 150/18723 | 4.98e-06 | 1.85e-04 | 45 |
| GO:00018891 | Colorectum | SER | liver development | 44/2897 | 147/18723 | 6.73e-06 | 2.35e-04 | 44 |
| GO:00487322 | Colorectum | MSS | gland development | 143/3467 | 436/18723 | 3.85e-13 | 8.01e-11 | 143 |
| GO:00610082 | Colorectum | MSS | hepaticobiliary system development | 51/3467 | 150/18723 | 4.33e-06 | 1.23e-04 | 51 |
| GO:00018892 | Colorectum | MSS | liver development | 50/3467 | 147/18723 | 5.28e-06 | 1.44e-04 | 50 |
| GO:00018893 | Colorectum | MSI-H | liver development | 25/1319 | 147/18723 | 3.36e-05 | 1.31e-03 | 25 |
| GO:00610083 | Colorectum | MSI-H | hepaticobiliary system development | 25/1319 | 150/18723 | 4.76e-05 | 1.69e-03 | 25 |
| GO:00487323 | Colorectum | MSI-H | gland development | 53/1319 | 436/18723 | 7.08e-05 | 2.35e-03 | 53 |
| GO:004873216 | Endometrium | AEH | gland development | 83/2100 | 436/18723 | 8.62e-07 | 3.11e-05 | 83 |
| GO:006100810 | Endometrium | AEH | hepaticobiliary system development | 31/2100 | 150/18723 | 5.41e-04 | 5.45e-03 | 31 |
| GO:000188910 | Endometrium | AEH | liver development | 29/2100 | 147/18723 | 1.72e-03 | 1.38e-02 | 29 |
| GO:004873217 | Endometrium | EEC | gland development | 83/2168 | 436/18723 | 3.08e-06 | 8.48e-05 | 83 |
| GO:006100815 | Endometrium | EEC | hepaticobiliary system development | 31/2168 | 150/18723 | 9.24e-04 | 8.33e-03 | 31 |
| GO:000188915 | Endometrium | EEC | liver development | 29/2168 | 147/18723 | 2.77e-03 | 1.97e-02 | 29 |
| GO:004873225 | Esophagus | HGIN | gland development | 88/2587 | 436/18723 | 1.34e-04 | 2.71e-03 | 88 |
| GO:006100820 | Esophagus | HGIN | hepaticobiliary system development | 37/2587 | 150/18723 | 2.58e-04 | 4.53e-03 | 37 |
| Page: 1 2 3 |
| Pathway ID | Tissue | Disease Stage | Description | Gene Ratio | Bg Ratio | pvalue | p.adjust | qvalue | Count |
| hsa04141 | Colorectum | AD | Protein processing in endoplasmic reticulum | 80/2092 | 174/8465 | 5.96e-10 | 1.25e-08 | 7.96e-09 | 80 |
| hsa041411 | Colorectum | AD | Protein processing in endoplasmic reticulum | 80/2092 | 174/8465 | 5.96e-10 | 1.25e-08 | 7.96e-09 | 80 |
| hsa041412 | Colorectum | SER | Protein processing in endoplasmic reticulum | 60/1580 | 174/8465 | 4.20e-07 | 7.33e-06 | 5.32e-06 | 60 |
| hsa041413 | Colorectum | SER | Protein processing in endoplasmic reticulum | 60/1580 | 174/8465 | 4.20e-07 | 7.33e-06 | 5.32e-06 | 60 |
| hsa041414 | Colorectum | MSS | Protein processing in endoplasmic reticulum | 75/1875 | 174/8465 | 3.78e-10 | 8.44e-09 | 5.17e-09 | 75 |
| hsa041415 | Colorectum | MSS | Protein processing in endoplasmic reticulum | 75/1875 | 174/8465 | 3.78e-10 | 8.44e-09 | 5.17e-09 | 75 |
| hsa041416 | Colorectum | MSI-H | Protein processing in endoplasmic reticulum | 46/797 | 174/8465 | 4.53e-11 | 9.78e-10 | 8.19e-10 | 46 |
| hsa041417 | Colorectum | MSI-H | Protein processing in endoplasmic reticulum | 46/797 | 174/8465 | 4.53e-11 | 9.78e-10 | 8.19e-10 | 46 |
| hsa0414126 | Endometrium | AEH | Protein processing in endoplasmic reticulum | 62/1197 | 174/8465 | 5.97e-13 | 1.39e-11 | 1.01e-11 | 62 |
| hsa04141111 | Endometrium | AEH | Protein processing in endoplasmic reticulum | 62/1197 | 174/8465 | 5.97e-13 | 1.39e-11 | 1.01e-11 | 62 |
| hsa0414127 | Endometrium | EEC | Protein processing in endoplasmic reticulum | 64/1237 | 174/8465 | 2.17e-13 | 5.09e-12 | 3.80e-12 | 64 |
| hsa0414136 | Endometrium | EEC | Protein processing in endoplasmic reticulum | 64/1237 | 174/8465 | 2.17e-13 | 5.09e-12 | 3.80e-12 | 64 |
| hsa0414139 | Esophagus | HGIN | Protein processing in endoplasmic reticulum | 67/1383 | 174/8465 | 1.06e-12 | 2.16e-11 | 1.72e-11 | 67 |
| hsa04141114 | Esophagus | HGIN | Protein processing in endoplasmic reticulum | 67/1383 | 174/8465 | 1.06e-12 | 2.16e-11 | 1.72e-11 | 67 |
| hsa04141211 | Esophagus | ESCC | Protein processing in endoplasmic reticulum | 147/4205 | 174/8465 | 3.29e-22 | 1.10e-19 | 5.64e-20 | 147 |
| hsa04141310 | Esophagus | ESCC | Protein processing in endoplasmic reticulum | 147/4205 | 174/8465 | 3.29e-22 | 1.10e-19 | 5.64e-20 | 147 |
| hsa0414114 | Liver | Cirrhotic | Protein processing in endoplasmic reticulum | 114/2530 | 174/8465 | 1.16e-22 | 9.67e-21 | 5.96e-21 | 114 |
| hsa0414115 | Liver | Cirrhotic | Protein processing in endoplasmic reticulum | 114/2530 | 174/8465 | 1.16e-22 | 9.67e-21 | 5.96e-21 | 114 |
| hsa0414122 | Liver | HCC | Protein processing in endoplasmic reticulum | 146/4020 | 174/8465 | 7.34e-24 | 2.46e-21 | 1.37e-21 | 146 |
| hsa0414132 | Liver | HCC | Protein processing in endoplasmic reticulum | 146/4020 | 174/8465 | 7.34e-24 | 2.46e-21 | 1.37e-21 | 146 |
| Page: 1 2 |
Top |
Cell-cell communication analysis |
| Identification of potential cell-cell interactions between two cell types and their ligand-receptor pairs for different disease states |
| Ligand | Receptor | LRpair | Pathway | Tissue | Disease Stage |
| Page: 1 |
Top |
Single-cell gene regulatory network inference analysis |
| Find out the significant the regulons (TFs) and the target genes of each regulon across cell types for different disease states |
| TF | Cell Type | Tissue | Disease Stage | Target Gene | RSS | Regulon Activity |
| ∗The dot plots of a searched regulon are shown for all cell subpopulations in each disease state of each tissue based on the regulon specific score inferred using pySCENIC and by calculating the average expression. |
| Page: 1 |
Top |
Somatic mutation of malignant transformation related genes |
| Annotation of somatic variants for genes involved in malignant transformation |
| Hugo Symbol | Variant Class | Variant Classification | dbSNP RS | HGVSc | HGVSp | HGVSp Short | SWISSPROT | BIOTYPE | SIFT | PolyPhen | Tumor Sample Barcode | Tissue | Histology | Sex | Age | Stage | Therapy Types | Drugs | Outcome |
| PRKCSH | SNV | Missense_Mutation | novel | c.1107N>C | p.Gln369His | p.Q369H | protein_coding | deleterious(0.02) | benign(0.336) | TCGA-3C-AALI-01 | Breast | breast invasive carcinoma | Female | <65 | I/II | Unspecific | Poly E | Complete Response | |
| PRKCSH | SNV | Missense_Mutation | novel | c.130G>T | p.Ala44Ser | p.A44S | protein_coding | tolerated(0.67) | benign(0.068) | TCGA-A2-A25A-01 | Breast | breast invasive carcinoma | Female | <65 | I/II | Unspecific | Cytoxan | SD | |
| PRKCSH | SNV | Missense_Mutation | rs775931511 | c.1477G>A | p.Gly493Arg | p.G493R | protein_coding | deleterious(0) | probably_damaging(0.998) | TCGA-AO-A128-01 | Breast | breast invasive carcinoma | Female | <65 | I/II | Chemotherapy | doxorubicin | SD | |
| PRKCSH | SNV | Missense_Mutation | c.205N>C | p.Ala69Pro | p.A69P | protein_coding | deleterious(0) | probably_damaging(0.998) | TCGA-BH-A18P-01 | Breast | breast invasive carcinoma | Female | <65 | I/II | Unknown | Unknown | PD | ||
| PRKCSH | SNV | Missense_Mutation | c.845N>T | p.Ser282Phe | p.S282F | protein_coding | tolerated(0.14) | possibly_damaging(0.851) | TCGA-BH-A1FN-01 | Breast | breast invasive carcinoma | Female | <65 | I/II | Unknown | Unknown | PD | ||
| PRKCSH | insertion | Frame_Shift_Ins | novel | c.456_457insAGGTGGATTGAACACAACCAACACACTTCTTTTTTTTTTT | p.Glu153ArgfsTer14 | p.E153Rfs*14 | protein_coding | TCGA-A8-A09B-01 | Breast | breast invasive carcinoma | Female | <65 | III/IV | Chemotherapy | 5-fluorouracil | SD | |||
| PRKCSH | SNV | Missense_Mutation | rs137933137 | c.1322C>T | p.Ser441Leu | p.S441L | protein_coding | deleterious(0) | possibly_damaging(0.754) | TCGA-EA-A410-01 | Cervix | cervical & endocervical cancer | Female | <65 | I/II | Unknown | Unknown | SD | |
| PRKCSH | SNV | Missense_Mutation | rs201537803 | c.1055N>T | p.Pro352Leu | p.P352L | protein_coding | tolerated(0.08) | benign(0) | TCGA-AA-3529-01 | Colorectum | colon adenocarcinoma | Female | >=65 | III/IV | Unknown | Unknown | PD | |
| PRKCSH | SNV | Missense_Mutation | rs574529270 | c.893C>T | p.Thr298Met | p.T298M | protein_coding | tolerated(0.29) | benign(0.001) | TCGA-AA-3864-01 | Colorectum | colon adenocarcinoma | Male | >=65 | I/II | Unknown | Unknown | SD | |
| PRKCSH | SNV | Missense_Mutation | rs749197925 | c.313G>A | p.Glu105Lys | p.E105K | protein_coding | deleterious(0) | benign(0.139) | TCGA-CA-6717-01 | Colorectum | colon adenocarcinoma | Male | <65 | I/II | Chemotherapy | oxaliplatin | CR |
| Page: 1 2 3 4 5 6 |
Top |
Related drugs of malignant transformation related genes |
| Identification of chemicals and drugs interact with genes involved in malignant transfromation |
| (DGIdb 4.0) |
| Entrez ID | Symbol | Category | Interaction Types | Drug Claim Name | Drug Name | PMIDs |
| Page: 1 |

Copyright 2023-Present -The University of Texas Health Science Center at Houston |