
|
|||||
|
 | |
| |
| |
| |
| |
| |
|
Gene: PRKCDBP |
Gene summary for PRKCDBP |
| Gene information | Species | Human | Gene symbol | PRKCDBP | Gene ID | 112464 |
| Gene name | caveolae associated protein 3 | |
| Gene Alias | HSRBC | |
| Cytomap | 11p15.4 | |
| Gene Type | protein-coding | GO ID | GO:0000165 | UniProtAcc | Q969G5 |
Top |
Malignant transformation analysis |
| Identification of the aberrant gene expression in precancerous and cancerous lesions by comparing the gene expression of stem-like cells in diseased tissues with normal stem cells |
| Entrez ID | Symbol | Replicates | Species | Organ | Tissue | Adj P-value | Log2FC | Malignancy |
| 112464 | PRKCDBP | P1T-E | Human | Esophagus | ESCC | 1.47e-02 | 2.69e-01 | 0.0875 |
| 112464 | PRKCDBP | P2T-E | Human | Esophagus | ESCC | 4.56e-15 | 4.15e-01 | 0.1177 |
| 112464 | PRKCDBP | P4T-E | Human | Esophagus | ESCC | 5.03e-10 | 8.51e-01 | 0.1323 |
| 112464 | PRKCDBP | P5T-E | Human | Esophagus | ESCC | 2.55e-22 | 8.00e-01 | 0.1327 |
| 112464 | PRKCDBP | P9T-E | Human | Esophagus | ESCC | 1.76e-15 | 9.71e-01 | 0.1131 |
| 112464 | PRKCDBP | P10T-E | Human | Esophagus | ESCC | 4.61e-42 | 1.15e+00 | 0.116 |
| 112464 | PRKCDBP | P11T-E | Human | Esophagus | ESCC | 2.11e-52 | 1.97e+00 | 0.1426 |
| 112464 | PRKCDBP | P12T-E | Human | Esophagus | ESCC | 1.32e-21 | 6.36e-01 | 0.1122 |
| 112464 | PRKCDBP | P15T-E | Human | Esophagus | ESCC | 8.66e-07 | 4.83e-01 | 0.1149 |
| 112464 | PRKCDBP | P16T-E | Human | Esophagus | ESCC | 8.57e-12 | 4.42e-02 | 0.1153 |
| 112464 | PRKCDBP | P17T-E | Human | Esophagus | ESCC | 9.84e-29 | 1.97e+00 | 0.1278 |
| 112464 | PRKCDBP | P19T-E | Human | Esophagus | ESCC | 6.72e-27 | 2.72e+00 | 0.1662 |
| 112464 | PRKCDBP | P20T-E | Human | Esophagus | ESCC | 6.37e-12 | 5.97e-01 | 0.1124 |
| 112464 | PRKCDBP | P21T-E | Human | Esophagus | ESCC | 5.51e-29 | 9.59e-01 | 0.1617 |
| 112464 | PRKCDBP | P23T-E | Human | Esophagus | ESCC | 1.95e-10 | 7.23e-01 | 0.108 |
| 112464 | PRKCDBP | P24T-E | Human | Esophagus | ESCC | 8.62e-44 | 1.54e+00 | 0.1287 |
| 112464 | PRKCDBP | P26T-E | Human | Esophagus | ESCC | 1.79e-02 | 4.32e-01 | 0.1276 |
| 112464 | PRKCDBP | P28T-E | Human | Esophagus | ESCC | 4.96e-10 | 6.61e-01 | 0.1149 |
| 112464 | PRKCDBP | P31T-E | Human | Esophagus | ESCC | 1.80e-15 | 5.51e-01 | 0.1251 |
| 112464 | PRKCDBP | P32T-E | Human | Esophagus | ESCC | 2.07e-62 | 2.07e+00 | 0.1666 |
| Page: 1 2 3 4 |
| Tissue | Expression Dynamics | Abbreviation |
| Esophagus | 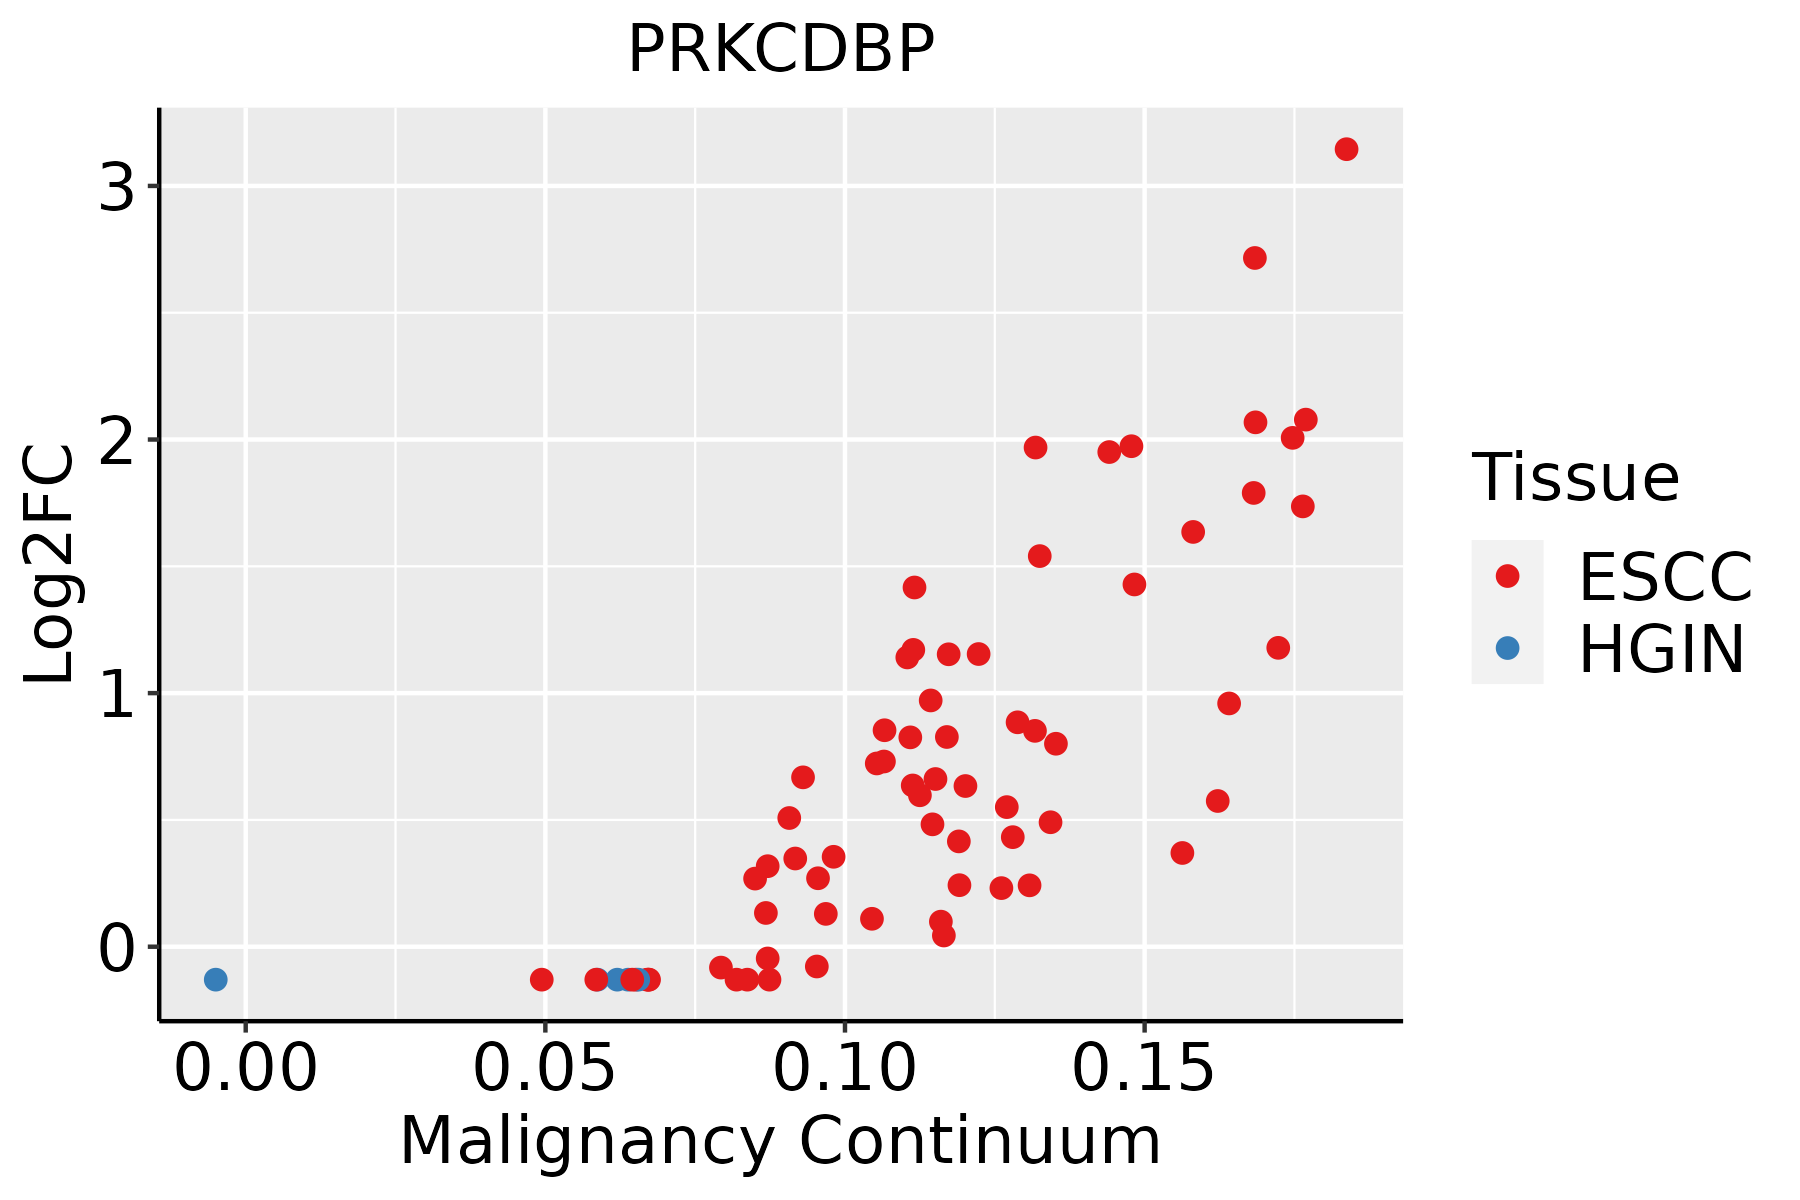 | ESCC: Esophageal squamous cell carcinoma |
| HGIN: High-grade intraepithelial neoplasias | ||
| LGIN: Low-grade intraepithelial neoplasias | ||
| Liver | 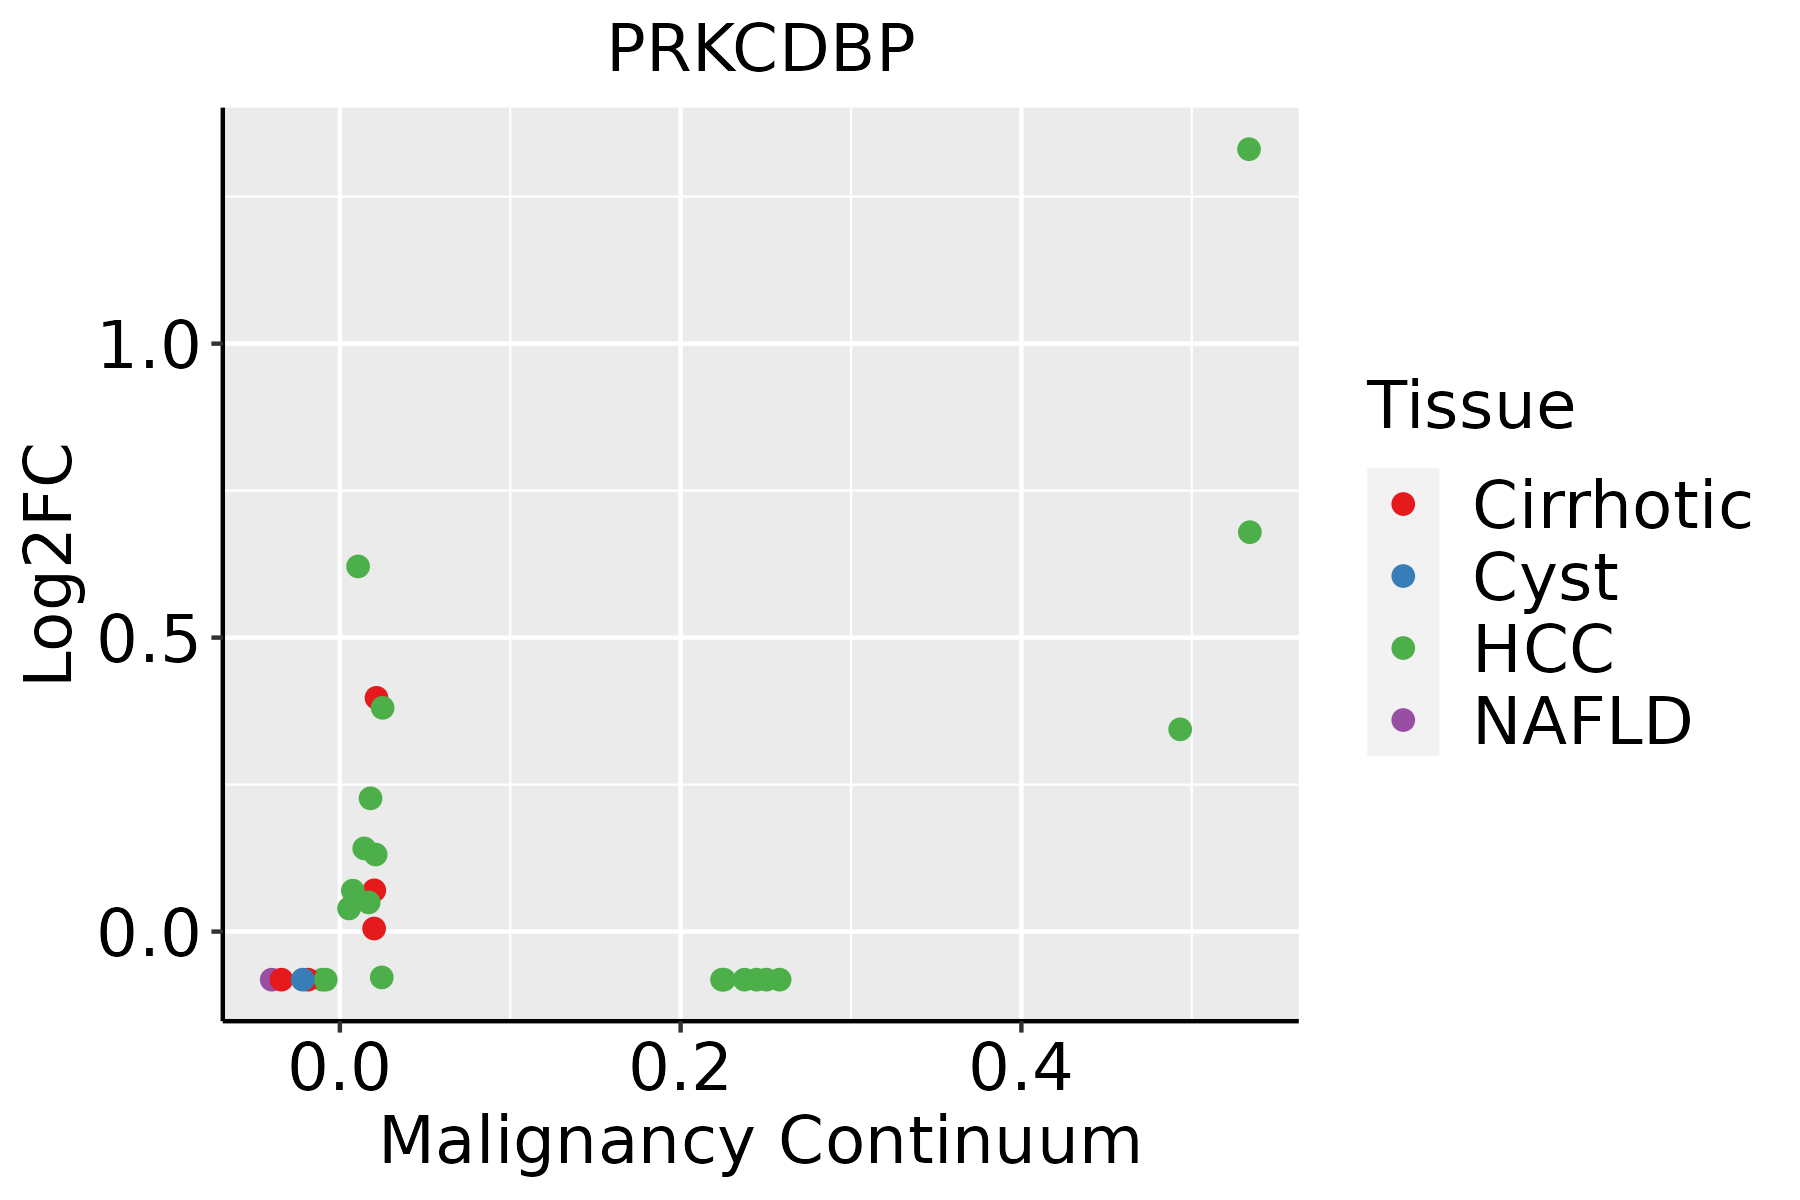 | HCC: Hepatocellular carcinoma |
| NAFLD: Non-alcoholic fatty liver disease | ||
| Oral Cavity | 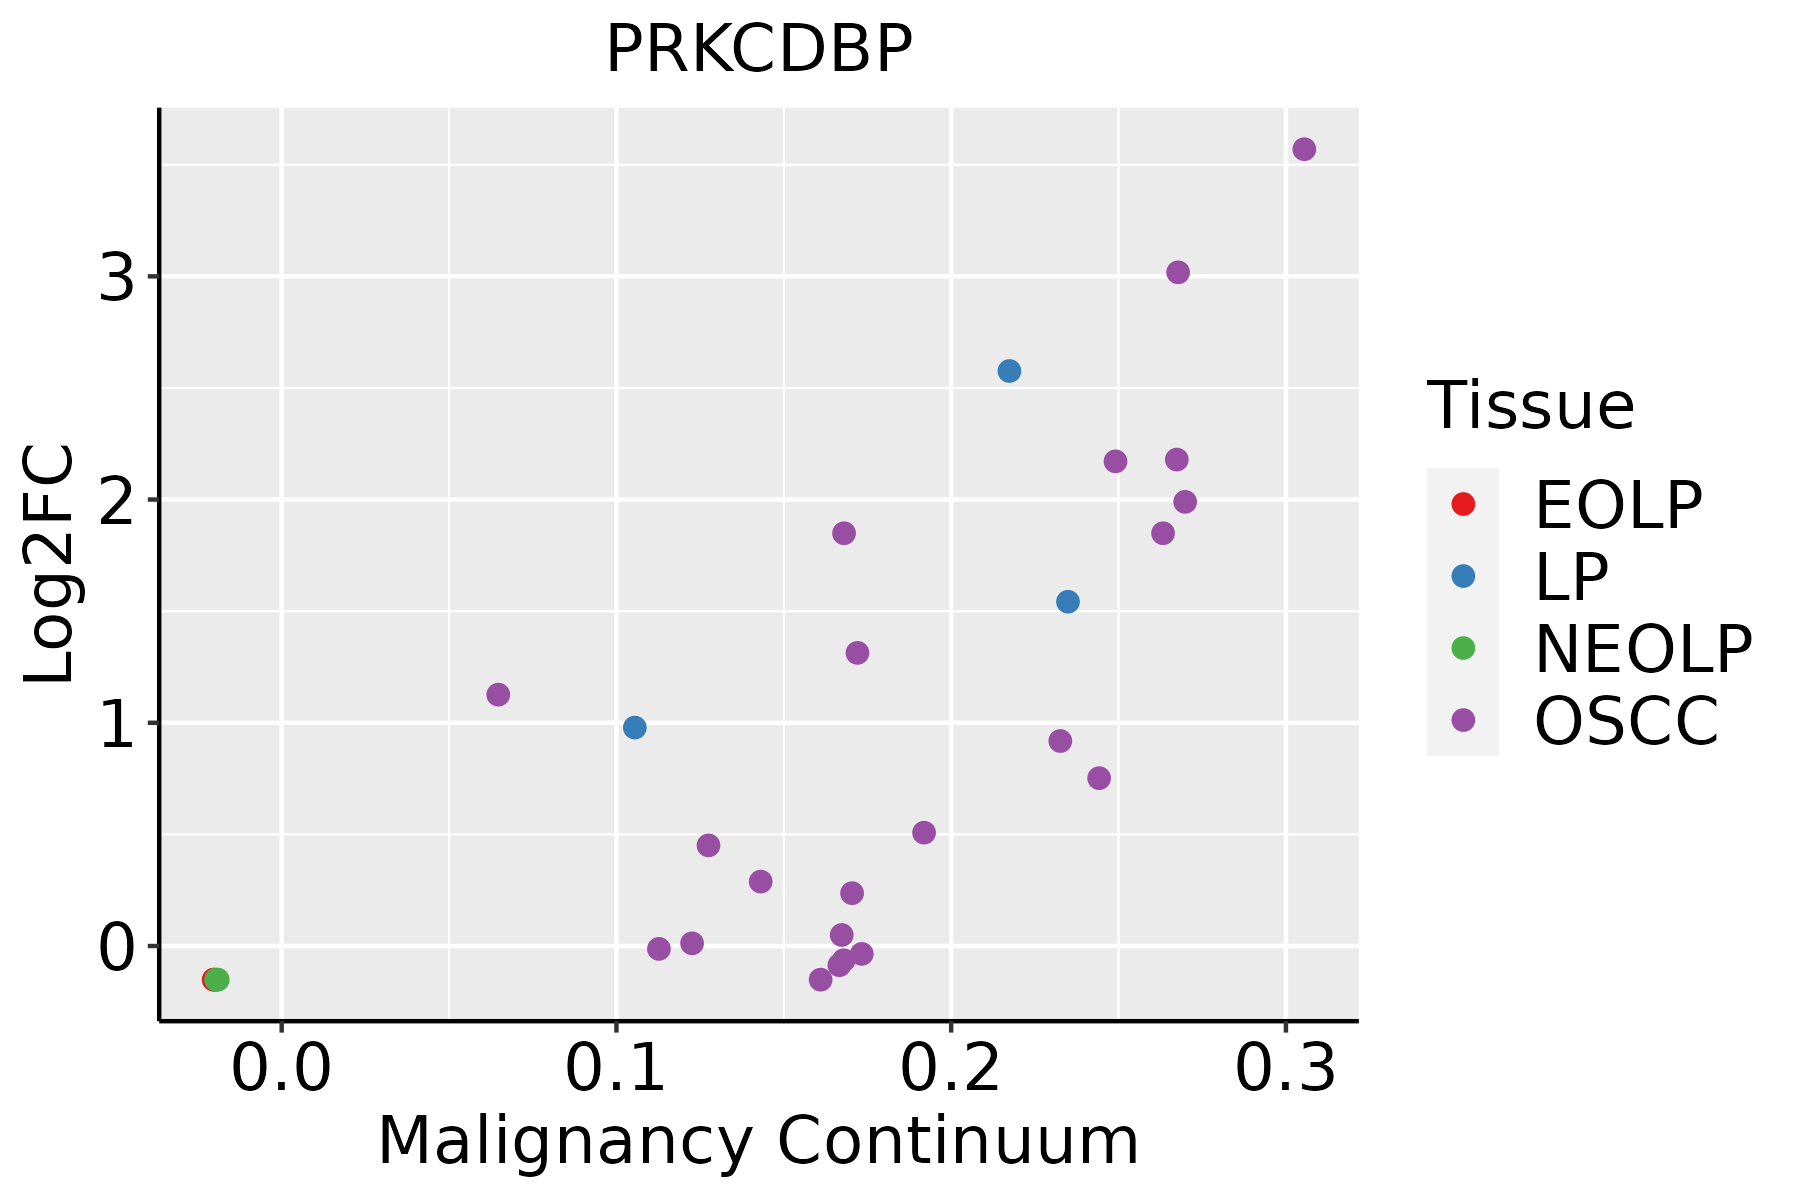 | EOLP: Erosive Oral lichen planus |
| LP: leukoplakia | ||
| NEOLP: Non-erosive oral lichen planus | ||
| OSCC: Oral squamous cell carcinoma | ||
| Skin | 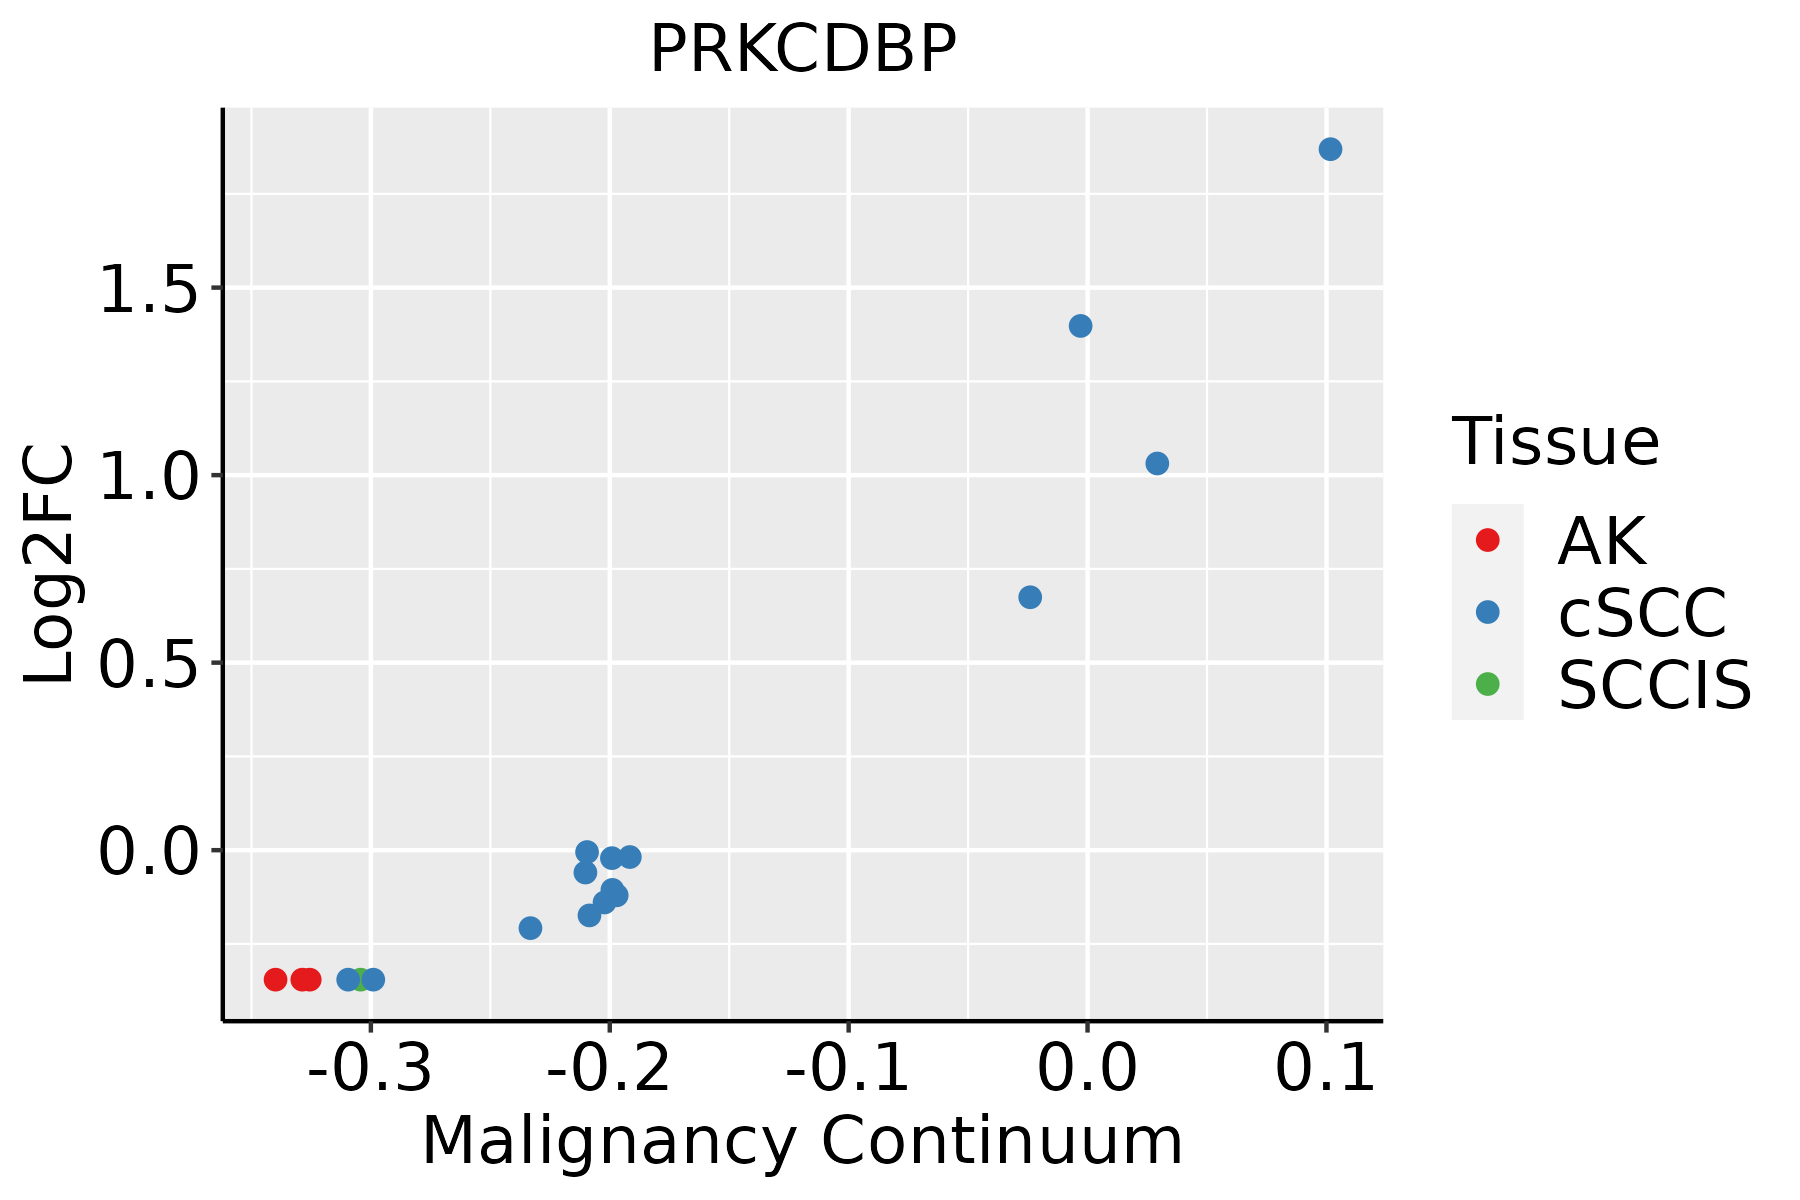 | AK: Actinic keratosis |
| cSCC: Cutaneous squamous cell carcinoma | ||
| SCCIS:squamous cell carcinoma in situ |
| ∗log2FC in expression of this searched gene in stem-like cells from each diseased tissue sample relative to stem-like cells in normal samples in each tissue plotted against the malignancy continuum. Samples are colored based on if they are from different disease stage. |
Top |
Malignant transformation related pathway analysis |
| Find out the enriched GO biological processes and KEGG pathways involved in transition from healthy to precancer to cancer |
| Tissue | Disease Stage | Enriched GO biological Processes |
| Colorectum | AD |  |
| Colorectum | SER |  |
| Colorectum | MSS |  |
| Colorectum | MSI-H |  |
| Colorectum | FAP |  |
| ∗Top 15 enriched GO BP terms are showed in the bar plot of each disease state in each tissue. Each row represents a significant GO biological process which is colored according to the -log10(p.adjust). |
| Page: 1 2 3 4 5 6 7 8 9 |
| GO ID | Tissue | Disease Stage | Description | Gene Ratio | Bg Ratio | pvalue | p.adjust | Count |
| Page: 1 |
| Pathway ID | Tissue | Disease Stage | Description | Gene Ratio | Bg Ratio | pvalue | p.adjust | qvalue | Count |
| Page: 1 |
Top |
Cell-cell communication analysis |
| Identification of potential cell-cell interactions between two cell types and their ligand-receptor pairs for different disease states |
| Ligand | Receptor | LRpair | Pathway | Tissue | Disease Stage |
| Page: 1 |
Top |
Single-cell gene regulatory network inference analysis |
| Find out the significant the regulons (TFs) and the target genes of each regulon across cell types for different disease states |
| TF | Cell Type | Tissue | Disease Stage | Target Gene | RSS | Regulon Activity |
| ∗The dot plots of a searched regulon are shown for all cell subpopulations in each disease state of each tissue based on the regulon specific score inferred using pySCENIC and by calculating the average expression. |
| Page: 1 |
Top |
Somatic mutation of malignant transformation related genes |
| Annotation of somatic variants for genes involved in malignant transformation |
| Hugo Symbol | Variant Class | Variant Classification | dbSNP RS | HGVSc | HGVSp | HGVSp Short | SWISSPROT | BIOTYPE | SIFT | PolyPhen | Tumor Sample Barcode | Tissue | Histology | Sex | Age | Stage | Therapy Types | Drugs | Outcome |
| PRKCDBP | insertion | Frame_Shift_Ins | novel | c.526_527insTTATTCTGATG | p.Gln176LeufsTer89 | p.Q176Lfs*89 | Q969G5 | protein_coding | TCGA-A2-A0CU-01 | Breast | breast invasive carcinoma | Female | >=65 | I/II | Hormone Therapy | tamoxiphen | SD | ||
| PRKCDBP | insertion | Frame_Shift_Ins | novel | c.390_391insCACTCAC | p.Gly131HisfsTer4 | p.G131Hfs*4 | Q969G5 | protein_coding | TCGA-A8-A07G-01 | Breast | breast invasive carcinoma | Female | >=65 | I/II | Chemotherapy | 5-fluorouracil | CR | ||
| PRKCDBP | insertion | Frame_Shift_Ins | novel | c.388_389insT | p.Glu130ValfsTer3 | p.E130Vfs*3 | Q969G5 | protein_coding | TCGA-A8-A07G-01 | Breast | breast invasive carcinoma | Female | >=65 | I/II | Chemotherapy | 5-fluorouracil | CR | ||
| PRKCDBP | insertion | Nonsense_Mutation | novel | c.642_643insCACCATCAATAAAAGTAATTTC | p.Gly215HisfsTer4 | p.G215Hfs*4 | Q969G5 | protein_coding | TCGA-BH-A0H7-01 | Breast | breast invasive carcinoma | Female | >=65 | III/IV | Chemotherapy | doxorubicin | SD | ||
| PRKCDBP | SNV | Missense_Mutation | c.381N>G | p.Phe127Leu | p.F127L | Q969G5 | protein_coding | tolerated(0.06) | benign(0.187) | TCGA-DG-A2KH-01 | Cervix | cervical & endocervical cancer | Female | <65 | I/II | Unknown | Unknown | SD | |
| PRKCDBP | SNV | Missense_Mutation | rs762970407 | c.373N>G | p.Leu125Val | p.L125V | Q969G5 | protein_coding | tolerated(0.44) | benign(0.003) | TCGA-EK-A3GK-01 | Cervix | cervical & endocervical cancer | Female | <65 | I/II | Unknown | Unknown | SD |
| PRKCDBP | SNV | Missense_Mutation | c.631N>G | p.Arg211Gly | p.R211G | Q969G5 | protein_coding | deleterious(0) | probably_damaging(0.997) | TCGA-IR-A3LK-01 | Cervix | cervical & endocervical cancer | Female | >=65 | I/II | Chemotherapy | cisplatin | PD | |
| PRKCDBP | SNV | Missense_Mutation | c.647N>A | p.Arg216Gln | p.R216Q | Q969G5 | protein_coding | tolerated_low_confidence(0.1) | benign(0.018) | TCGA-A6-6654-01 | Colorectum | colon adenocarcinoma | Female | >=65 | III/IV | Chemotherapy | oxaliplatin | SD | |
| PRKCDBP | SNV | Missense_Mutation | c.565N>A | p.Leu189Ile | p.L189I | Q969G5 | protein_coding | tolerated(0.3) | possibly_damaging(0.475) | TCGA-AA-3672-01 | Colorectum | colon adenocarcinoma | Female | >=65 | III/IV | Unknown | Unknown | SD | |
| PRKCDBP | SNV | Missense_Mutation | c.409G>A | p.Ala137Thr | p.A137T | Q969G5 | protein_coding | tolerated(0.1) | probably_damaging(0.998) | TCGA-AA-3977-01 | Colorectum | colon adenocarcinoma | Male | >=65 | I/II | Unknown | Unknown | SD |
| Page: 1 2 3 |
Top |
Related drugs of malignant transformation related genes |
| Identification of chemicals and drugs interact with genes involved in malignant transfromation |
| (DGIdb 4.0) |
| Entrez ID | Symbol | Category | Interaction Types | Drug Claim Name | Drug Name | PMIDs |
| Page: 1 |

Copyright 2023-Present -The University of Texas Health Science Center at Houston |