
|
|||||
|
 | |
| |
| |
| |
| |
| |
|
Gene: PRKAR2B |
Gene summary for PRKAR2B |
| Gene information | Species | Human | Gene symbol | PRKAR2B | Gene ID | 5577 |
| Gene name | protein kinase cAMP-dependent type II regulatory subunit beta | |
| Gene Alias | PRKAR2 | |
| Cytomap | 7q22.3 | |
| Gene Type | protein-coding | GO ID | GO:0001932 | UniProtAcc | A0A024R712 |
Top |
Malignant transformation analysis |
| Identification of the aberrant gene expression in precancerous and cancerous lesions by comparing the gene expression of stem-like cells in diseased tissues with normal stem cells |
| Entrez ID | Symbol | Replicates | Species | Organ | Tissue | Adj P-value | Log2FC | Malignancy |
| 5577 | PRKAR2B | GSM4909308 | Human | Breast | IDC | 1.11e-07 | 2.20e-01 | 0.158 |
| 5577 | PRKAR2B | GSM4909315 | Human | Breast | IDC | 6.81e-22 | 5.67e-01 | 0.21 |
| 5577 | PRKAR2B | GSM4909316 | Human | Breast | IDC | 8.19e-08 | 5.73e-01 | 0.21 |
| 5577 | PRKAR2B | NCCBC14 | Human | Breast | DCIS | 2.90e-04 | 3.17e-01 | 0.2021 |
| 5577 | PRKAR2B | DCIS2 | Human | Breast | DCIS | 2.47e-31 | 1.92e-01 | 0.0085 |
| Page: 1 |
| Tissue | Expression Dynamics | Abbreviation |
| Breast | 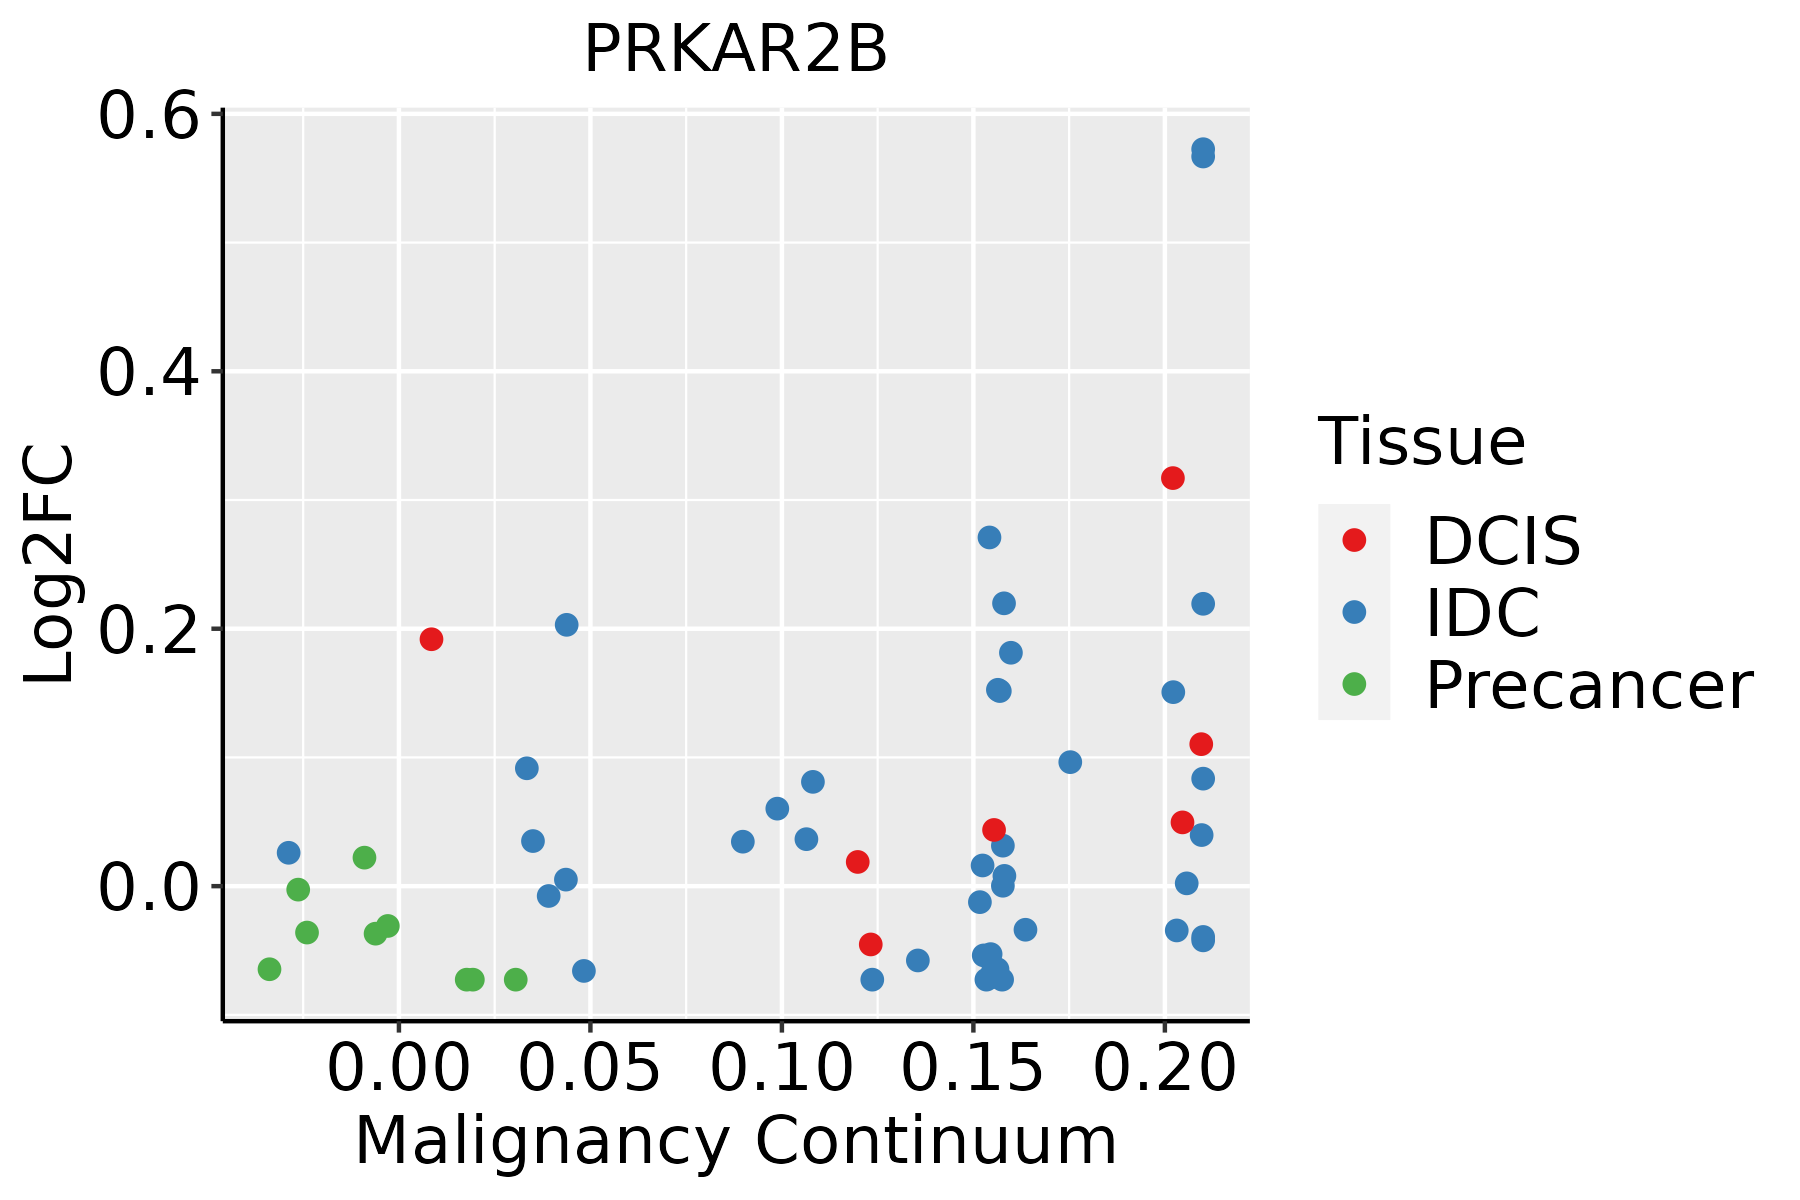 | IDC: Invasive ductal carcinoma |
| DCIS: Ductal carcinoma in situ | ||
| Precancer(BRCA1-mut): Precancerous lesion from BRCA1 mutation carriers |
| ∗log2FC in expression of this searched gene in stem-like cells from each diseased tissue sample relative to stem-like cells in normal samples in each tissue plotted against the malignancy continuum. Samples are colored based on if they are from different disease stage. |
Top |
Malignant transformation related pathway analysis |
| Find out the enriched GO biological processes and KEGG pathways involved in transition from healthy to precancer to cancer |
| Tissue | Disease Stage | Enriched GO biological Processes |
| Colorectum | AD |  |
| Colorectum | SER |  |
| Colorectum | MSS |  |
| Colorectum | MSI-H |  |
| Colorectum | FAP |  |
| ∗Top 15 enriched GO BP terms are showed in the bar plot of each disease state in each tissue. Each row represents a significant GO biological process which is colored according to the -log10(p.adjust). |
| Page: 1 2 3 4 5 6 7 8 9 |
| GO ID | Tissue | Disease Stage | Description | Gene Ratio | Bg Ratio | pvalue | p.adjust | Count |
| GO:005134814 | Breast | IDC | negative regulation of transferase activity | 39/1434 | 268/18723 | 7.89e-05 | 1.56e-03 | 39 |
| GO:00459369 | Breast | IDC | negative regulation of phosphate metabolic process | 53/1434 | 441/18723 | 7.21e-04 | 8.79e-03 | 53 |
| GO:00105639 | Breast | IDC | negative regulation of phosphorus metabolic process | 53/1434 | 442/18723 | 7.60e-04 | 9.25e-03 | 53 |
| GO:00064699 | Breast | IDC | negative regulation of protein kinase activity | 27/1434 | 212/18723 | 6.30e-03 | 4.47e-02 | 27 |
| GO:005134824 | Breast | DCIS | negative regulation of transferase activity | 39/1390 | 268/18723 | 4.02e-05 | 8.60e-04 | 39 |
| GO:004593614 | Breast | DCIS | negative regulation of phosphate metabolic process | 53/1390 | 441/18723 | 3.48e-04 | 4.96e-03 | 53 |
| GO:001056314 | Breast | DCIS | negative regulation of phosphorus metabolic process | 53/1390 | 442/18723 | 3.68e-04 | 5.18e-03 | 53 |
| GO:000646913 | Breast | DCIS | negative regulation of protein kinase activity | 27/1390 | 212/18723 | 4.18e-03 | 3.30e-02 | 27 |
| GO:00423269 | Breast | DCIS | negative regulation of phosphorylation | 43/1390 | 385/18723 | 4.78e-03 | 3.62e-02 | 43 |
| GO:00019339 | Breast | DCIS | negative regulation of protein phosphorylation | 39/1390 | 342/18723 | 4.94e-03 | 3.71e-02 | 39 |
| GO:00336738 | Breast | DCIS | negative regulation of kinase activity | 29/1390 | 237/18723 | 5.44e-03 | 3.99e-02 | 29 |
| Page: 1 |
| Pathway ID | Tissue | Disease Stage | Description | Gene Ratio | Bg Ratio | pvalue | p.adjust | qvalue | Count |
| Page: 1 |
Top |
Cell-cell communication analysis |
| Identification of potential cell-cell interactions between two cell types and their ligand-receptor pairs for different disease states |
| Ligand | Receptor | LRpair | Pathway | Tissue | Disease Stage |
| Page: 1 |
Top |
Single-cell gene regulatory network inference analysis |
| Find out the significant the regulons (TFs) and the target genes of each regulon across cell types for different disease states |
| TF | Cell Type | Tissue | Disease Stage | Target Gene | RSS | Regulon Activity |
| ∗The dot plots of a searched regulon are shown for all cell subpopulations in each disease state of each tissue based on the regulon specific score inferred using pySCENIC and by calculating the average expression. |
| Page: 1 |
Top |
Somatic mutation of malignant transformation related genes |
| Annotation of somatic variants for genes involved in malignant transformation |
| Hugo Symbol | Variant Class | Variant Classification | dbSNP RS | HGVSc | HGVSp | HGVSp Short | SWISSPROT | BIOTYPE | SIFT | PolyPhen | Tumor Sample Barcode | Tissue | Histology | Sex | Age | Stage | Therapy Types | Drugs | Outcome |
| PRKAR2B | SNV | Missense_Mutation | c.868N>C | p.Asp290His | p.D290H | P31323 | protein_coding | deleterious(0) | probably_damaging(0.999) | TCGA-AC-A23H-01 | Breast | breast invasive carcinoma | Female | >=65 | I/II | Unknown | Unknown | PD | |
| PRKAR2B | SNV | Missense_Mutation | c.667G>A | p.Glu223Lys | p.E223K | P31323 | protein_coding | deleterious(0) | probably_damaging(0.988) | TCGA-AN-A046-01 | Breast | breast invasive carcinoma | Female | >=65 | I/II | Unknown | Unknown | SD | |
| PRKAR2B | SNV | Missense_Mutation | c.715N>G | p.Thr239Ala | p.T239A | P31323 | protein_coding | tolerated(0.11) | benign(0.082) | TCGA-AN-A0AK-01 | Breast | breast invasive carcinoma | Female | >=65 | I/II | Unknown | Unknown | SD | |
| PRKAR2B | SNV | Missense_Mutation | c.647N>G | p.Asp216Gly | p.D216G | P31323 | protein_coding | deleterious(0) | possibly_damaging(0.9) | TCGA-AR-A0TP-01 | Breast | breast invasive carcinoma | Female | <65 | I/II | Chemotherapy | doxorubicin | SD | |
| PRKAR2B | SNV | Missense_Mutation | novel | c.895G>C | p.Asp299His | p.D299H | P31323 | protein_coding | deleterious(0) | probably_damaging(0.996) | TCGA-C5-A1MK-01 | Cervix | cervical & endocervical cancer | Female | >=65 | III/IV | Chemotherapy | carboplatin | PD |
| PRKAR2B | SNV | Missense_Mutation | novel | c.335N>A | p.Arg112His | p.R112H | P31323 | protein_coding | deleterious(0) | benign(0.099) | TCGA-VS-AA62-01 | Cervix | cervical & endocervical cancer | Female | <65 | I/II | Chemotherapy | cisplatin | PD |
| PRKAR2B | SNV | Missense_Mutation | rs76105568 | c.1189N>A | p.Ala397Thr | p.A397T | P31323 | protein_coding | tolerated(0.72) | benign(0.003) | TCGA-A6-2686-01 | Colorectum | colon adenocarcinoma | Female | >=65 | I/II | Unknown | Unknown | SD |
| PRKAR2B | SNV | Missense_Mutation | rs76105568 | c.1189G>A | p.Ala397Thr | p.A397T | P31323 | protein_coding | tolerated(0.72) | benign(0.003) | TCGA-AA-3713-01 | Colorectum | colon adenocarcinoma | Male | >=65 | III/IV | Chemotherapy | 5-fluorouracil | PR |
| PRKAR2B | SNV | Missense_Mutation | rs201018627 | c.926N>T | p.Ser309Leu | p.S309L | P31323 | protein_coding | tolerated(0.33) | benign(0.009) | TCGA-AA-A00N-01 | Colorectum | colon adenocarcinoma | Male | >=65 | I/II | Unknown | Unknown | PD |
| PRKAR2B | SNV | Missense_Mutation | novel | c.335N>A | p.Arg112His | p.R112H | P31323 | protein_coding | deleterious(0) | benign(0.099) | TCGA-AG-3892-01 | Colorectum | rectum adenocarcinoma | Female | <65 | I/II | Unknown | Unknown | SD |
| Page: 1 2 3 4 |
Top |
Related drugs of malignant transformation related genes |
| Identification of chemicals and drugs interact with genes involved in malignant transfromation |
| (DGIdb 4.0) |
| Entrez ID | Symbol | Category | Interaction Types | Drug Claim Name | Drug Name | PMIDs |
| 5577 | PRKAR2B | ENZYME, KINASE | THEOPHYLLINE | THEOPHYLLINE | 2893795 |
| Page: 1 |

Copyright 2023-Present -The University of Texas Health Science Center at Houston |