
|
|||||
|
 | |
| |
| |
| |
| |
| |
|
Gene: PRKAR1B |
Gene summary for PRKAR1B |
| Gene information | Species | Human | Gene symbol | PRKAR1B | Gene ID | 5575 |
| Gene name | protein kinase cAMP-dependent type I regulatory subunit beta | |
| Gene Alias | PRKAR1 | |
| Cytomap | 7p22.3 | |
| Gene Type | protein-coding | GO ID | GO:0001932 | UniProtAcc | P31321 |
Top |
Malignant transformation analysis |
| Identification of the aberrant gene expression in precancerous and cancerous lesions by comparing the gene expression of stem-like cells in diseased tissues with normal stem cells |
| Entrez ID | Symbol | Replicates | Species | Organ | Tissue | Adj P-value | Log2FC | Malignancy |
| 5575 | PRKAR1B | LZE2T | Human | Esophagus | ESCC | 4.32e-03 | 3.87e-01 | 0.082 |
| 5575 | PRKAR1B | LZE4T | Human | Esophagus | ESCC | 4.42e-04 | 1.34e-01 | 0.0811 |
| 5575 | PRKAR1B | LZE8T | Human | Esophagus | ESCC | 2.91e-02 | 9.30e-02 | 0.067 |
| 5575 | PRKAR1B | LZE22T | Human | Esophagus | ESCC | 1.21e-04 | 3.87e-01 | 0.068 |
| 5575 | PRKAR1B | LZE24T | Human | Esophagus | ESCC | 1.14e-10 | 2.63e-01 | 0.0596 |
| 5575 | PRKAR1B | P2T-E | Human | Esophagus | ESCC | 2.75e-33 | 4.95e-01 | 0.1177 |
| 5575 | PRKAR1B | P4T-E | Human | Esophagus | ESCC | 2.95e-11 | 3.06e-01 | 0.1323 |
| 5575 | PRKAR1B | P5T-E | Human | Esophagus | ESCC | 9.43e-12 | 2.09e-01 | 0.1327 |
| 5575 | PRKAR1B | P8T-E | Human | Esophagus | ESCC | 1.70e-08 | 1.64e-01 | 0.0889 |
| 5575 | PRKAR1B | P9T-E | Human | Esophagus | ESCC | 2.06e-08 | 2.25e-01 | 0.1131 |
| 5575 | PRKAR1B | P10T-E | Human | Esophagus | ESCC | 5.41e-37 | 6.11e-01 | 0.116 |
| 5575 | PRKAR1B | P11T-E | Human | Esophagus | ESCC | 2.76e-14 | 5.10e-01 | 0.1426 |
| 5575 | PRKAR1B | P12T-E | Human | Esophagus | ESCC | 4.32e-25 | 5.11e-01 | 0.1122 |
| 5575 | PRKAR1B | P15T-E | Human | Esophagus | ESCC | 4.07e-15 | 3.67e-01 | 0.1149 |
| 5575 | PRKAR1B | P16T-E | Human | Esophagus | ESCC | 1.23e-44 | 7.99e-01 | 0.1153 |
| 5575 | PRKAR1B | P17T-E | Human | Esophagus | ESCC | 4.63e-07 | 2.86e-01 | 0.1278 |
| 5575 | PRKAR1B | P19T-E | Human | Esophagus | ESCC | 5.18e-12 | 6.69e-01 | 0.1662 |
| 5575 | PRKAR1B | P20T-E | Human | Esophagus | ESCC | 6.62e-12 | 2.39e-01 | 0.1124 |
| 5575 | PRKAR1B | P21T-E | Human | Esophagus | ESCC | 2.14e-39 | 7.32e-01 | 0.1617 |
| 5575 | PRKAR1B | P22T-E | Human | Esophagus | ESCC | 4.75e-16 | 2.78e-01 | 0.1236 |
| Page: 1 2 3 4 5 |
| Tissue | Expression Dynamics | Abbreviation |
| Esophagus | 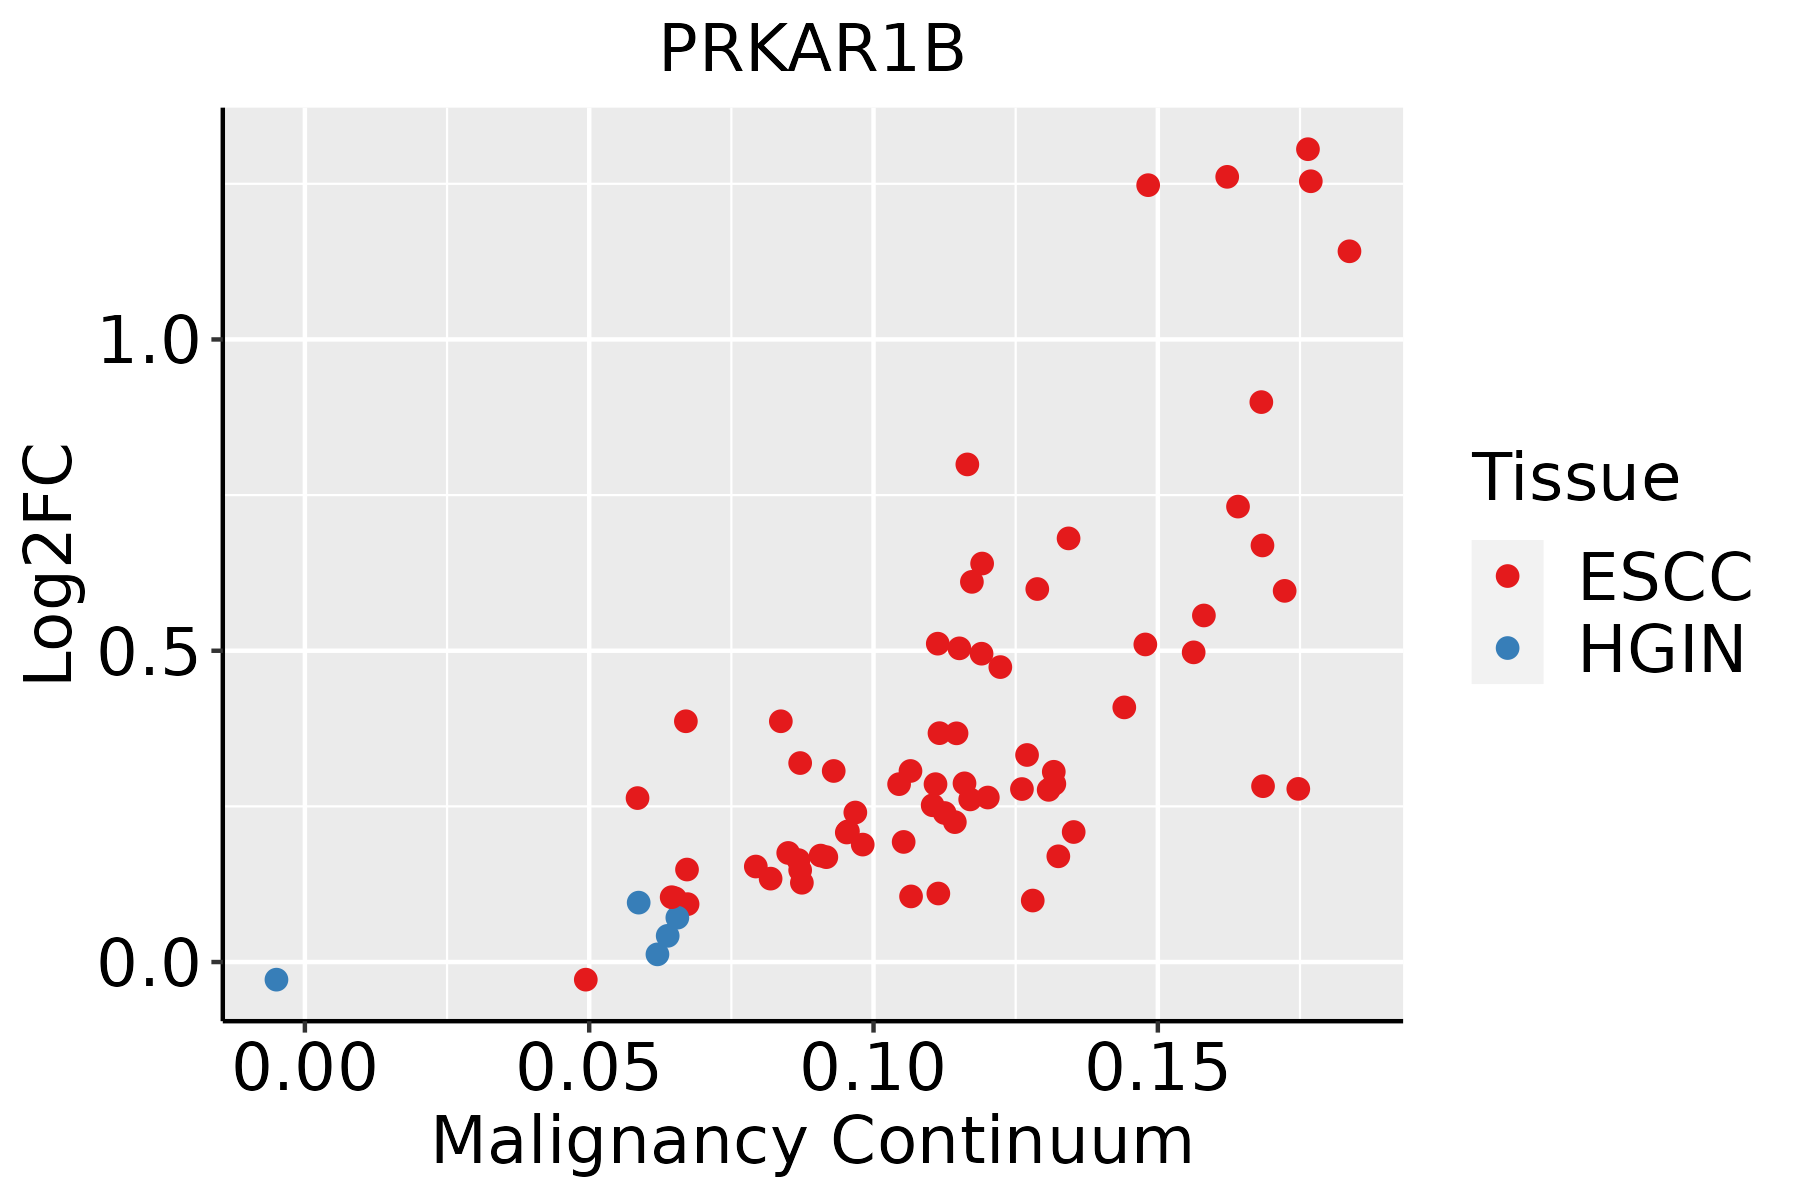 | ESCC: Esophageal squamous cell carcinoma |
| HGIN: High-grade intraepithelial neoplasias | ||
| LGIN: Low-grade intraepithelial neoplasias | ||
| Liver | 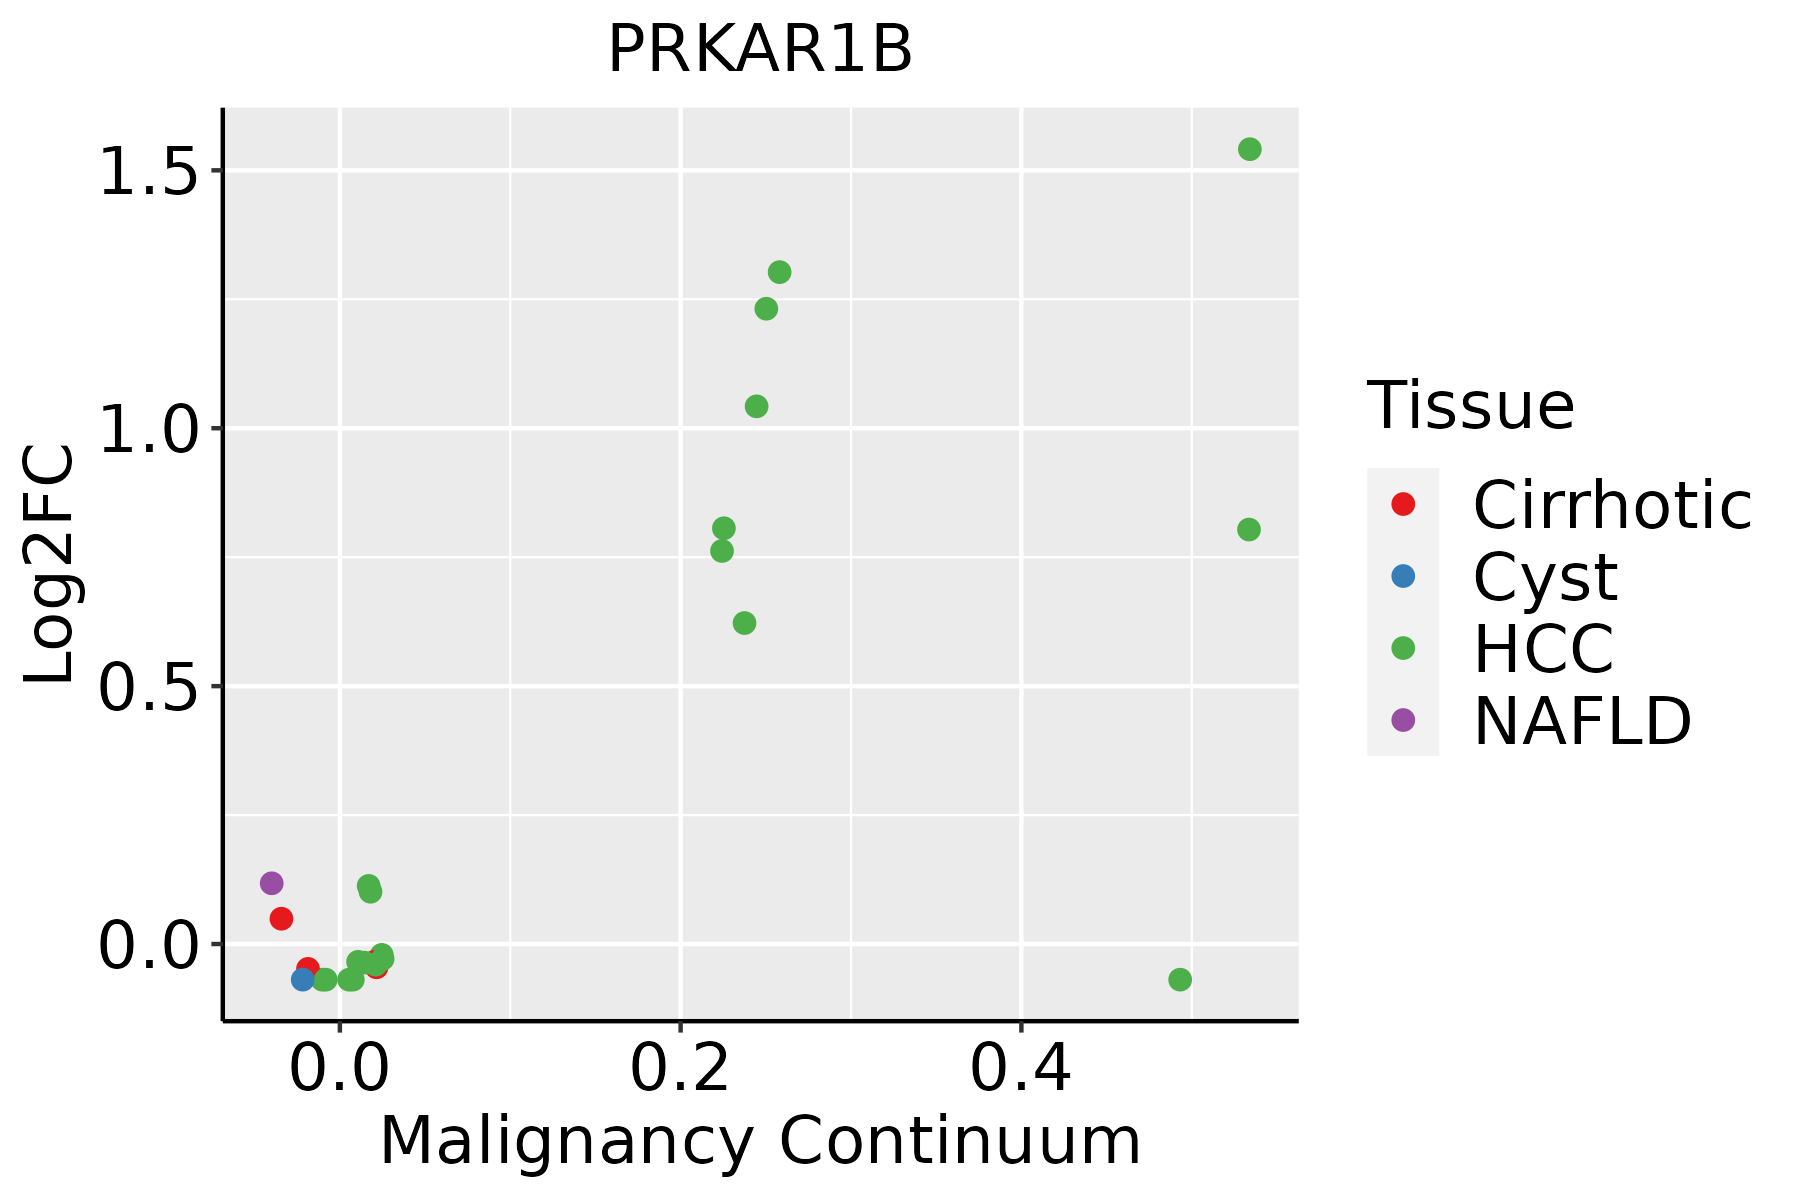 | HCC: Hepatocellular carcinoma |
| NAFLD: Non-alcoholic fatty liver disease | ||
| Oral Cavity | 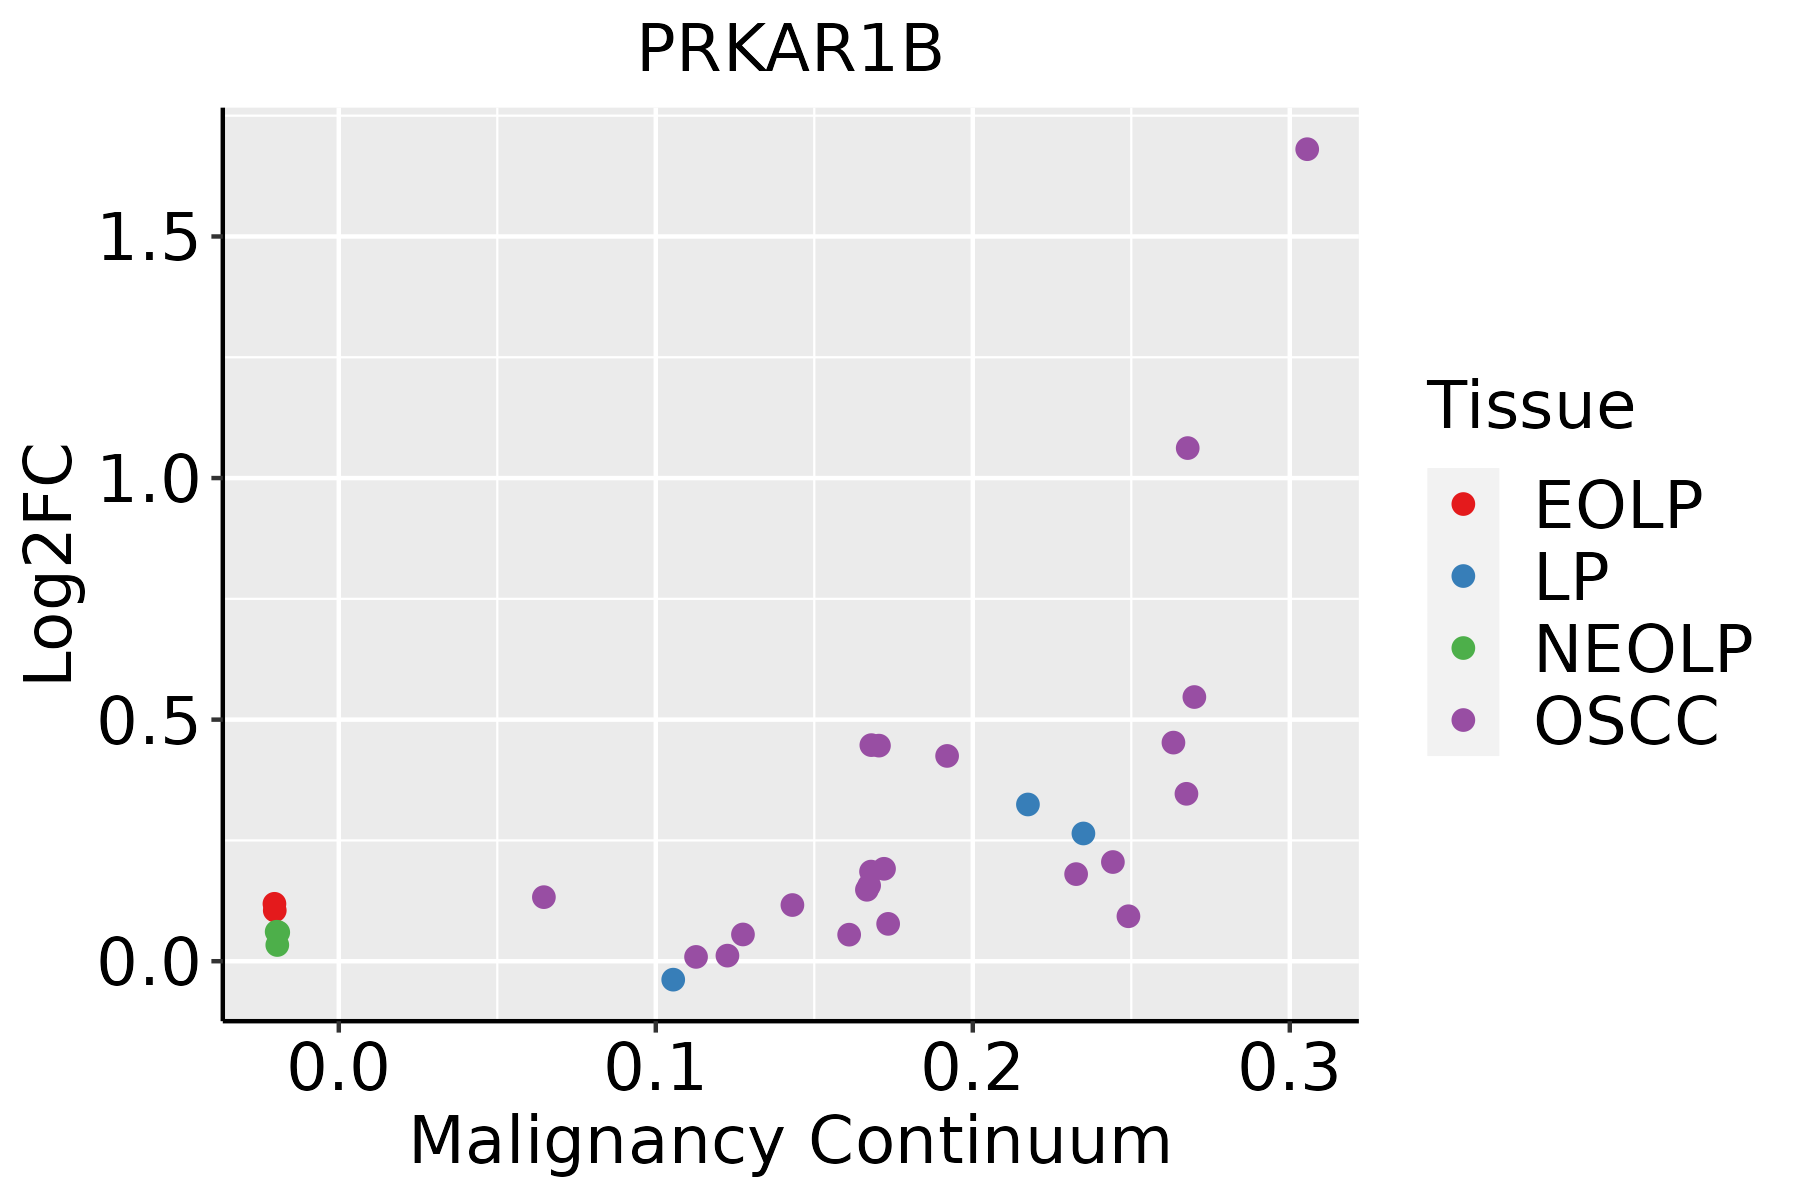 | EOLP: Erosive Oral lichen planus |
| LP: leukoplakia | ||
| NEOLP: Non-erosive oral lichen planus | ||
| OSCC: Oral squamous cell carcinoma | ||
| Thyroid |  | ATC: Anaplastic thyroid cancer |
| HT: Hashimoto's thyroiditis | ||
| PTC: Papillary thyroid cancer |
| ∗log2FC in expression of this searched gene in stem-like cells from each diseased tissue sample relative to stem-like cells in normal samples in each tissue plotted against the malignancy continuum. Samples are colored based on if they are from different disease stage. |
Top |
Malignant transformation related pathway analysis |
| Find out the enriched GO biological processes and KEGG pathways involved in transition from healthy to precancer to cancer |
| Tissue | Disease Stage | Enriched GO biological Processes |
| Colorectum | AD |  |
| Colorectum | SER |  |
| Colorectum | MSS |  |
| Colorectum | MSI-H |  |
| Colorectum | FAP |  |
| ∗Top 15 enriched GO BP terms are showed in the bar plot of each disease state in each tissue. Each row represents a significant GO biological process which is colored according to the -log10(p.adjust). |
| Page: 1 2 3 4 5 6 7 8 9 |
| GO ID | Tissue | Disease Stage | Description | Gene Ratio | Bg Ratio | pvalue | p.adjust | Count |
| GO:0010563111 | Esophagus | ESCC | negative regulation of phosphorus metabolic process | 274/8552 | 442/18723 | 2.32e-12 | 9.41e-11 | 274 |
| GO:0045936111 | Esophagus | ESCC | negative regulation of phosphate metabolic process | 273/8552 | 441/18723 | 3.18e-12 | 1.25e-10 | 273 |
| GO:0051348111 | Esophagus | ESCC | negative regulation of transferase activity | 177/8552 | 268/18723 | 1.08e-11 | 4.00e-10 | 177 |
| GO:007190016 | Esophagus | ESCC | regulation of protein serine/threonine kinase activity | 227/8552 | 359/18723 | 1.12e-11 | 4.10e-10 | 227 |
| GO:0042326111 | Esophagus | ESCC | negative regulation of phosphorylation | 237/8552 | 385/18723 | 1.86e-10 | 5.33e-09 | 237 |
| GO:0001933111 | Esophagus | ESCC | negative regulation of protein phosphorylation | 213/8552 | 342/18723 | 3.54e-10 | 9.76e-09 | 213 |
| GO:003367319 | Esophagus | ESCC | negative regulation of kinase activity | 154/8552 | 237/18723 | 1.38e-09 | 3.27e-08 | 154 |
| GO:000646920 | Esophagus | ESCC | negative regulation of protein kinase activity | 140/8552 | 212/18723 | 1.53e-09 | 3.56e-08 | 140 |
| GO:00719014 | Esophagus | ESCC | negative regulation of protein serine/threonine kinase activity | 75/8552 | 120/18723 | 1.48e-04 | 9.88e-04 | 75 |
| GO:001056322 | Liver | HCC | negative regulation of phosphorus metabolic process | 259/7958 | 442/18723 | 4.29e-12 | 1.92e-10 | 259 |
| GO:004593622 | Liver | HCC | negative regulation of phosphate metabolic process | 258/7958 | 441/18723 | 6.00e-12 | 2.60e-10 | 258 |
| GO:004232622 | Liver | HCC | negative regulation of phosphorylation | 227/7958 | 385/18723 | 3.98e-11 | 1.52e-09 | 227 |
| GO:005134822 | Liver | HCC | negative regulation of transferase activity | 166/7958 | 268/18723 | 8.97e-11 | 3.18e-09 | 166 |
| GO:003367322 | Liver | HCC | negative regulation of kinase activity | 144/7958 | 237/18723 | 9.76e-09 | 2.45e-07 | 144 |
| GO:000193322 | Liver | HCC | negative regulation of protein phosphorylation | 196/7958 | 342/18723 | 1.95e-08 | 4.63e-07 | 196 |
| GO:000646912 | Liver | HCC | negative regulation of protein kinase activity | 126/7958 | 212/18723 | 4.55e-07 | 7.49e-06 | 126 |
| GO:007190021 | Liver | HCC | regulation of protein serine/threonine kinase activity | 189/7958 | 359/18723 | 5.97e-05 | 5.47e-04 | 189 |
| GO:0071901 | Liver | HCC | negative regulation of protein serine/threonine kinase activity | 66/7958 | 120/18723 | 3.81e-03 | 1.68e-02 | 66 |
| GO:005134820 | Oral cavity | OSCC | negative regulation of transferase activity | 165/7305 | 268/18723 | 5.02e-14 | 2.74e-12 | 165 |
| GO:001056320 | Oral cavity | OSCC | negative regulation of phosphorus metabolic process | 246/7305 | 442/18723 | 6.12e-13 | 2.89e-11 | 246 |
| Page: 1 2 3 |
| Pathway ID | Tissue | Disease Stage | Description | Gene Ratio | Bg Ratio | pvalue | p.adjust | qvalue | Count |
| hsa049109 | Esophagus | ESCC | Insulin signaling pathway | 89/4205 | 137/8465 | 1.97e-04 | 7.32e-04 | 3.75e-04 | 89 |
| hsa0491014 | Esophagus | ESCC | Insulin signaling pathway | 89/4205 | 137/8465 | 1.97e-04 | 7.32e-04 | 3.75e-04 | 89 |
| hsa0491041 | Liver | HCC | Insulin signaling pathway | 95/4020 | 137/8465 | 1.53e-07 | 1.97e-06 | 1.10e-06 | 95 |
| hsa0491051 | Liver | HCC | Insulin signaling pathway | 95/4020 | 137/8465 | 1.53e-07 | 1.97e-06 | 1.10e-06 | 95 |
| hsa049108 | Oral cavity | OSCC | Insulin signaling pathway | 83/3704 | 137/8465 | 4.83e-05 | 2.00e-04 | 1.02e-04 | 83 |
| hsa0491013 | Oral cavity | OSCC | Insulin signaling pathway | 83/3704 | 137/8465 | 4.83e-05 | 2.00e-04 | 1.02e-04 | 83 |
| Page: 1 |
Top |
Cell-cell communication analysis |
| Identification of potential cell-cell interactions between two cell types and their ligand-receptor pairs for different disease states |
| Ligand | Receptor | LRpair | Pathway | Tissue | Disease Stage |
| Page: 1 |
Top |
Single-cell gene regulatory network inference analysis |
| Find out the significant the regulons (TFs) and the target genes of each regulon across cell types for different disease states |
| TF | Cell Type | Tissue | Disease Stage | Target Gene | RSS | Regulon Activity |
| ∗The dot plots of a searched regulon are shown for all cell subpopulations in each disease state of each tissue based on the regulon specific score inferred using pySCENIC and by calculating the average expression. |
| Page: 1 |
Top |
Somatic mutation of malignant transformation related genes |
| Annotation of somatic variants for genes involved in malignant transformation |
| Hugo Symbol | Variant Class | Variant Classification | dbSNP RS | HGVSc | HGVSp | HGVSp Short | SWISSPROT | BIOTYPE | SIFT | PolyPhen | Tumor Sample Barcode | Tissue | Histology | Sex | Age | Stage | Therapy Types | Drugs | Outcome |
| PRKAR1B | SNV | Missense_Mutation | novel | c.1101G>C | p.Lys367Asn | p.K367N | P31321 | protein_coding | deleterious(0) | benign(0.133) | TCGA-3C-AALI-01 | Breast | breast invasive carcinoma | Female | <65 | I/II | Unspecific | Poly E | Complete Response |
| PRKAR1B | insertion | Frame_Shift_Ins | novel | c.50_51insTCCTTGTTCTGGGCCCCACCCCAGGCTGTCTGCGTATC | p.Cys18ProfsTer43 | p.C18Pfs*43 | P31321 | protein_coding | TCGA-AN-A0FX-01 | Breast | breast invasive carcinoma | Female | <65 | I/II | Unknown | Unknown | SD | ||
| PRKAR1B | SNV | Missense_Mutation | rs147210283 | c.380N>T | p.Ala127Val | p.A127V | P31321 | protein_coding | tolerated(0.06) | benign(0.018) | TCGA-EA-A410-01 | Cervix | cervical & endocervical cancer | Female | <65 | I/II | Unknown | Unknown | SD |
| PRKAR1B | SNV | Missense_Mutation | c.307G>A | p.Glu103Lys | p.E103K | P31321 | protein_coding | deleterious(0.01) | benign(0.082) | TCGA-AA-3502-01 | Colorectum | colon adenocarcinoma | Male | >=65 | I/II | Unknown | Unknown | SD | |
| PRKAR1B | SNV | Missense_Mutation | rs778958450 | c.281N>A | p.Arg94His | p.R94H | P31321 | protein_coding | deleterious(0.01) | benign(0.215) | TCGA-CK-4951-01 | Colorectum | colon adenocarcinoma | Female | >=65 | I/II | Unknown | Unknown | PD |
| PRKAR1B | SNV | Missense_Mutation | rs764518494 | c.106N>A | p.Val36Ile | p.V36I | P31321 | protein_coding | tolerated(0.11) | benign(0.159) | TCGA-F4-6460-01 | Colorectum | colon adenocarcinoma | Female | <65 | III/IV | Chemotherapy | capecitabine | PD |
| PRKAR1B | SNV | Missense_Mutation | novel | c.1066G>A | p.Glu356Lys | p.E356K | P31321 | protein_coding | tolerated(0.16) | benign(0.262) | TCGA-F5-6814-01 | Colorectum | rectum adenocarcinoma | Male | <65 | I/II | Unknown | Unknown | SD |
| PRKAR1B | SNV | Missense_Mutation | rs144462255 | c.284N>A | p.Arg95His | p.R95H | P31321 | protein_coding | tolerated(0.08) | benign(0) | TCGA-A5-A2K3-01 | Endometrium | uterine corpus endometrioid carcinoma | Female | >=65 | I/II | Chemotherapy | carboplatin | SD |
| PRKAR1B | SNV | Missense_Mutation | novel | c.697C>T | p.Arg233Cys | p.R233C | P31321 | protein_coding | deleterious(0) | probably_damaging(0.964) | TCGA-A5-A2K5-01 | Endometrium | uterine corpus endometrioid carcinoma | Female | >=65 | I/II | Unknown | Unknown | SD |
| PRKAR1B | SNV | Missense_Mutation | novel | c.30N>T | p.Glu10Asp | p.E10D | P31321 | protein_coding | tolerated(0.58) | benign(0.006) | TCGA-AJ-A3EK-01 | Endometrium | uterine corpus endometrioid carcinoma | Female | <65 | I/II | Chemotherapy | carboplatin | CR |
| Page: 1 2 3 4 |
Top |
Related drugs of malignant transformation related genes |
| Identification of chemicals and drugs interact with genes involved in malignant transfromation |
| (DGIdb 4.0) |
| Entrez ID | Symbol | Category | Interaction Types | Drug Claim Name | Drug Name | PMIDs |
| Page: 1 |

Copyright 2023-Present -The University of Texas Health Science Center at Houston |