
|
|||||
|
 | |
| |
| |
| |
| |
| |
|
Gene: PRKAG1 |
Gene summary for PRKAG1 |
| Gene information | Species | Human | Gene symbol | PRKAG1 | Gene ID | 5571 |
| Gene name | protein kinase AMP-activated non-catalytic subunit gamma 1 | |
| Gene Alias | AMPKG | |
| Cytomap | 12q13.12 | |
| Gene Type | protein-coding | GO ID | GO:0000003 | UniProtAcc | P54619 |
Top |
Malignant transformation analysis |
| Identification of the aberrant gene expression in precancerous and cancerous lesions by comparing the gene expression of stem-like cells in diseased tissues with normal stem cells |
| Entrez ID | Symbol | Replicates | Species | Organ | Tissue | Adj P-value | Log2FC | Malignancy |
| 5571 | PRKAG1 | LZE4T | Human | Esophagus | ESCC | 9.51e-11 | 2.72e-01 | 0.0811 |
| 5571 | PRKAG1 | LZE5T | Human | Esophagus | ESCC | 8.27e-07 | 3.99e-01 | 0.0514 |
| 5571 | PRKAG1 | LZE7T | Human | Esophagus | ESCC | 1.98e-09 | 4.00e-01 | 0.0667 |
| 5571 | PRKAG1 | LZE8T | Human | Esophagus | ESCC | 7.03e-09 | 2.36e-01 | 0.067 |
| 5571 | PRKAG1 | LZE20T | Human | Esophagus | ESCC | 3.70e-11 | 1.91e-01 | 0.0662 |
| 5571 | PRKAG1 | LZE22T | Human | Esophagus | ESCC | 1.38e-04 | 2.72e-01 | 0.068 |
| 5571 | PRKAG1 | LZE24T | Human | Esophagus | ESCC | 1.78e-27 | 5.63e-01 | 0.0596 |
| 5571 | PRKAG1 | LZE21T | Human | Esophagus | ESCC | 1.30e-08 | 3.58e-01 | 0.0655 |
| 5571 | PRKAG1 | LZE6T | Human | Esophagus | ESCC | 4.13e-04 | 2.92e-01 | 0.0845 |
| 5571 | PRKAG1 | P1T-E | Human | Esophagus | ESCC | 3.93e-13 | 6.72e-01 | 0.0875 |
| 5571 | PRKAG1 | P2T-E | Human | Esophagus | ESCC | 5.46e-38 | 6.98e-01 | 0.1177 |
| 5571 | PRKAG1 | P4T-E | Human | Esophagus | ESCC | 6.33e-26 | 5.81e-01 | 0.1323 |
| 5571 | PRKAG1 | P5T-E | Human | Esophagus | ESCC | 4.38e-03 | 1.46e-01 | 0.1327 |
| 5571 | PRKAG1 | P8T-E | Human | Esophagus | ESCC | 7.44e-27 | 4.84e-01 | 0.0889 |
| 5571 | PRKAG1 | P9T-E | Human | Esophagus | ESCC | 1.18e-15 | 2.65e-01 | 0.1131 |
| 5571 | PRKAG1 | P10T-E | Human | Esophagus | ESCC | 1.20e-27 | 4.85e-01 | 0.116 |
| 5571 | PRKAG1 | P11T-E | Human | Esophagus | ESCC | 5.69e-12 | 4.24e-01 | 0.1426 |
| 5571 | PRKAG1 | P12T-E | Human | Esophagus | ESCC | 1.67e-26 | 4.44e-01 | 0.1122 |
| 5571 | PRKAG1 | P15T-E | Human | Esophagus | ESCC | 7.14e-29 | 5.09e-01 | 0.1149 |
| 5571 | PRKAG1 | P16T-E | Human | Esophagus | ESCC | 7.03e-31 | 5.50e-01 | 0.1153 |
| Page: 1 2 3 4 5 6 |
| Tissue | Expression Dynamics | Abbreviation |
| Esophagus |  | ESCC: Esophageal squamous cell carcinoma |
| HGIN: High-grade intraepithelial neoplasias | ||
| LGIN: Low-grade intraepithelial neoplasias | ||
| Liver | 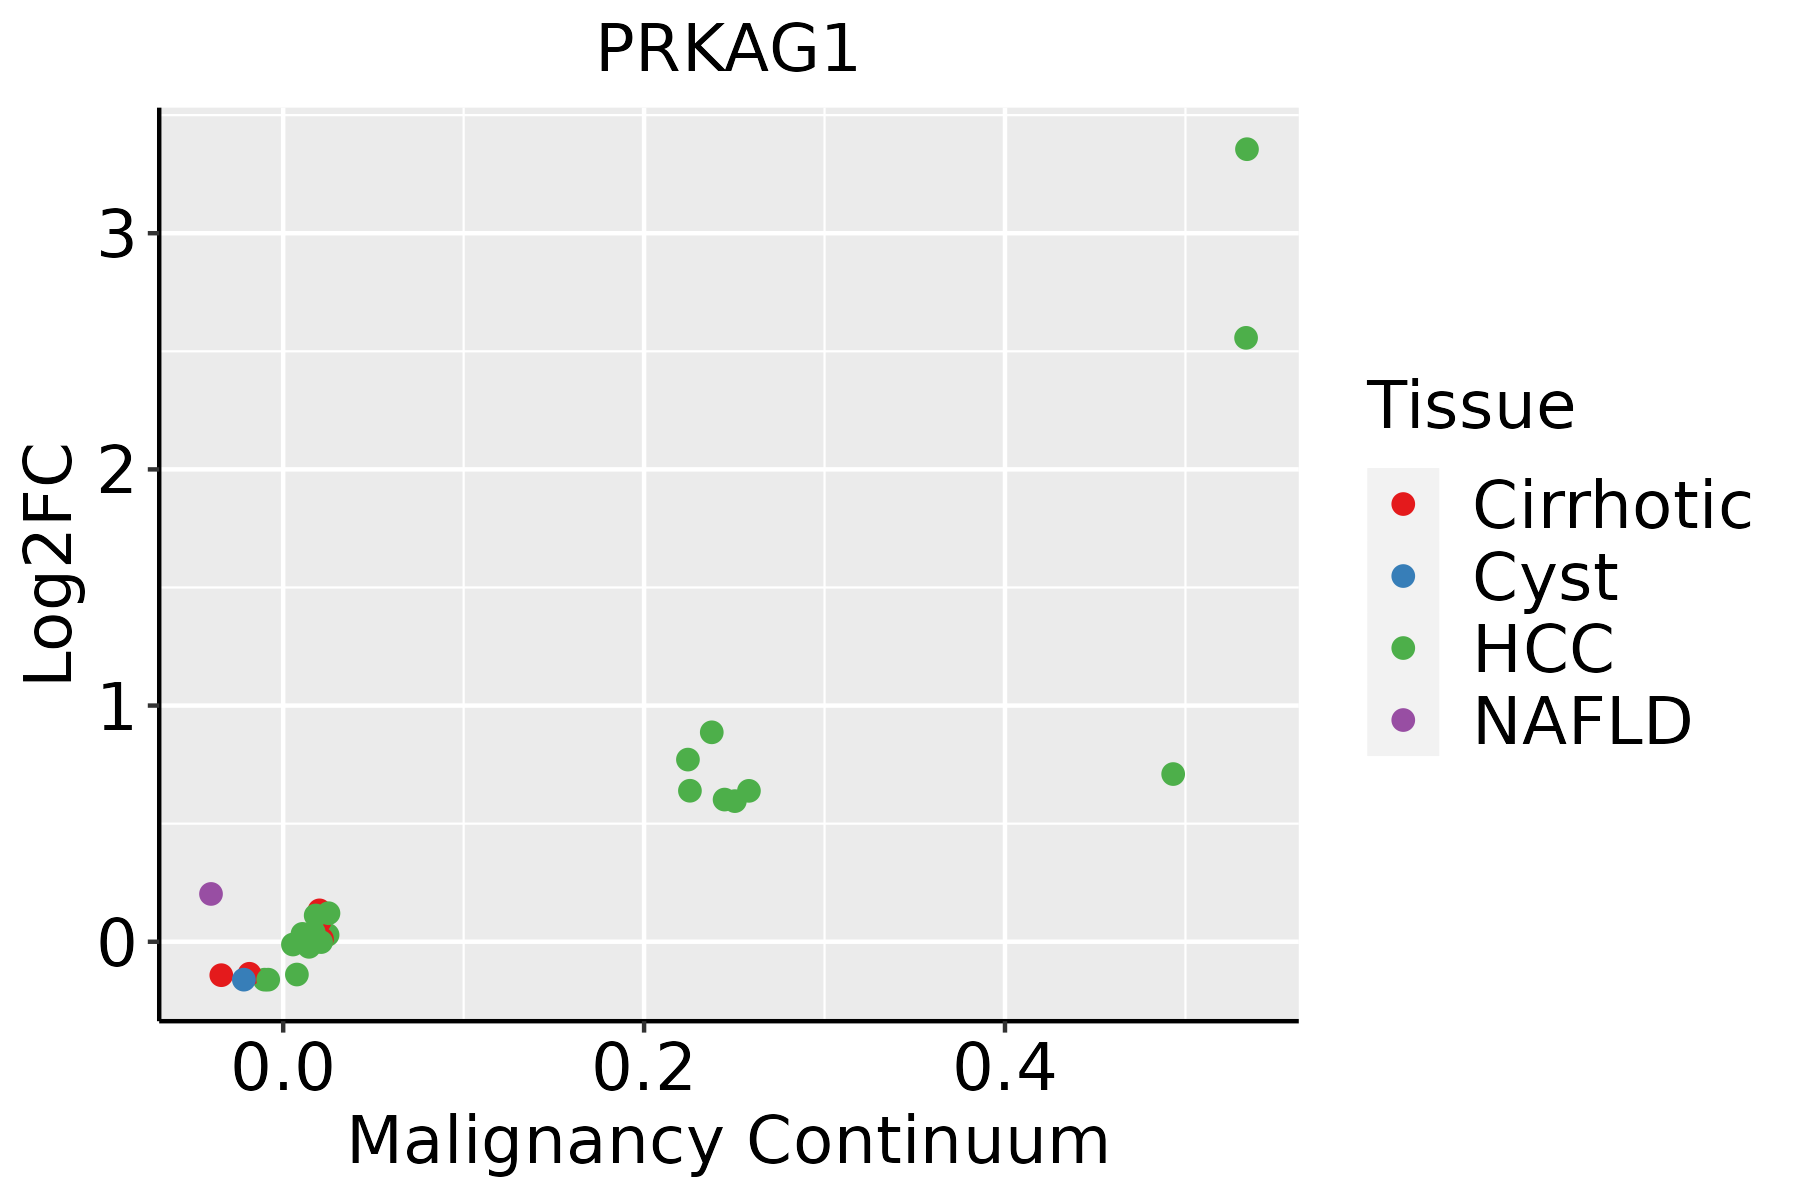 | HCC: Hepatocellular carcinoma |
| NAFLD: Non-alcoholic fatty liver disease | ||
| Oral Cavity | 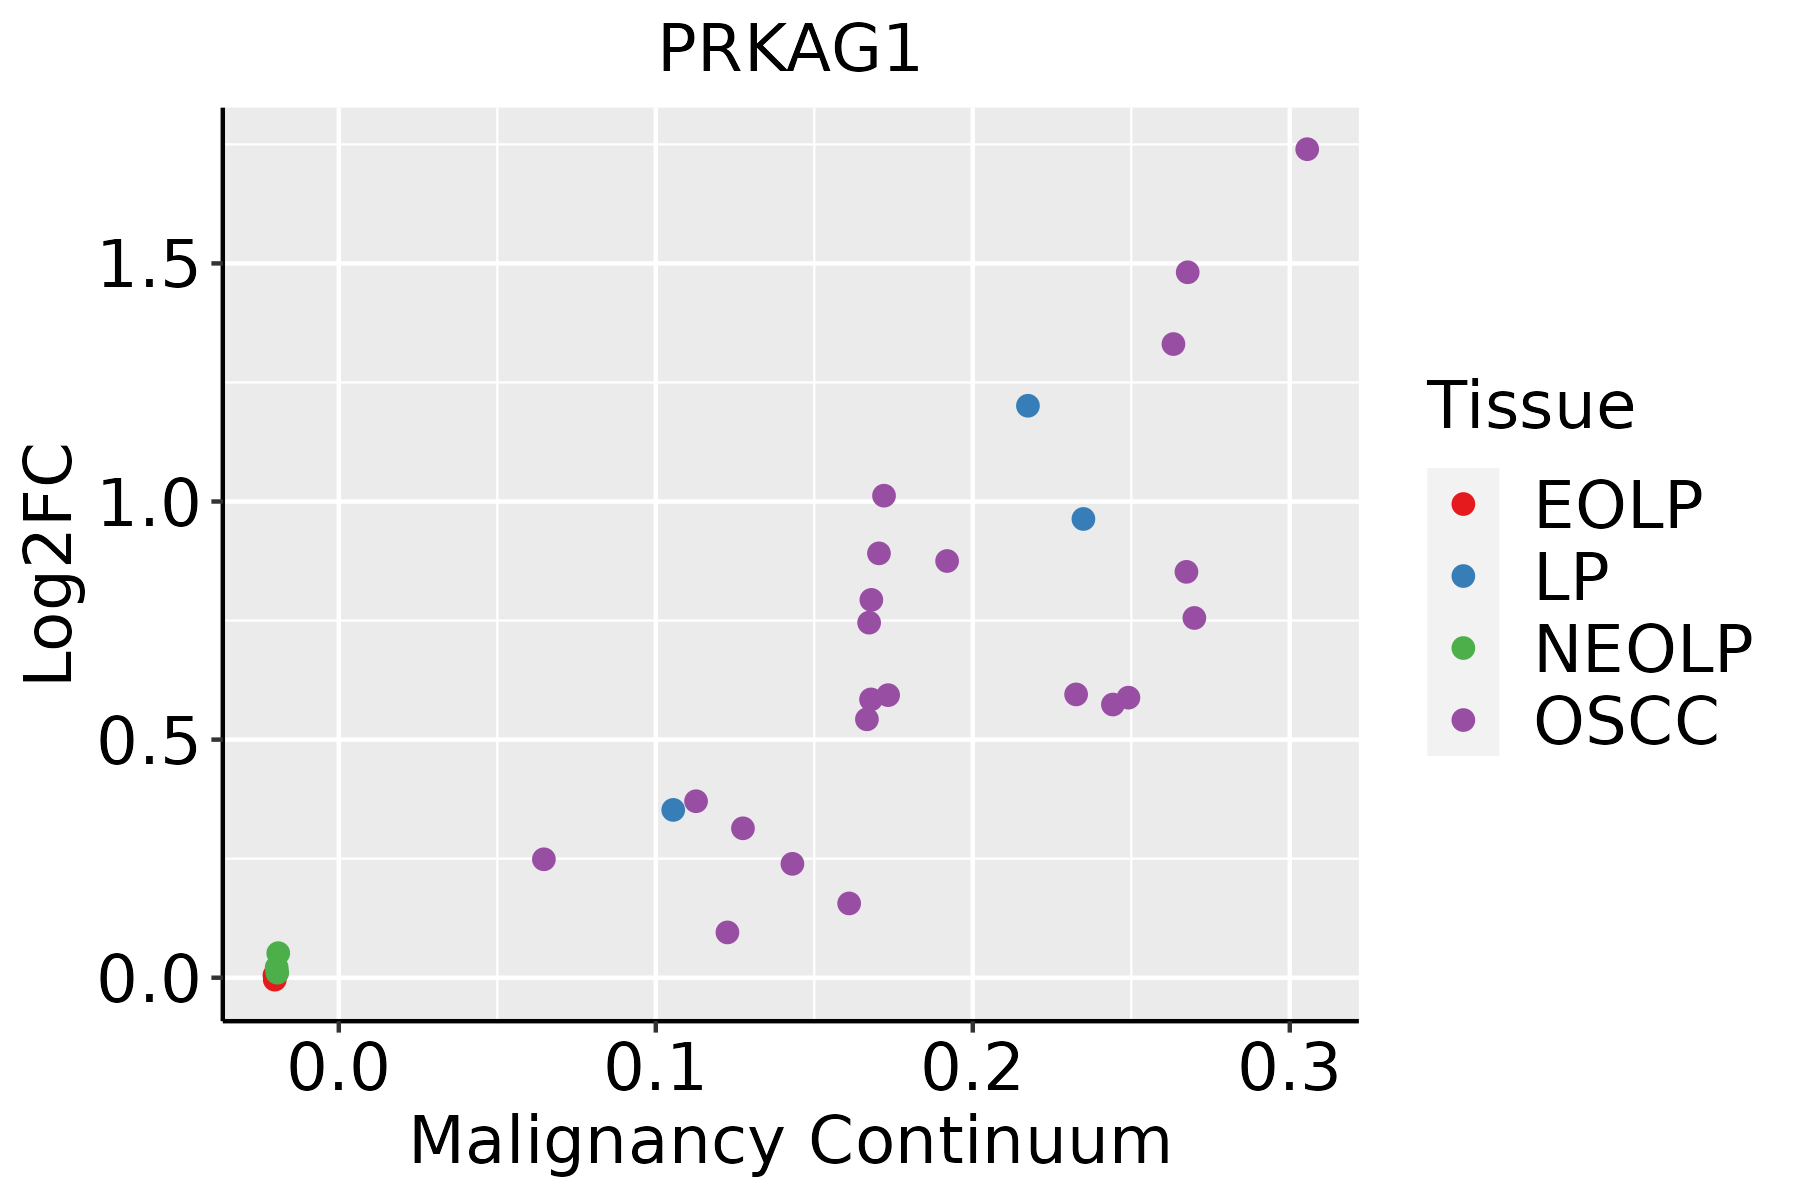 | EOLP: Erosive Oral lichen planus |
| LP: leukoplakia | ||
| NEOLP: Non-erosive oral lichen planus | ||
| OSCC: Oral squamous cell carcinoma | ||
| Skin | 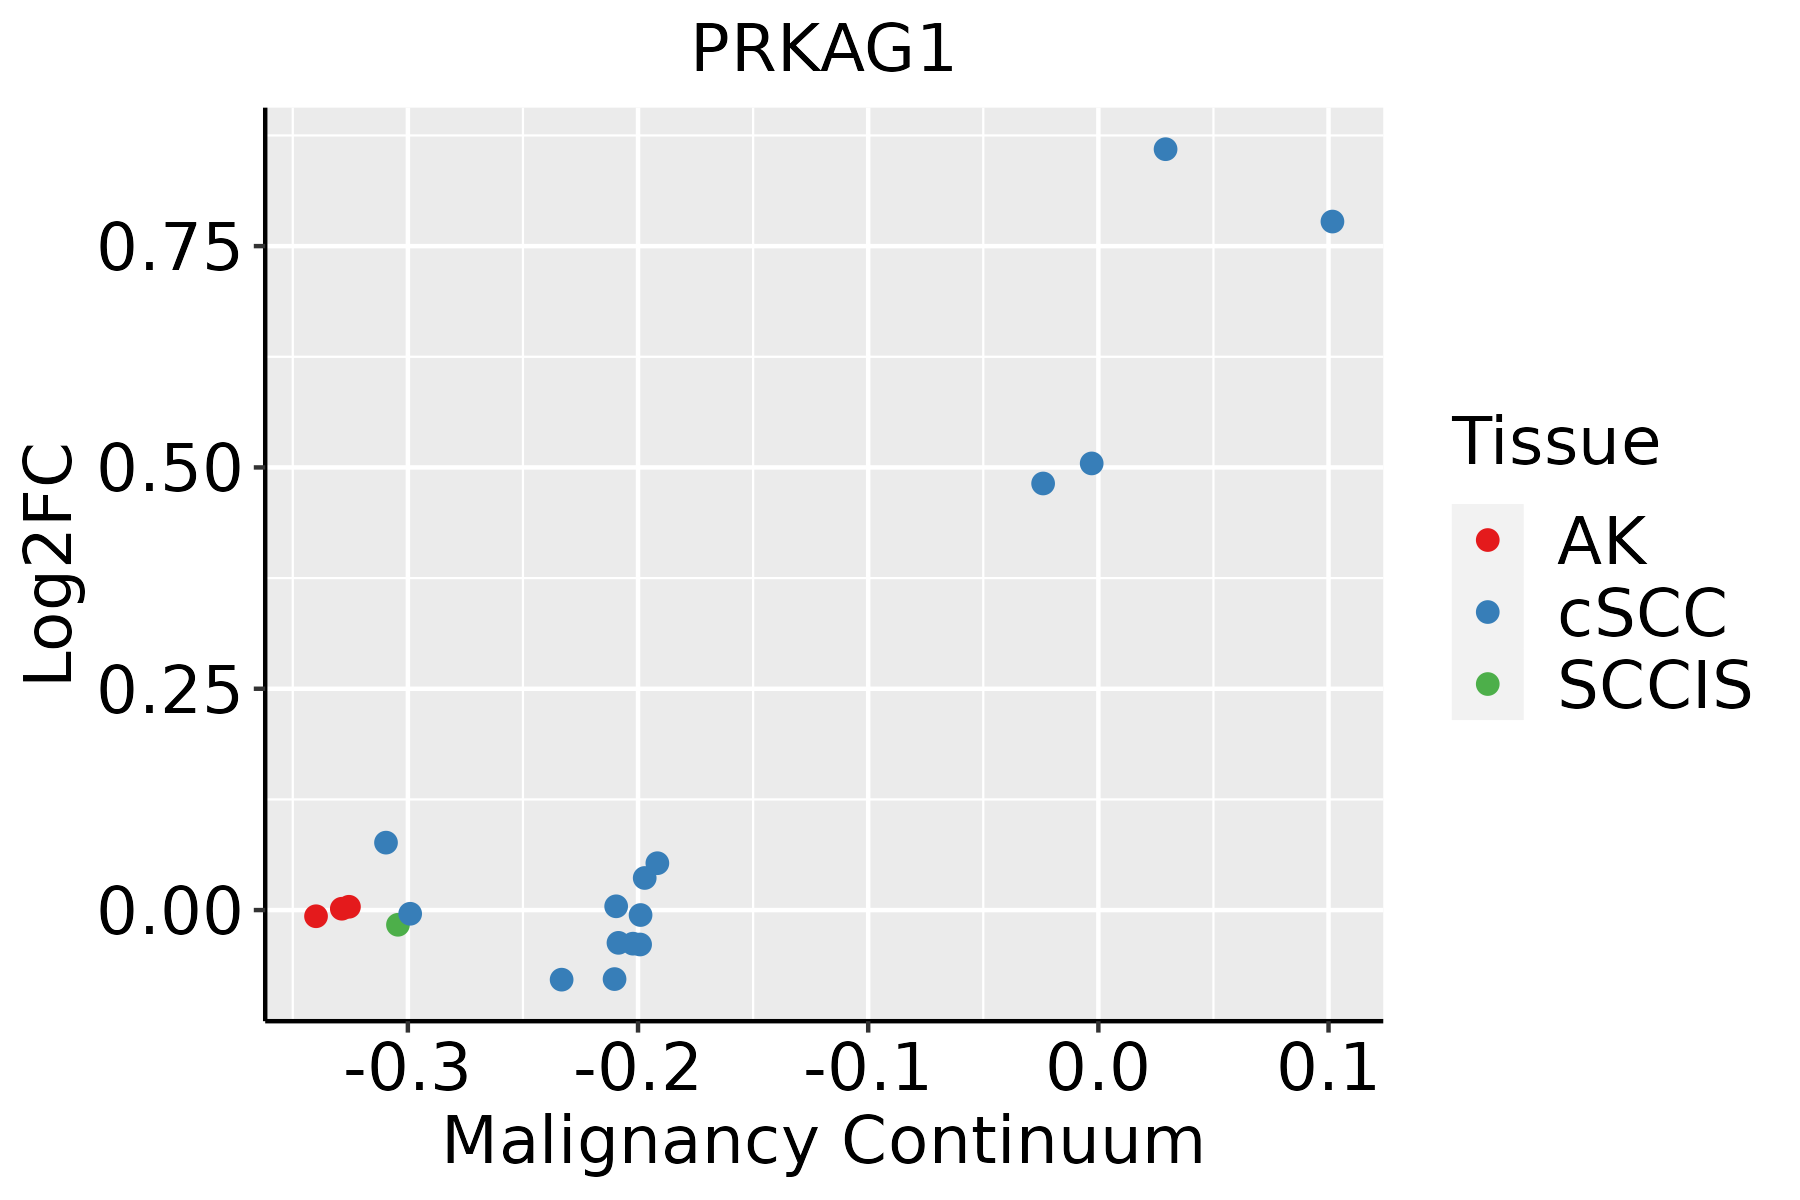 | AK: Actinic keratosis |
| cSCC: Cutaneous squamous cell carcinoma | ||
| SCCIS:squamous cell carcinoma in situ | ||
| Thyroid | 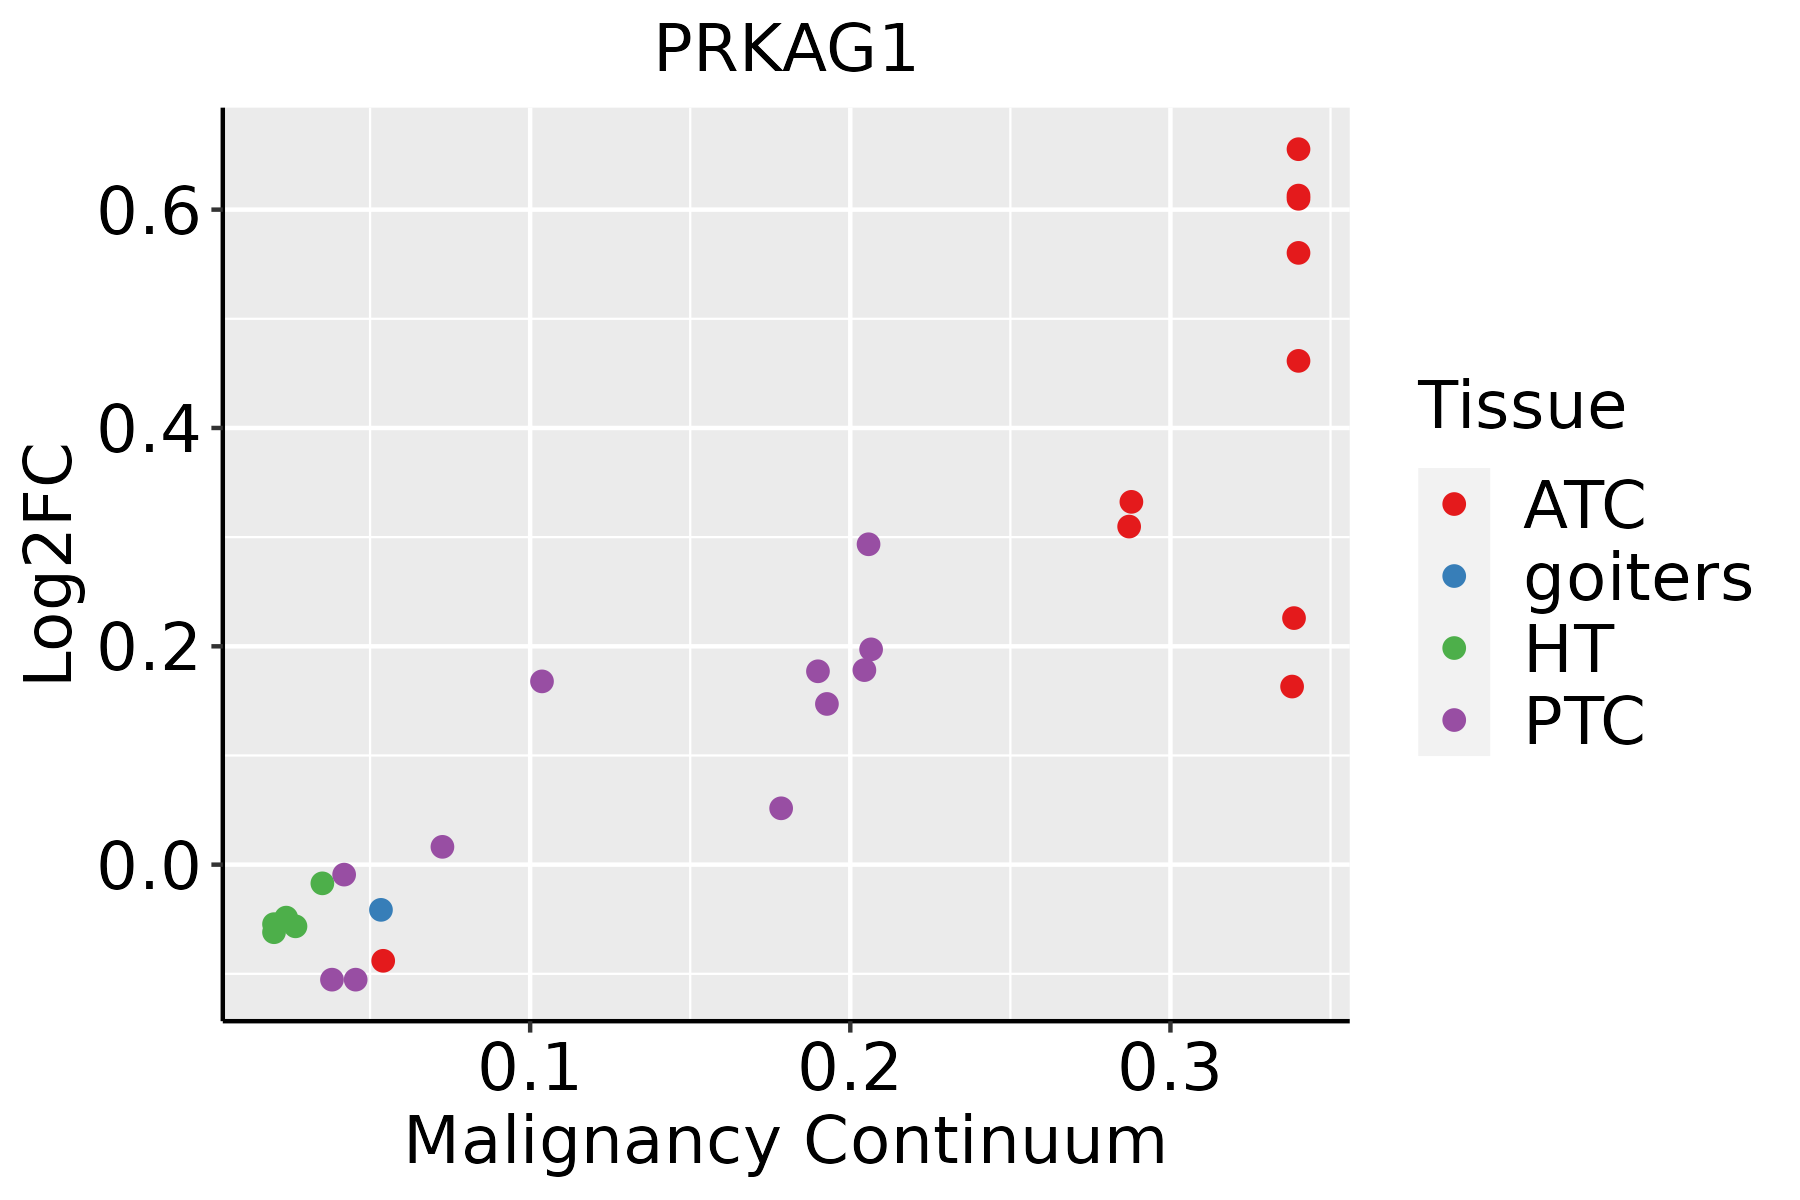 | ATC: Anaplastic thyroid cancer |
| HT: Hashimoto's thyroiditis | ||
| PTC: Papillary thyroid cancer |
| ∗log2FC in expression of this searched gene in stem-like cells from each diseased tissue sample relative to stem-like cells in normal samples in each tissue plotted against the malignancy continuum. Samples are colored based on if they are from different disease stage. |
Top |
Malignant transformation related pathway analysis |
| Find out the enriched GO biological processes and KEGG pathways involved in transition from healthy to precancer to cancer |
| Tissue | Disease Stage | Enriched GO biological Processes |
| Colorectum | AD |  |
| Colorectum | SER |  |
| Colorectum | MSS |  |
| Colorectum | MSI-H |  |
| Colorectum | FAP |  |
| ∗Top 15 enriched GO BP terms are showed in the bar plot of each disease state in each tissue. Each row represents a significant GO biological process which is colored according to the -log10(p.adjust). |
| Page: 1 2 3 4 5 6 7 8 9 |
| GO ID | Tissue | Disease Stage | Description | Gene Ratio | Bg Ratio | pvalue | p.adjust | Count |
| GO:0006913110 | Esophagus | ESCC | nucleocytoplasmic transport | 230/8552 | 301/18723 | 6.04e-28 | 2.02e-25 | 230 |
| GO:0051169110 | Esophagus | ESCC | nuclear transport | 230/8552 | 301/18723 | 6.04e-28 | 2.02e-25 | 230 |
| GO:0006091110 | Esophagus | ESCC | generation of precursor metabolites and energy | 331/8552 | 490/18723 | 3.86e-23 | 8.45e-21 | 331 |
| GO:0071496111 | Esophagus | ESCC | cellular response to external stimulus | 215/8552 | 320/18723 | 4.29e-15 | 2.43e-13 | 215 |
| GO:0046034111 | Esophagus | ESCC | ATP metabolic process | 189/8552 | 277/18723 | 1.99e-14 | 1.04e-12 | 189 |
| GO:0031668111 | Esophagus | ESCC | cellular response to extracellular stimulus | 168/8552 | 246/18723 | 4.93e-13 | 2.23e-11 | 168 |
| GO:0031669110 | Esophagus | ESCC | cellular response to nutrient levels | 148/8552 | 215/18723 | 4.58e-12 | 1.76e-10 | 148 |
| GO:0031667111 | Esophagus | ESCC | response to nutrient levels | 289/8552 | 474/18723 | 9.25e-12 | 3.47e-10 | 289 |
| GO:007190016 | Esophagus | ESCC | regulation of protein serine/threonine kinase activity | 227/8552 | 359/18723 | 1.12e-11 | 4.10e-10 | 227 |
| GO:0009267110 | Esophagus | ESCC | cellular response to starvation | 110/8552 | 156/18723 | 2.63e-10 | 7.37e-09 | 110 |
| GO:004259419 | Esophagus | ESCC | response to starvation | 133/8552 | 197/18723 | 4.31e-10 | 1.14e-08 | 133 |
| GO:005117014 | Esophagus | ESCC | import into nucleus | 111/8552 | 159/18723 | 5.69e-10 | 1.44e-08 | 111 |
| GO:0006753110 | Esophagus | ESCC | nucleoside phosphate metabolic process | 288/8552 | 497/18723 | 1.80e-08 | 3.50e-07 | 288 |
| GO:0019693111 | Esophagus | ESCC | ribose phosphate metabolic process | 234/8552 | 396/18723 | 4.24e-08 | 7.76e-07 | 234 |
| GO:0009117111 | Esophagus | ESCC | nucleotide metabolic process | 282/8552 | 489/18723 | 4.70e-08 | 8.50e-07 | 282 |
| GO:0009259111 | Esophagus | ESCC | ribonucleotide metabolic process | 224/8552 | 385/18723 | 4.41e-07 | 6.00e-06 | 224 |
| GO:0072521111 | Esophagus | ESCC | purine-containing compound metabolic process | 238/8552 | 416/18723 | 1.20e-06 | 1.49e-05 | 238 |
| GO:0009150111 | Esophagus | ESCC | purine ribonucleotide metabolic process | 213/8552 | 368/18723 | 1.40e-06 | 1.69e-05 | 213 |
| GO:0006163111 | Esophagus | ESCC | purine nucleotide metabolic process | 226/8552 | 396/18723 | 2.81e-06 | 3.21e-05 | 226 |
| GO:004586018 | Esophagus | ESCC | positive regulation of protein kinase activity | 219/8552 | 386/18723 | 6.91e-06 | 6.97e-05 | 219 |
| Page: 1 2 3 4 5 6 7 8 9 10 11 12 13 14 15 |
| Pathway ID | Tissue | Disease Stage | Description | Gene Ratio | Bg Ratio | pvalue | p.adjust | qvalue | Count |
| hsa04932210 | Esophagus | ESCC | Non-alcoholic fatty liver disease | 122/4205 | 155/8465 | 5.69e-14 | 1.59e-12 | 8.14e-13 | 122 |
| hsa04714211 | Esophagus | ESCC | Thermogenesis | 163/4205 | 232/8465 | 9.22e-11 | 1.14e-09 | 5.86e-10 | 163 |
| hsa040689 | Esophagus | ESCC | FoxO signaling pathway | 89/4205 | 131/8465 | 1.56e-05 | 7.98e-05 | 4.09e-05 | 89 |
| hsa0415210 | Esophagus | ESCC | AMPK signaling pathway | 80/4205 | 121/8465 | 1.73e-04 | 6.67e-04 | 3.42e-04 | 80 |
| hsa049109 | Esophagus | ESCC | Insulin signaling pathway | 89/4205 | 137/8465 | 1.97e-04 | 7.32e-04 | 3.75e-04 | 89 |
| hsa04530211 | Esophagus | ESCC | Tight junction | 105/4205 | 169/8465 | 6.73e-04 | 2.23e-03 | 1.14e-03 | 105 |
| hsa049318 | Esophagus | ESCC | Insulin resistance | 69/4205 | 108/8465 | 1.92e-03 | 5.54e-03 | 2.84e-03 | 69 |
| hsa0421114 | Esophagus | ESCC | Longevity regulating pathway | 58/4205 | 89/8465 | 2.19e-03 | 6.16e-03 | 3.16e-03 | 58 |
| hsa047105 | Esophagus | ESCC | Circadian rhythm | 24/4205 | 34/8465 | 1.09e-02 | 2.51e-02 | 1.29e-02 | 24 |
| hsa0492214 | Esophagus | ESCC | Glucagon signaling pathway | 64/4205 | 107/8465 | 2.18e-02 | 4.80e-02 | 2.46e-02 | 64 |
| hsa0493238 | Esophagus | ESCC | Non-alcoholic fatty liver disease | 122/4205 | 155/8465 | 5.69e-14 | 1.59e-12 | 8.14e-13 | 122 |
| hsa04714310 | Esophagus | ESCC | Thermogenesis | 163/4205 | 232/8465 | 9.22e-11 | 1.14e-09 | 5.86e-10 | 163 |
| hsa0406814 | Esophagus | ESCC | FoxO signaling pathway | 89/4205 | 131/8465 | 1.56e-05 | 7.98e-05 | 4.09e-05 | 89 |
| hsa0415213 | Esophagus | ESCC | AMPK signaling pathway | 80/4205 | 121/8465 | 1.73e-04 | 6.67e-04 | 3.42e-04 | 80 |
| hsa0491014 | Esophagus | ESCC | Insulin signaling pathway | 89/4205 | 137/8465 | 1.97e-04 | 7.32e-04 | 3.75e-04 | 89 |
| hsa04530310 | Esophagus | ESCC | Tight junction | 105/4205 | 169/8465 | 6.73e-04 | 2.23e-03 | 1.14e-03 | 105 |
| hsa0493113 | Esophagus | ESCC | Insulin resistance | 69/4205 | 108/8465 | 1.92e-03 | 5.54e-03 | 2.84e-03 | 69 |
| hsa0421115 | Esophagus | ESCC | Longevity regulating pathway | 58/4205 | 89/8465 | 2.19e-03 | 6.16e-03 | 3.16e-03 | 58 |
| hsa0471012 | Esophagus | ESCC | Circadian rhythm | 24/4205 | 34/8465 | 1.09e-02 | 2.51e-02 | 1.29e-02 | 24 |
| hsa0492215 | Esophagus | ESCC | Glucagon signaling pathway | 64/4205 | 107/8465 | 2.18e-02 | 4.80e-02 | 2.46e-02 | 64 |
| Page: 1 2 3 4 5 |
Top |
Cell-cell communication analysis |
| Identification of potential cell-cell interactions between two cell types and their ligand-receptor pairs for different disease states |
| Ligand | Receptor | LRpair | Pathway | Tissue | Disease Stage |
| Page: 1 |
Top |
Single-cell gene regulatory network inference analysis |
| Find out the significant the regulons (TFs) and the target genes of each regulon across cell types for different disease states |
| TF | Cell Type | Tissue | Disease Stage | Target Gene | RSS | Regulon Activity |
| ∗The dot plots of a searched regulon are shown for all cell subpopulations in each disease state of each tissue based on the regulon specific score inferred using pySCENIC and by calculating the average expression. |
| Page: 1 |
Top |
Somatic mutation of malignant transformation related genes |
| Annotation of somatic variants for genes involved in malignant transformation |
| Hugo Symbol | Variant Class | Variant Classification | dbSNP RS | HGVSc | HGVSp | HGVSp Short | SWISSPROT | BIOTYPE | SIFT | PolyPhen | Tumor Sample Barcode | Tissue | Histology | Sex | Age | Stage | Therapy Types | Drugs | Outcome |
| PRKAG1 | SNV | Missense_Mutation | novel | c.610N>A | p.Glu204Lys | p.E204K | P54619 | protein_coding | deleterious(0.02) | benign(0.171) | TCGA-AC-A5XS-01 | Breast | breast invasive carcinoma | Female | >=65 | I/II | Hormone Therapy | femara | SD |
| PRKAG1 | SNV | Missense_Mutation | c.274N>G | p.Leu92Val | p.L92V | P54619 | protein_coding | tolerated_low_confidence(1) | benign(0) | TCGA-Q1-A73O-01 | Cervix | cervical & endocervical cancer | Female | <65 | I/II | Chemotherapy | cisplatin | CR | |
| PRKAG1 | SNV | Missense_Mutation | c.209N>A | p.Arg70Gln | p.R70Q | P54619 | protein_coding | deleterious(0.01) | probably_damaging(0.934) | TCGA-A6-6650-01 | Colorectum | colon adenocarcinoma | Female | >=65 | I/II | Unknown | Unknown | SD | |
| PRKAG1 | SNV | Missense_Mutation | c.883N>A | p.Glu295Lys | p.E295K | P54619 | protein_coding | tolerated(0.29) | benign(0.075) | TCGA-A6-A56B-01 | Colorectum | colon adenocarcinoma | Male | <65 | III/IV | Chemotherapy | fluorouracil | PD | |
| PRKAG1 | SNV | Missense_Mutation | c.923N>A | p.Arg308Gln | p.R308Q | P54619 | protein_coding | deleterious(0) | probably_damaging(0.999) | TCGA-AA-3679-01 | Colorectum | colon adenocarcinoma | Male | <65 | III/IV | Chemotherapy | folinic | SD | |
| PRKAG1 | SNV | Missense_Mutation | rs765950307 | c.8N>T | p.Thr3Met | p.T3M | P54619 | protein_coding | tolerated_low_confidence(0.16) | benign(0.019) | TCGA-AA-3811-01 | Colorectum | colon adenocarcinoma | Female | >=65 | III/IV | Unknown | Unknown | PD |
| PRKAG1 | SNV | Missense_Mutation | c.341N>C | p.Gln114Pro | p.Q114P | P54619 | protein_coding | tolerated(0.11) | benign(0.031) | TCGA-AY-5543-01 | Colorectum | colon adenocarcinoma | Female | >=65 | I/II | Chemotherapy | oxaliplatin | SD | |
| PRKAG1 | SNV | Missense_Mutation | c.217C>G | p.Pro73Ala | p.P73A | P54619 | protein_coding | deleterious(0) | benign(0.414) | TCGA-CM-5348-01 | Colorectum | colon adenocarcinoma | Male | >=65 | III/IV | Unknown | Unknown | SD | |
| PRKAG1 | SNV | Missense_Mutation | c.31N>A | p.Pro11Thr | p.P11T | P54619 | protein_coding | tolerated(0.08) | benign(0) | TCGA-CM-6165-01 | Colorectum | colon adenocarcinoma | Male | >=65 | I/II | Unknown | Unknown | SD | |
| PRKAG1 | SNV | Missense_Mutation | c.923G>A | p.Arg308Gln | p.R308Q | P54619 | protein_coding | deleterious(0) | probably_damaging(0.999) | TCGA-DY-A1DD-01 | Colorectum | rectum adenocarcinoma | Female | >=65 | III/IV | Unknown | Unknown | SD |
| Page: 1 2 3 |
Top |
Related drugs of malignant transformation related genes |
| Identification of chemicals and drugs interact with genes involved in malignant transfromation |
| (DGIdb 4.0) |
| Entrez ID | Symbol | Category | Interaction Types | Drug Claim Name | Drug Name | PMIDs |
| 5571 | PRKAG1 | ENZYME, KINASE | METFORMIN | METFORMIN | 26471090 | |
| 5571 | PRKAG1 | ENZYME, KINASE | SAPONARIN | SAPONARIN | 26471090 | |
| 5571 | PRKAG1 | ENZYME, KINASE | metformin | METFORMIN | 22722338 |
| Page: 1 |

Copyright 2023-Present -The University of Texas Health Science Center at Houston |