
|
|||||
|
 | |
| |
| |
| |
| |
| |
|
Gene: PRKACB |
Gene summary for PRKACB |
| Gene information | Species | Human | Gene symbol | PRKACB | Gene ID | 5567 |
| Gene name | protein kinase cAMP-activated catalytic subunit beta | |
| Gene Alias | CAFD2 | |
| Cytomap | 1p31.1 | |
| Gene Type | protein-coding | GO ID | GO:0000003 | UniProtAcc | P22694 |
Top |
Malignant transformation analysis |
| Identification of the aberrant gene expression in precancerous and cancerous lesions by comparing the gene expression of stem-like cells in diseased tissues with normal stem cells |
| Entrez ID | Symbol | Replicates | Species | Organ | Tissue | Adj P-value | Log2FC | Malignancy |
| 5567 | PRKACB | GSM4909301 | Human | Breast | IDC | 5.38e-24 | 5.90e-01 | 0.1577 |
| 5567 | PRKACB | M1 | Human | Breast | IDC | 3.69e-02 | 1.62e-01 | 0.1577 |
| 5567 | PRKACB | NCCBC14 | Human | Breast | DCIS | 5.45e-05 | 3.60e-01 | 0.2021 |
| 5567 | PRKACB | HTA11_3410_2000001011 | Human | Colorectum | AD | 2.38e-14 | -5.77e-01 | 0.0155 |
| 5567 | PRKACB | HTA11_2487_2000001011 | Human | Colorectum | SER | 1.17e-02 | -4.29e-01 | -0.1808 |
| 5567 | PRKACB | HTA11_3361_2000001011 | Human | Colorectum | AD | 1.42e-04 | -5.19e-01 | -0.1207 |
| 5567 | PRKACB | HTA11_696_2000001011 | Human | Colorectum | AD | 1.79e-04 | -3.41e-01 | -0.1464 |
| 5567 | PRKACB | HTA11_866_2000001011 | Human | Colorectum | AD | 8.70e-03 | -3.23e-01 | -0.1001 |
| 5567 | PRKACB | HTA11_1391_2000001011 | Human | Colorectum | AD | 4.66e-05 | -4.40e-01 | -0.059 |
| 5567 | PRKACB | HTA11_866_3004761011 | Human | Colorectum | AD | 6.29e-08 | -4.82e-01 | 0.096 |
| 5567 | PRKACB | HTA11_10711_2000001011 | Human | Colorectum | AD | 9.49e-04 | -4.89e-01 | 0.0338 |
| 5567 | PRKACB | HTA11_7696_3000711011 | Human | Colorectum | AD | 2.02e-15 | -5.17e-01 | 0.0674 |
| 5567 | PRKACB | HTA11_6818_2000001021 | Human | Colorectum | AD | 2.27e-02 | -4.96e-01 | 0.0588 |
| 5567 | PRKACB | HTA11_99999970781_79442 | Human | Colorectum | MSS | 8.53e-13 | -4.76e-01 | 0.294 |
| 5567 | PRKACB | HTA11_99999965104_69814 | Human | Colorectum | MSS | 4.35e-02 | -4.29e-01 | 0.281 |
| 5567 | PRKACB | HTA11_99999971662_82457 | Human | Colorectum | MSS | 5.30e-22 | -6.06e-01 | 0.3859 |
| 5567 | PRKACB | HTA11_99999973899_84307 | Human | Colorectum | MSS | 1.04e-04 | -5.89e-01 | 0.2585 |
| 5567 | PRKACB | HTA11_99999974143_84620 | Human | Colorectum | MSS | 4.24e-27 | -6.13e-01 | 0.3005 |
| 5567 | PRKACB | F007 | Human | Colorectum | FAP | 1.10e-03 | -4.24e-01 | 0.1176 |
| 5567 | PRKACB | A001-C-207 | Human | Colorectum | FAP | 1.12e-02 | -2.87e-01 | 0.1278 |
| Page: 1 2 3 4 5 6 |
| Tissue | Expression Dynamics | Abbreviation |
| Breast | 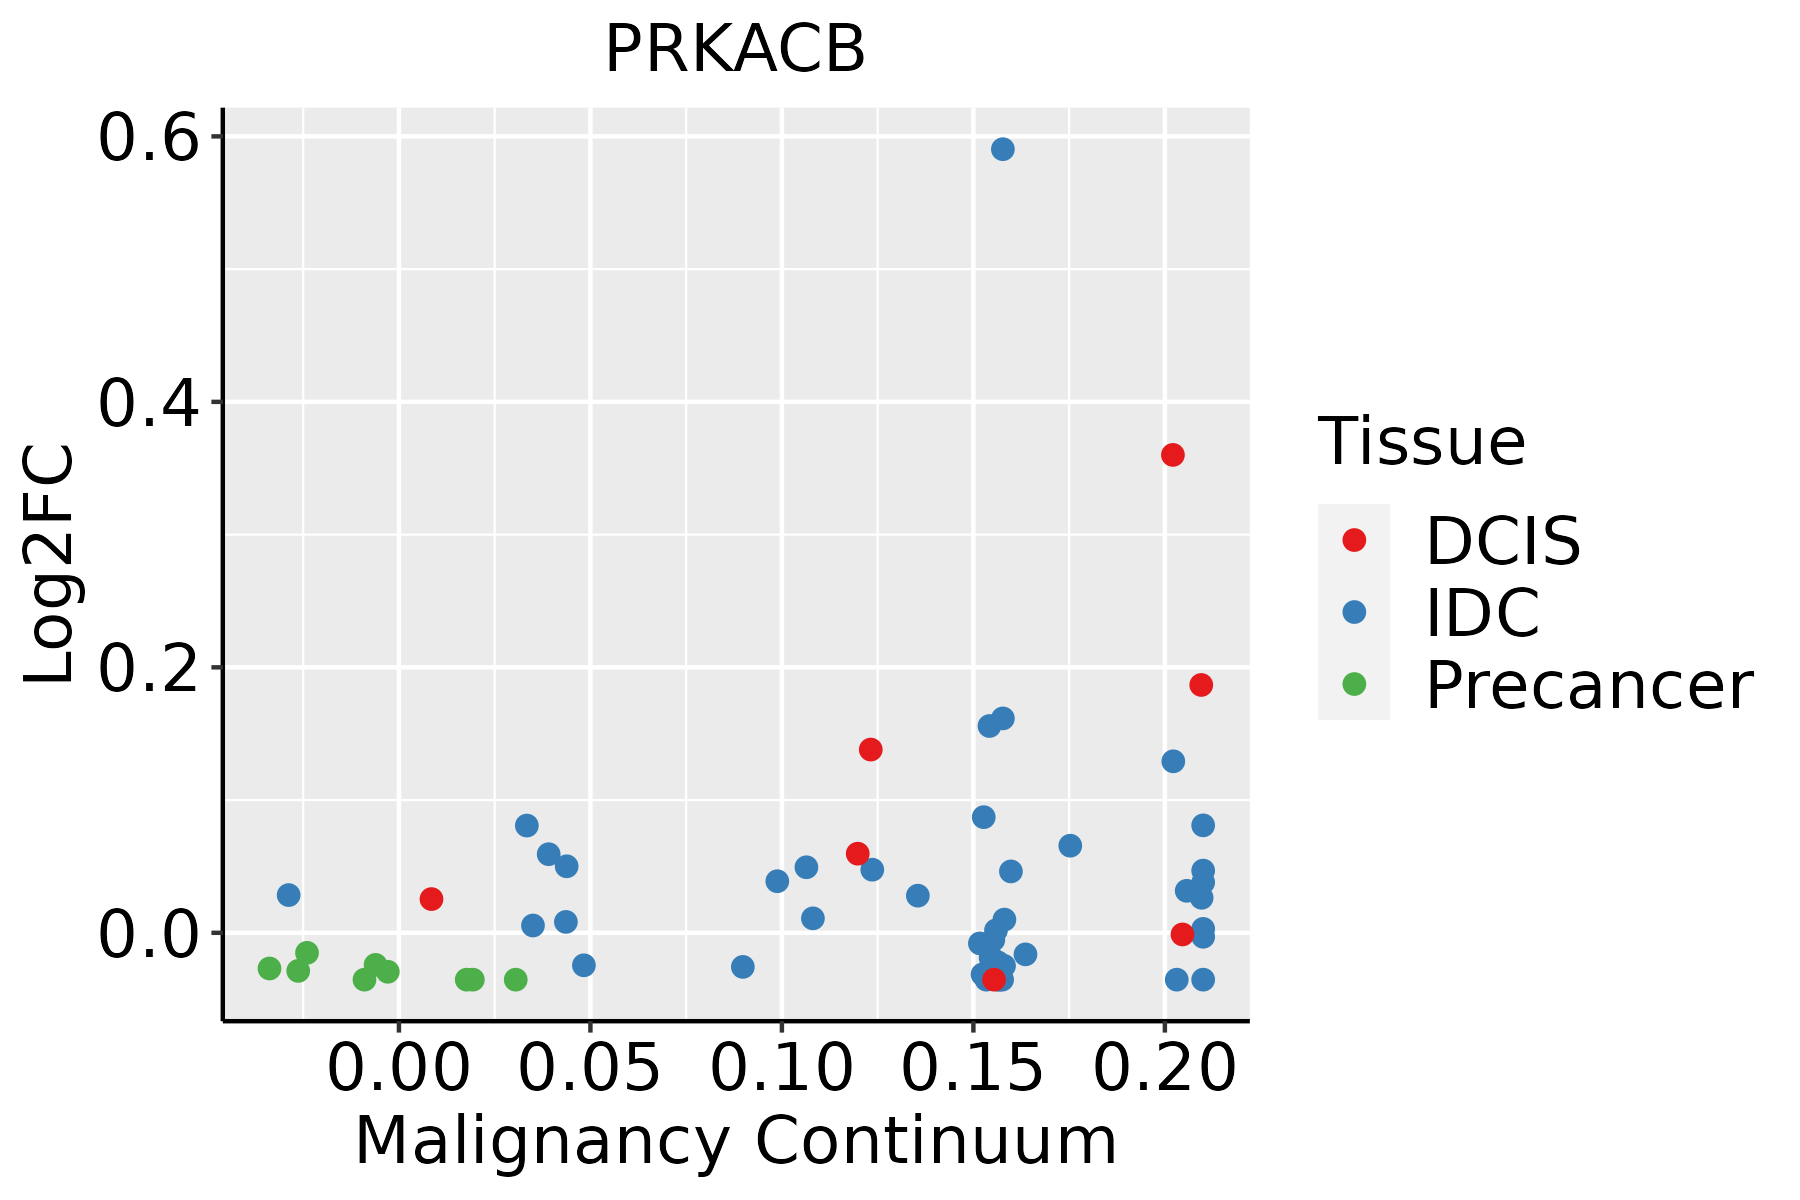 | IDC: Invasive ductal carcinoma |
| DCIS: Ductal carcinoma in situ | ||
| Precancer(BRCA1-mut): Precancerous lesion from BRCA1 mutation carriers | ||
| Colorectum (GSE201348) |  | FAP: Familial adenomatous polyposis |
| CRC: Colorectal cancer | ||
| Colorectum (HTA11) | 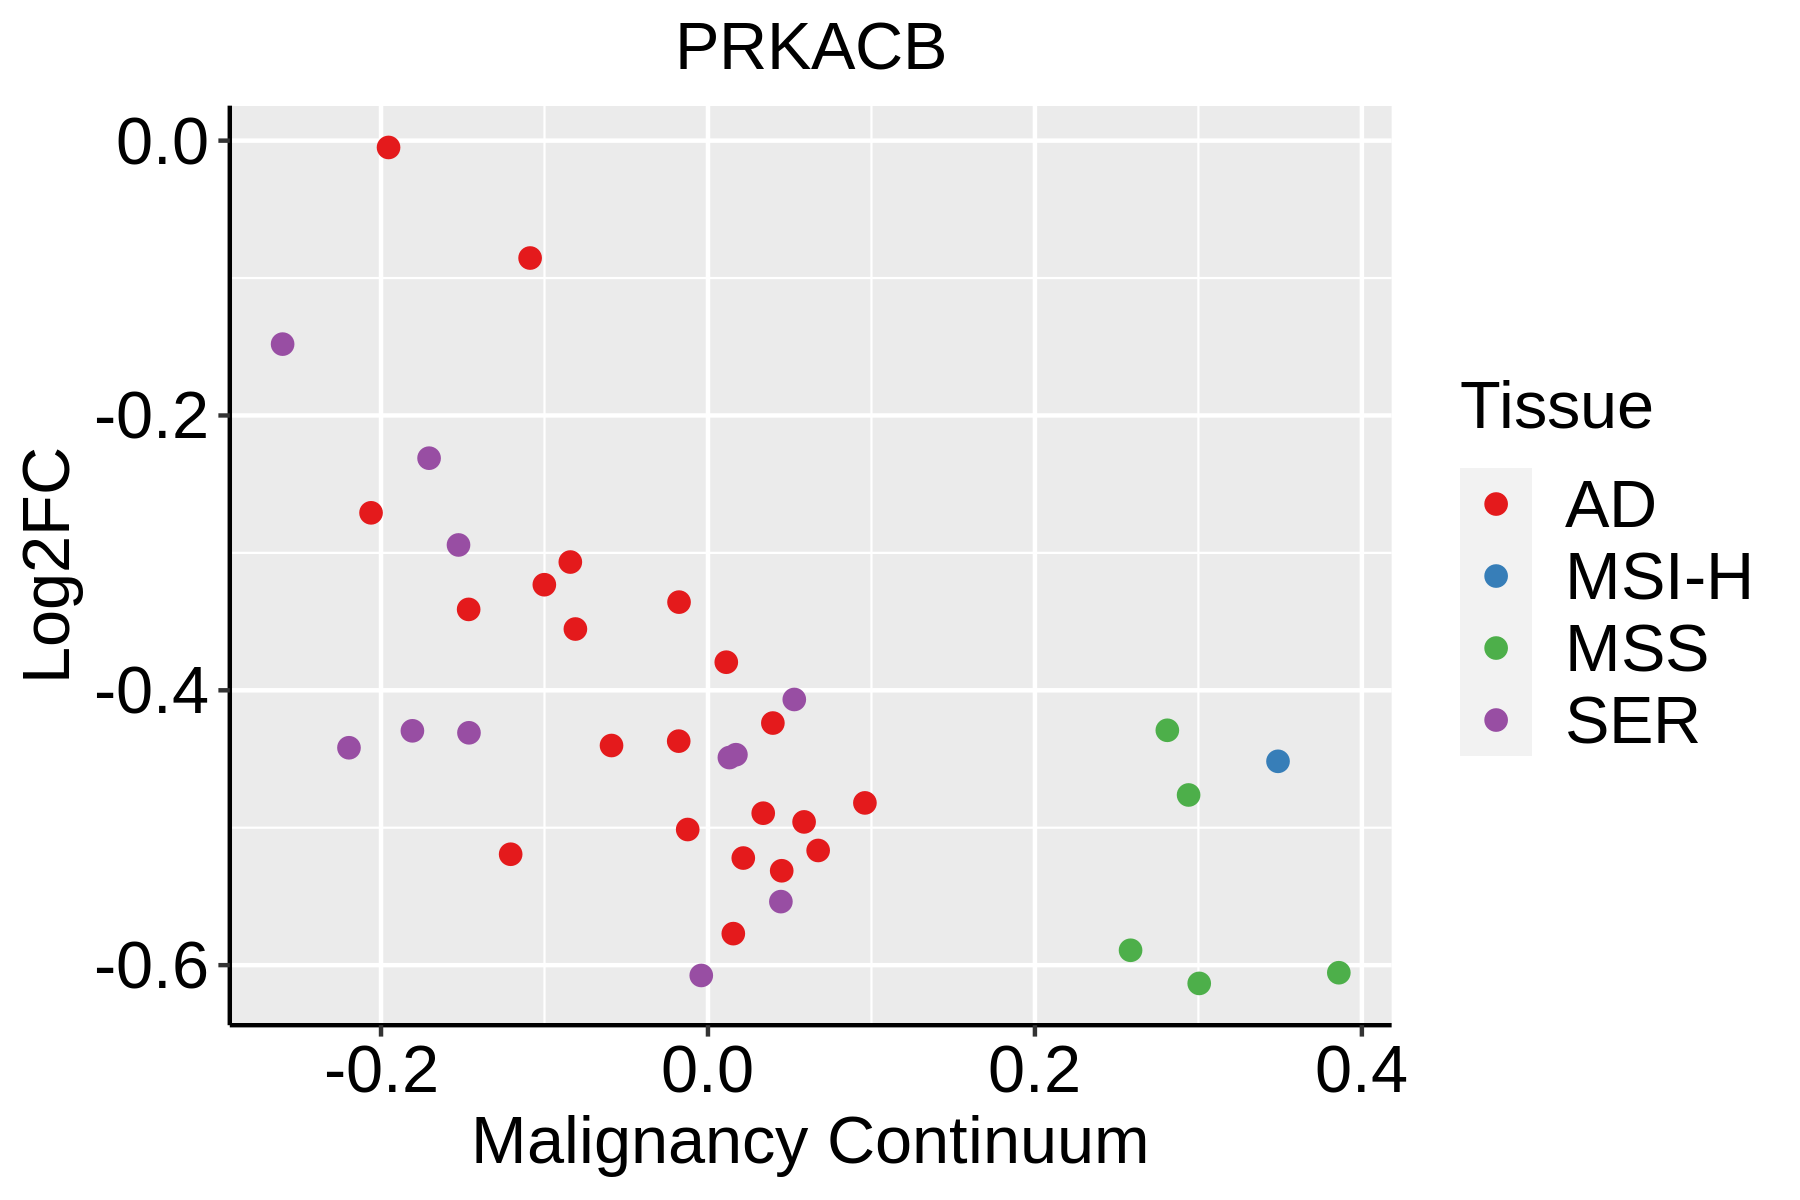 | AD: Adenomas |
| SER: Sessile serrated lesions | ||
| MSI-H: Microsatellite-high colorectal cancer | ||
| MSS: Microsatellite stable colorectal cancer | ||
| Esophagus |  | ESCC: Esophageal squamous cell carcinoma |
| HGIN: High-grade intraepithelial neoplasias | ||
| LGIN: Low-grade intraepithelial neoplasias | ||
| Liver |  | HCC: Hepatocellular carcinoma |
| NAFLD: Non-alcoholic fatty liver disease | ||
| Lung | 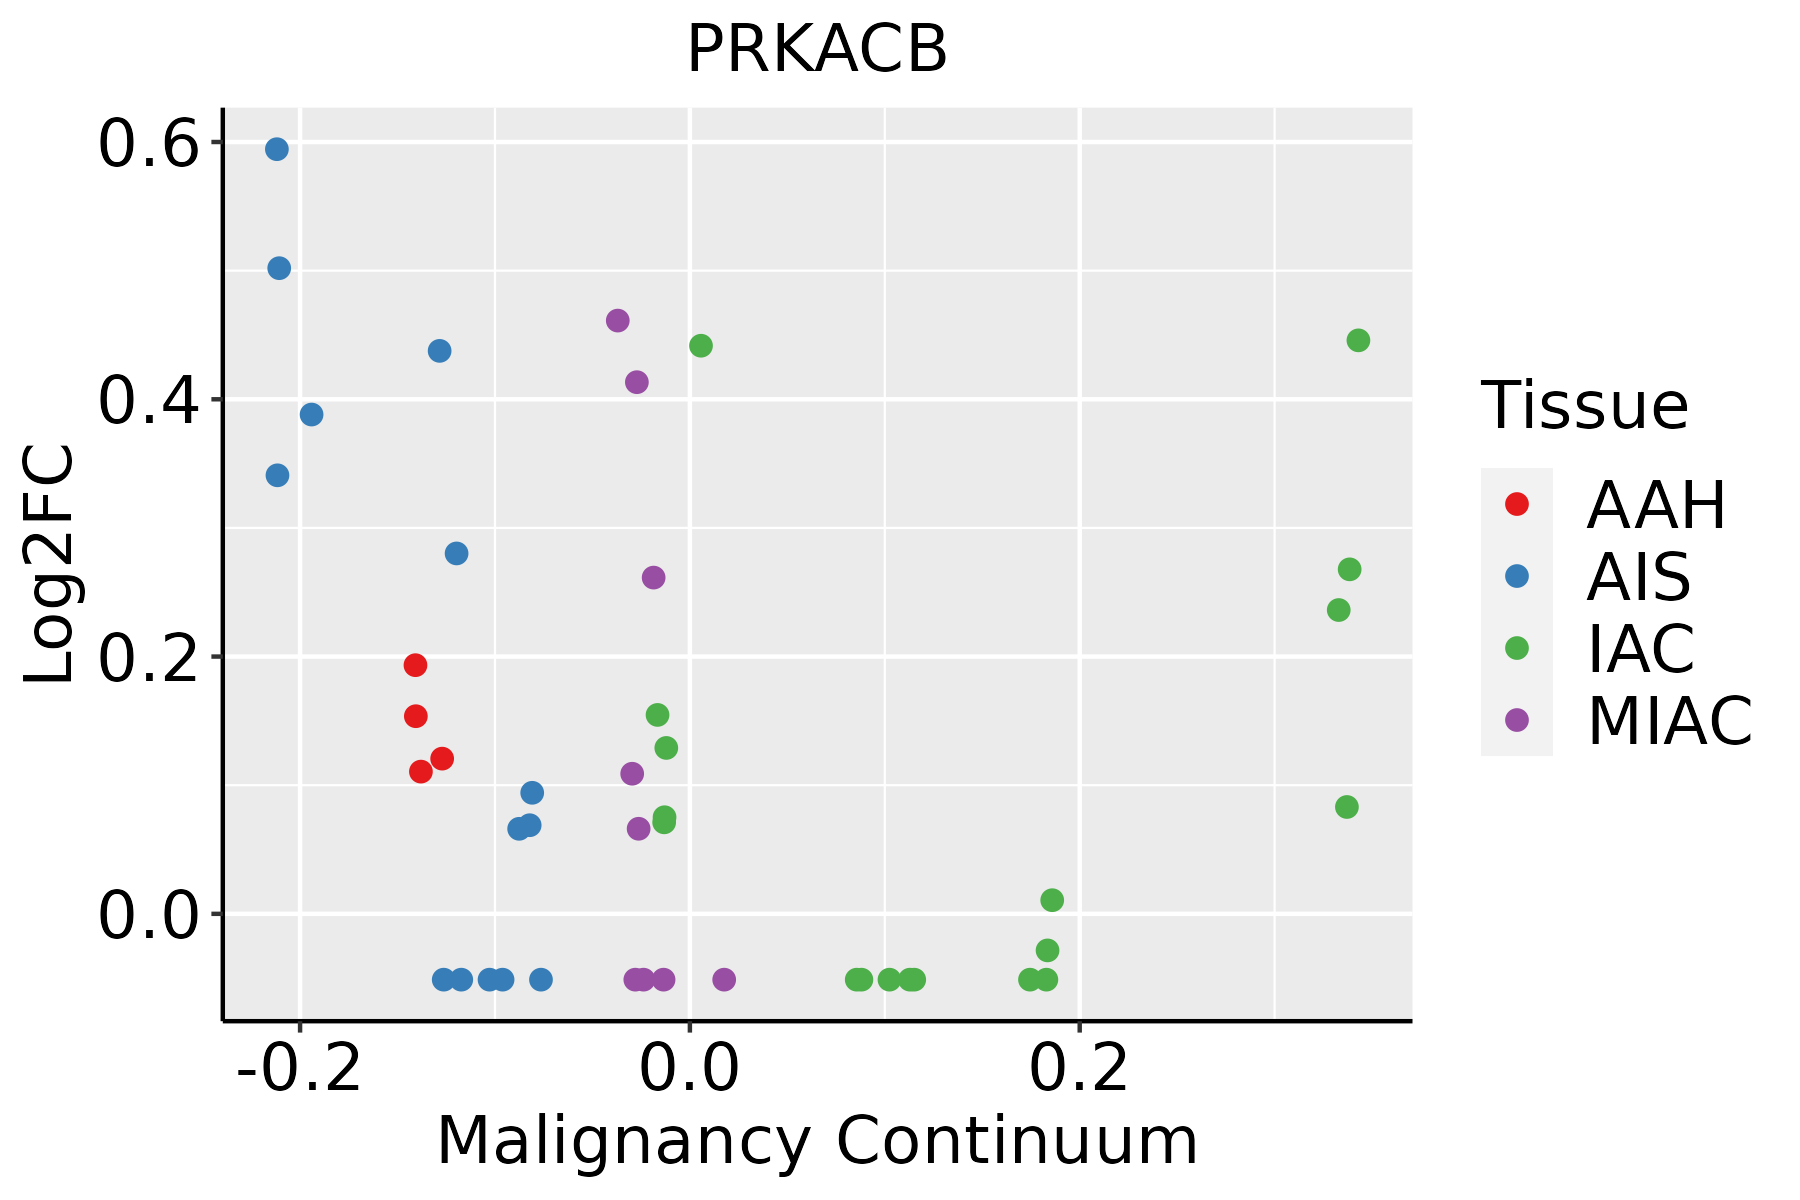 | AAH: Atypical adenomatous hyperplasia |
| AIS: Adenocarcinoma in situ | ||
| IAC: Invasive lung adenocarcinoma | ||
| MIA: Minimally invasive adenocarcinoma | ||
| Prostate | 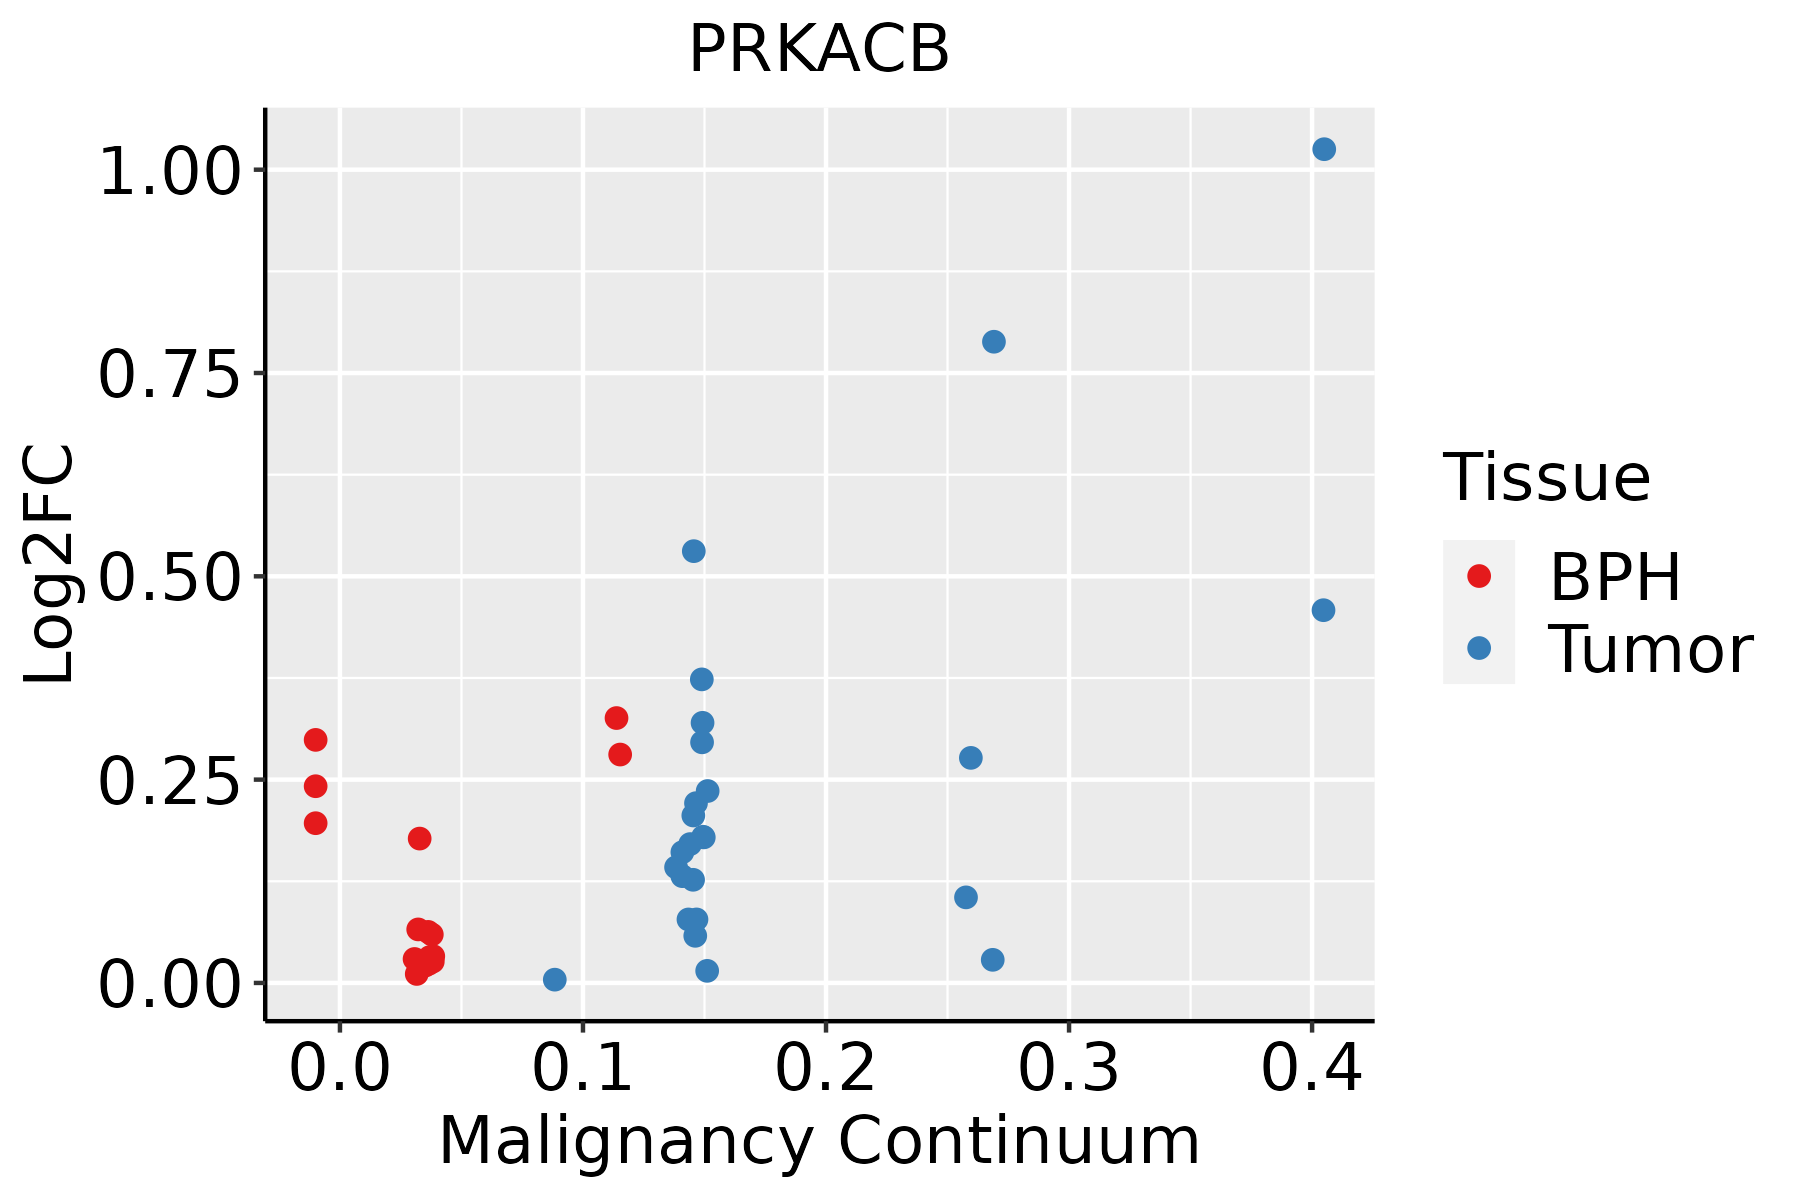 | BPH: Benign Prostatic Hyperplasia |
| Thyroid | 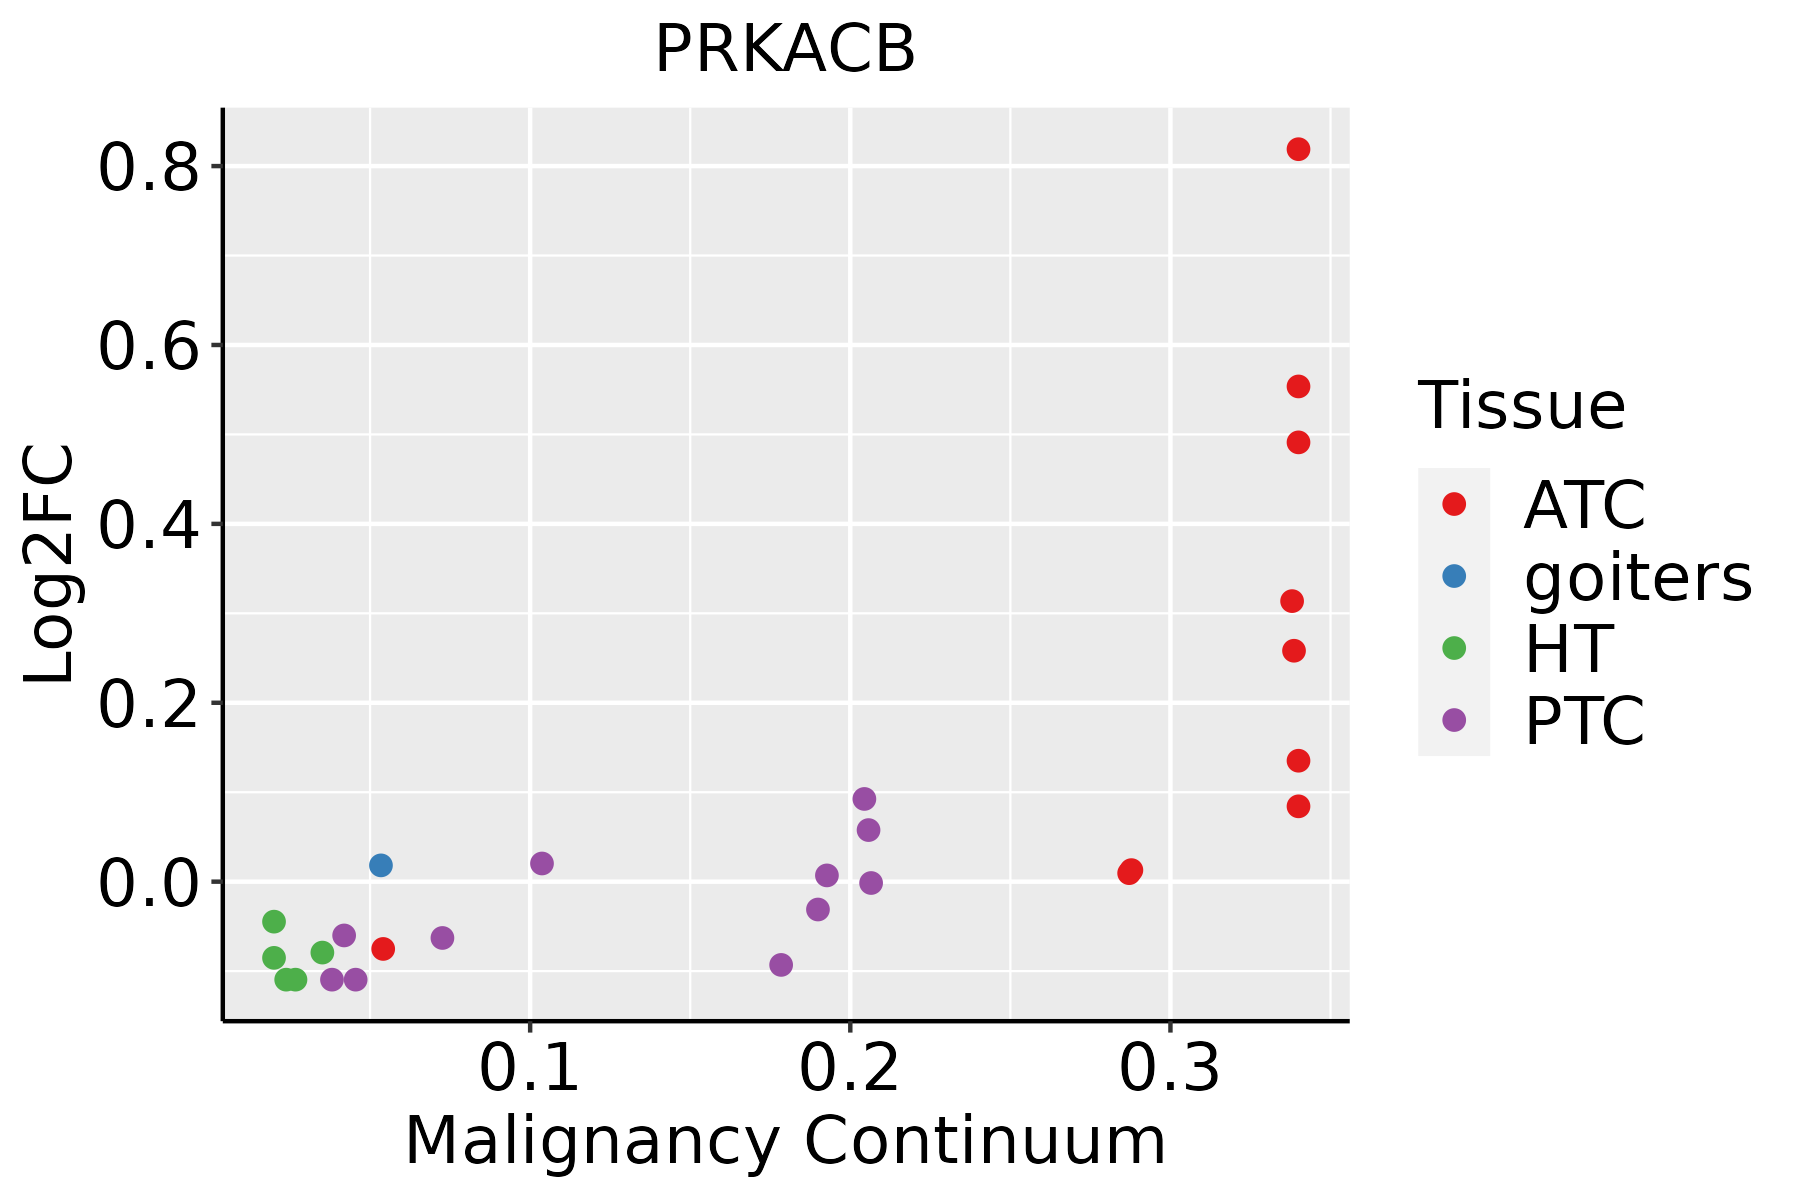 | ATC: Anaplastic thyroid cancer |
| HT: Hashimoto's thyroiditis | ||
| PTC: Papillary thyroid cancer |
| ∗log2FC in expression of this searched gene in stem-like cells from each diseased tissue sample relative to stem-like cells in normal samples in each tissue plotted against the malignancy continuum. Samples are colored based on if they are from different disease stage. |
Top |
Malignant transformation related pathway analysis |
| Find out the enriched GO biological processes and KEGG pathways involved in transition from healthy to precancer to cancer |
| Tissue | Disease Stage | Enriched GO biological Processes |
| Colorectum | AD |  |
| Colorectum | SER |  |
| Colorectum | MSS |  |
| Colorectum | MSI-H |  |
| Colorectum | FAP |  |
| ∗Top 15 enriched GO BP terms are showed in the bar plot of each disease state in each tissue. Each row represents a significant GO biological process which is colored according to the -log10(p.adjust). |
| Page: 1 2 3 4 5 6 7 8 9 |
| GO ID | Tissue | Disease Stage | Description | Gene Ratio | Bg Ratio | pvalue | p.adjust | Count |
| GO:005087813 | Breast | IDC | regulation of body fluid levels | 50/1434 | 379/18723 | 1.12e-04 | 2.10e-03 | 50 |
| GO:006056212 | Breast | IDC | epithelial tube morphogenesis | 44/1434 | 325/18723 | 1.58e-04 | 2.73e-03 | 44 |
| GO:003514812 | Breast | IDC | tube formation | 23/1434 | 148/18723 | 8.79e-04 | 1.02e-02 | 23 |
| GO:000183812 | Breast | IDC | embryonic epithelial tube formation | 19/1434 | 121/18723 | 2.10e-03 | 1.97e-02 | 19 |
| GO:00721756 | Breast | IDC | epithelial tube formation | 19/1434 | 132/18723 | 5.63e-03 | 4.08e-02 | 19 |
| GO:005160413 | Breast | IDC | protein maturation | 35/1434 | 294/18723 | 6.18e-03 | 4.40e-02 | 35 |
| GO:005087823 | Breast | DCIS | regulation of body fluid levels | 50/1390 | 379/18723 | 5.17e-05 | 1.06e-03 | 50 |
| GO:006056221 | Breast | DCIS | epithelial tube morphogenesis | 41/1390 | 325/18723 | 5.98e-04 | 7.60e-03 | 41 |
| GO:003514821 | Breast | DCIS | tube formation | 21/1390 | 148/18723 | 3.08e-03 | 2.62e-02 | 21 |
| GO:000183821 | Breast | DCIS | embryonic epithelial tube formation | 18/1390 | 121/18723 | 3.54e-03 | 2.92e-02 | 18 |
| GO:005160422 | Breast | DCIS | protein maturation | 34/1390 | 294/18723 | 6.72e-03 | 4.66e-02 | 34 |
| GO:00030144 | Breast | DCIS | renal system process | 16/1390 | 110/18723 | 7.16e-03 | 4.85e-02 | 16 |
| GO:0050878 | Colorectum | AD | regulation of body fluid levels | 108/3918 | 379/18723 | 2.54e-04 | 3.20e-03 | 108 |
| GO:0060562 | Colorectum | AD | epithelial tube morphogenesis | 93/3918 | 325/18723 | 5.65e-04 | 6.00e-03 | 93 |
| GO:0051604 | Colorectum | AD | protein maturation | 85/3918 | 294/18723 | 6.73e-04 | 6.91e-03 | 85 |
| GO:0014020 | Colorectum | AD | primary neural tube formation | 33/3918 | 94/18723 | 1.02e-03 | 9.50e-03 | 33 |
| GO:0001841 | Colorectum | AD | neural tube formation | 35/3918 | 102/18723 | 1.16e-03 | 1.05e-02 | 35 |
| GO:0001843 | Colorectum | AD | neural tube closure | 30/3918 | 88/18723 | 2.83e-03 | 2.12e-02 | 30 |
| GO:0060606 | Colorectum | AD | tube closure | 30/3918 | 89/18723 | 3.42e-03 | 2.49e-02 | 30 |
| GO:0035148 | Colorectum | AD | tube formation | 45/3918 | 148/18723 | 4.13e-03 | 2.87e-02 | 45 |
| Page: 1 2 3 4 5 6 7 8 9 |
| Pathway ID | Tissue | Disease Stage | Description | Gene Ratio | Bg Ratio | pvalue | p.adjust | qvalue | Count |
| hsa0501224 | Breast | IDC | Parkinson disease | 107/867 | 266/8465 | 2.57e-39 | 8.36e-37 | 6.26e-37 | 107 |
| hsa0502023 | Breast | IDC | Prion disease | 102/867 | 273/8465 | 3.70e-34 | 4.01e-32 | 3.00e-32 | 102 |
| hsa0453024 | Breast | IDC | Tight junction | 38/867 | 169/8465 | 2.07e-06 | 3.20e-05 | 2.39e-05 | 38 |
| hsa0520523 | Breast | IDC | Proteoglycans in cancer | 42/867 | 205/8465 | 7.69e-06 | 9.99e-05 | 7.48e-05 | 42 |
| hsa0520322 | Breast | IDC | Viral carcinogenesis | 34/867 | 204/8465 | 2.82e-03 | 1.86e-02 | 1.39e-02 | 34 |
| hsa049704 | Breast | IDC | Salivary secretion | 18/867 | 93/8465 | 5.69e-03 | 3.13e-02 | 2.34e-02 | 18 |
| hsa0501234 | Breast | IDC | Parkinson disease | 107/867 | 266/8465 | 2.57e-39 | 8.36e-37 | 6.26e-37 | 107 |
| hsa0502033 | Breast | IDC | Prion disease | 102/867 | 273/8465 | 3.70e-34 | 4.01e-32 | 3.00e-32 | 102 |
| hsa0453034 | Breast | IDC | Tight junction | 38/867 | 169/8465 | 2.07e-06 | 3.20e-05 | 2.39e-05 | 38 |
| hsa0520533 | Breast | IDC | Proteoglycans in cancer | 42/867 | 205/8465 | 7.69e-06 | 9.99e-05 | 7.48e-05 | 42 |
| hsa0520332 | Breast | IDC | Viral carcinogenesis | 34/867 | 204/8465 | 2.82e-03 | 1.86e-02 | 1.39e-02 | 34 |
| hsa0497011 | Breast | IDC | Salivary secretion | 18/867 | 93/8465 | 5.69e-03 | 3.13e-02 | 2.34e-02 | 18 |
| hsa0501243 | Breast | DCIS | Parkinson disease | 106/846 | 266/8465 | 1.64e-39 | 5.29e-37 | 3.90e-37 | 106 |
| hsa0502043 | Breast | DCIS | Prion disease | 100/846 | 273/8465 | 1.44e-33 | 1.55e-31 | 1.14e-31 | 100 |
| hsa0471443 | Breast | DCIS | Thermogenesis | 74/846 | 232/8465 | 8.72e-21 | 3.13e-19 | 2.30e-19 | 74 |
| hsa0491542 | Breast | DCIS | Estrogen signaling pathway | 35/846 | 138/8465 | 1.40e-07 | 2.51e-06 | 1.85e-06 | 35 |
| hsa0453044 | Breast | DCIS | Tight junction | 37/846 | 169/8465 | 3.07e-06 | 4.20e-05 | 3.09e-05 | 37 |
| hsa0511041 | Breast | DCIS | Vibrio cholerae infection | 17/846 | 50/8465 | 3.45e-06 | 4.45e-05 | 3.28e-05 | 17 |
| hsa0520542 | Breast | DCIS | Proteoglycans in cancer | 39/846 | 205/8465 | 5.36e-05 | 5.58e-04 | 4.11e-04 | 39 |
| hsa0516642 | Breast | DCIS | Human T-cell leukemia virus 1 infection | 41/846 | 222/8465 | 7.03e-05 | 6.88e-04 | 5.07e-04 | 41 |
| Page: 1 2 3 4 5 6 7 8 9 10 11 12 13 14 15 16 17 18 19 20 21 22 23 24 25 26 27 |
Top |
Cell-cell communication analysis |
| Identification of potential cell-cell interactions between two cell types and their ligand-receptor pairs for different disease states |
| Ligand | Receptor | LRpair | Pathway | Tissue | Disease Stage |
| Page: 1 |
Top |
Single-cell gene regulatory network inference analysis |
| Find out the significant the regulons (TFs) and the target genes of each regulon across cell types for different disease states |
| TF | Cell Type | Tissue | Disease Stage | Target Gene | RSS | Regulon Activity |
| ∗The dot plots of a searched regulon are shown for all cell subpopulations in each disease state of each tissue based on the regulon specific score inferred using pySCENIC and by calculating the average expression. |
| Page: 1 |
Top |
Somatic mutation of malignant transformation related genes |
| Annotation of somatic variants for genes involved in malignant transformation |
| Hugo Symbol | Variant Class | Variant Classification | dbSNP RS | HGVSc | HGVSp | HGVSp Short | SWISSPROT | BIOTYPE | SIFT | PolyPhen | Tumor Sample Barcode | Tissue | Histology | Sex | Age | Stage | Therapy Types | Drugs | Outcome |
| PRKACB | SNV | Missense_Mutation | novel | c.658C>A | p.Leu220Ile | p.L220I | P22694 | protein_coding | tolerated(0.43) | benign(0.089) | TCGA-AN-A046-01 | Breast | breast invasive carcinoma | Female | >=65 | I/II | Unknown | Unknown | SD |
| PRKACB | SNV | Missense_Mutation | c.732N>T | p.Trp244Cys | p.W244C | P22694 | protein_coding | deleterious(0) | benign(0.102) | TCGA-AA-3815-01 | Colorectum | colon adenocarcinoma | Female | >=65 | I/II | Unknown | Unknown | SD | |
| PRKACB | SNV | Missense_Mutation | c.1022N>A | p.Thr341Asn | p.T341N | P22694 | protein_coding | tolerated(1) | benign(0) | TCGA-CM-4748-01 | Colorectum | colon adenocarcinoma | Male | <65 | III/IV | Chemotherapy | fluorouracil | SD | |
| PRKACB | SNV | Missense_Mutation | novel | c.260N>A | p.Gly87Glu | p.G87E | P22694 | protein_coding | tolerated(0.27) | benign(0.003) | TCGA-AJ-A5DW-01 | Endometrium | uterine corpus endometrioid carcinoma | Female | <65 | I/II | Unknown | Unknown | SD |
| PRKACB | SNV | Missense_Mutation | c.515C>A | p.Pro172His | p.P172H | P22694 | protein_coding | tolerated(0.11) | possibly_damaging(0.833) | TCGA-AP-A051-01 | Endometrium | uterine corpus endometrioid carcinoma | Female | >=65 | I/II | Unknown | Unknown | SD | |
| PRKACB | SNV | Missense_Mutation | novel | c.565N>A | p.Pro189Thr | p.P189T | P22694 | protein_coding | deleterious(0.05) | benign(0.066) | TCGA-AP-A059-01 | Endometrium | uterine corpus endometrioid carcinoma | Female | >=65 | I/II | Unknown | Unknown | SD |
| PRKACB | SNV | Missense_Mutation | rs148797911 | c.259N>A | p.Gly87Arg | p.G87R | P22694 | protein_coding | tolerated(0.13) | benign(0.005) | TCGA-AP-A1DV-01 | Endometrium | uterine corpus endometrioid carcinoma | Female | <65 | I/II | Unknown | Unknown | SD |
| PRKACB | SNV | Missense_Mutation | novel | c.574C>T | p.Arg192Trp | p.R192W | P22694 | protein_coding | deleterious(0.02) | probably_damaging(0.997) | TCGA-AX-A1CE-01 | Endometrium | uterine corpus endometrioid carcinoma | Female | <65 | I/II | Unspecific | Paclitaxel | SD |
| PRKACB | SNV | Missense_Mutation | novel | c.68A>G | p.Glu23Gly | p.E23G | P22694 | protein_coding | tolerated_low_confidence(0.06) | benign(0.223) | TCGA-AX-A2HD-01 | Endometrium | uterine corpus endometrioid carcinoma | Female | >=65 | III/IV | Unknown | Unknown | SD |
| PRKACB | SNV | Missense_Mutation | c.341A>C | p.Glu114Ala | p.E114A | P22694 | protein_coding | tolerated(0.27) | benign(0.015) | TCGA-B5-A0JY-01 | Endometrium | uterine corpus endometrioid carcinoma | Female | <65 | III/IV | Chemotherapy | doxorubicin | SD |
| Page: 1 2 3 4 |
Top |
Related drugs of malignant transformation related genes |
| Identification of chemicals and drugs interact with genes involved in malignant transfromation |
| (DGIdb 4.0) |
| Entrez ID | Symbol | Category | Interaction Types | Drug Claim Name | Drug Name | PMIDs |
| 5567 | PRKACB | ENZYME, KINASE, CLINICALLY ACTIONABLE, G PROTEIN COUPLED RECEPTOR, DRUGGABLE GENOME, SERINE THREONINE KINASE | inhibitor | 178101884 | GSK-690693 | |
| 5567 | PRKACB | ENZYME, KINASE, CLINICALLY ACTIONABLE, G PROTEIN COUPLED RECEPTOR, DRUGGABLE GENOME, SERINE THREONINE KINASE | FASUDIL | FASUDIL | 22257127 | |
| 5567 | PRKACB | ENZYME, KINASE, CLINICALLY ACTIONABLE, G PROTEIN COUPLED RECEPTOR, DRUGGABLE GENOME, SERINE THREONINE KINASE | inhibitor | 135652717 | STAUROSPORINE | |
| 5567 | PRKACB | ENZYME, KINASE, CLINICALLY ACTIONABLE, G PROTEIN COUPLED RECEPTOR, DRUGGABLE GENOME, SERINE THREONINE KINASE | inhibitor | CHEMBL494089 | GSK-690693 |
| Page: 1 |

Copyright 2023-Present -The University of Texas Health Science Center at Houston |