
|
|||||
|
 | |
| |
| |
| |
| |
| |
|
Gene: PRKAB1 |
Gene summary for PRKAB1 |
| Gene information | Species | Human | Gene symbol | PRKAB1 | Gene ID | 5564 |
| Gene name | protein kinase AMP-activated non-catalytic subunit beta 1 | |
| Gene Alias | AMPK | |
| Cytomap | 12q24.23 | |
| Gene Type | protein-coding | GO ID | GO:0001659 | UniProtAcc | A0A024RBN1 |
Top |
Malignant transformation analysis |
| Identification of the aberrant gene expression in precancerous and cancerous lesions by comparing the gene expression of stem-like cells in diseased tissues with normal stem cells |
| Entrez ID | Symbol | Replicates | Species | Organ | Tissue | Adj P-value | Log2FC | Malignancy |
| 5564 | PRKAB1 | LZE4T | Human | Esophagus | ESCC | 6.23e-03 | 1.38e-01 | 0.0811 |
| 5564 | PRKAB1 | LZE7T | Human | Esophagus | ESCC | 2.72e-05 | 2.36e-01 | 0.0667 |
| 5564 | PRKAB1 | LZE22T | Human | Esophagus | ESCC | 1.24e-03 | 3.24e-01 | 0.068 |
| 5564 | PRKAB1 | LZE24T | Human | Esophagus | ESCC | 2.59e-19 | 5.23e-01 | 0.0596 |
| 5564 | PRKAB1 | P1T-E | Human | Esophagus | ESCC | 4.77e-06 | 5.05e-01 | 0.0875 |
| 5564 | PRKAB1 | P2T-E | Human | Esophagus | ESCC | 5.39e-23 | 4.17e-01 | 0.1177 |
| 5564 | PRKAB1 | P4T-E | Human | Esophagus | ESCC | 1.89e-10 | 3.33e-01 | 0.1323 |
| 5564 | PRKAB1 | P5T-E | Human | Esophagus | ESCC | 4.01e-13 | 6.84e-02 | 0.1327 |
| 5564 | PRKAB1 | P8T-E | Human | Esophagus | ESCC | 8.85e-33 | 4.97e-01 | 0.0889 |
| 5564 | PRKAB1 | P10T-E | Human | Esophagus | ESCC | 4.07e-21 | 3.75e-01 | 0.116 |
| 5564 | PRKAB1 | P11T-E | Human | Esophagus | ESCC | 4.23e-05 | 3.76e-01 | 0.1426 |
| 5564 | PRKAB1 | P12T-E | Human | Esophagus | ESCC | 3.65e-20 | 3.17e-01 | 0.1122 |
| 5564 | PRKAB1 | P15T-E | Human | Esophagus | ESCC | 4.72e-14 | 3.21e-01 | 0.1149 |
| 5564 | PRKAB1 | P16T-E | Human | Esophagus | ESCC | 2.84e-14 | 2.04e-01 | 0.1153 |
| 5564 | PRKAB1 | P20T-E | Human | Esophagus | ESCC | 5.53e-14 | 4.43e-01 | 0.1124 |
| 5564 | PRKAB1 | P21T-E | Human | Esophagus | ESCC | 6.23e-17 | 2.34e-01 | 0.1617 |
| 5564 | PRKAB1 | P22T-E | Human | Esophagus | ESCC | 7.32e-08 | 1.09e-01 | 0.1236 |
| 5564 | PRKAB1 | P23T-E | Human | Esophagus | ESCC | 1.01e-23 | 7.27e-01 | 0.108 |
| 5564 | PRKAB1 | P24T-E | Human | Esophagus | ESCC | 1.02e-10 | 1.24e-01 | 0.1287 |
| 5564 | PRKAB1 | P26T-E | Human | Esophagus | ESCC | 8.87e-24 | 3.57e-01 | 0.1276 |
| Page: 1 2 3 4 5 |
| Tissue | Expression Dynamics | Abbreviation |
| Esophagus |  | ESCC: Esophageal squamous cell carcinoma |
| HGIN: High-grade intraepithelial neoplasias | ||
| LGIN: Low-grade intraepithelial neoplasias | ||
| Liver | 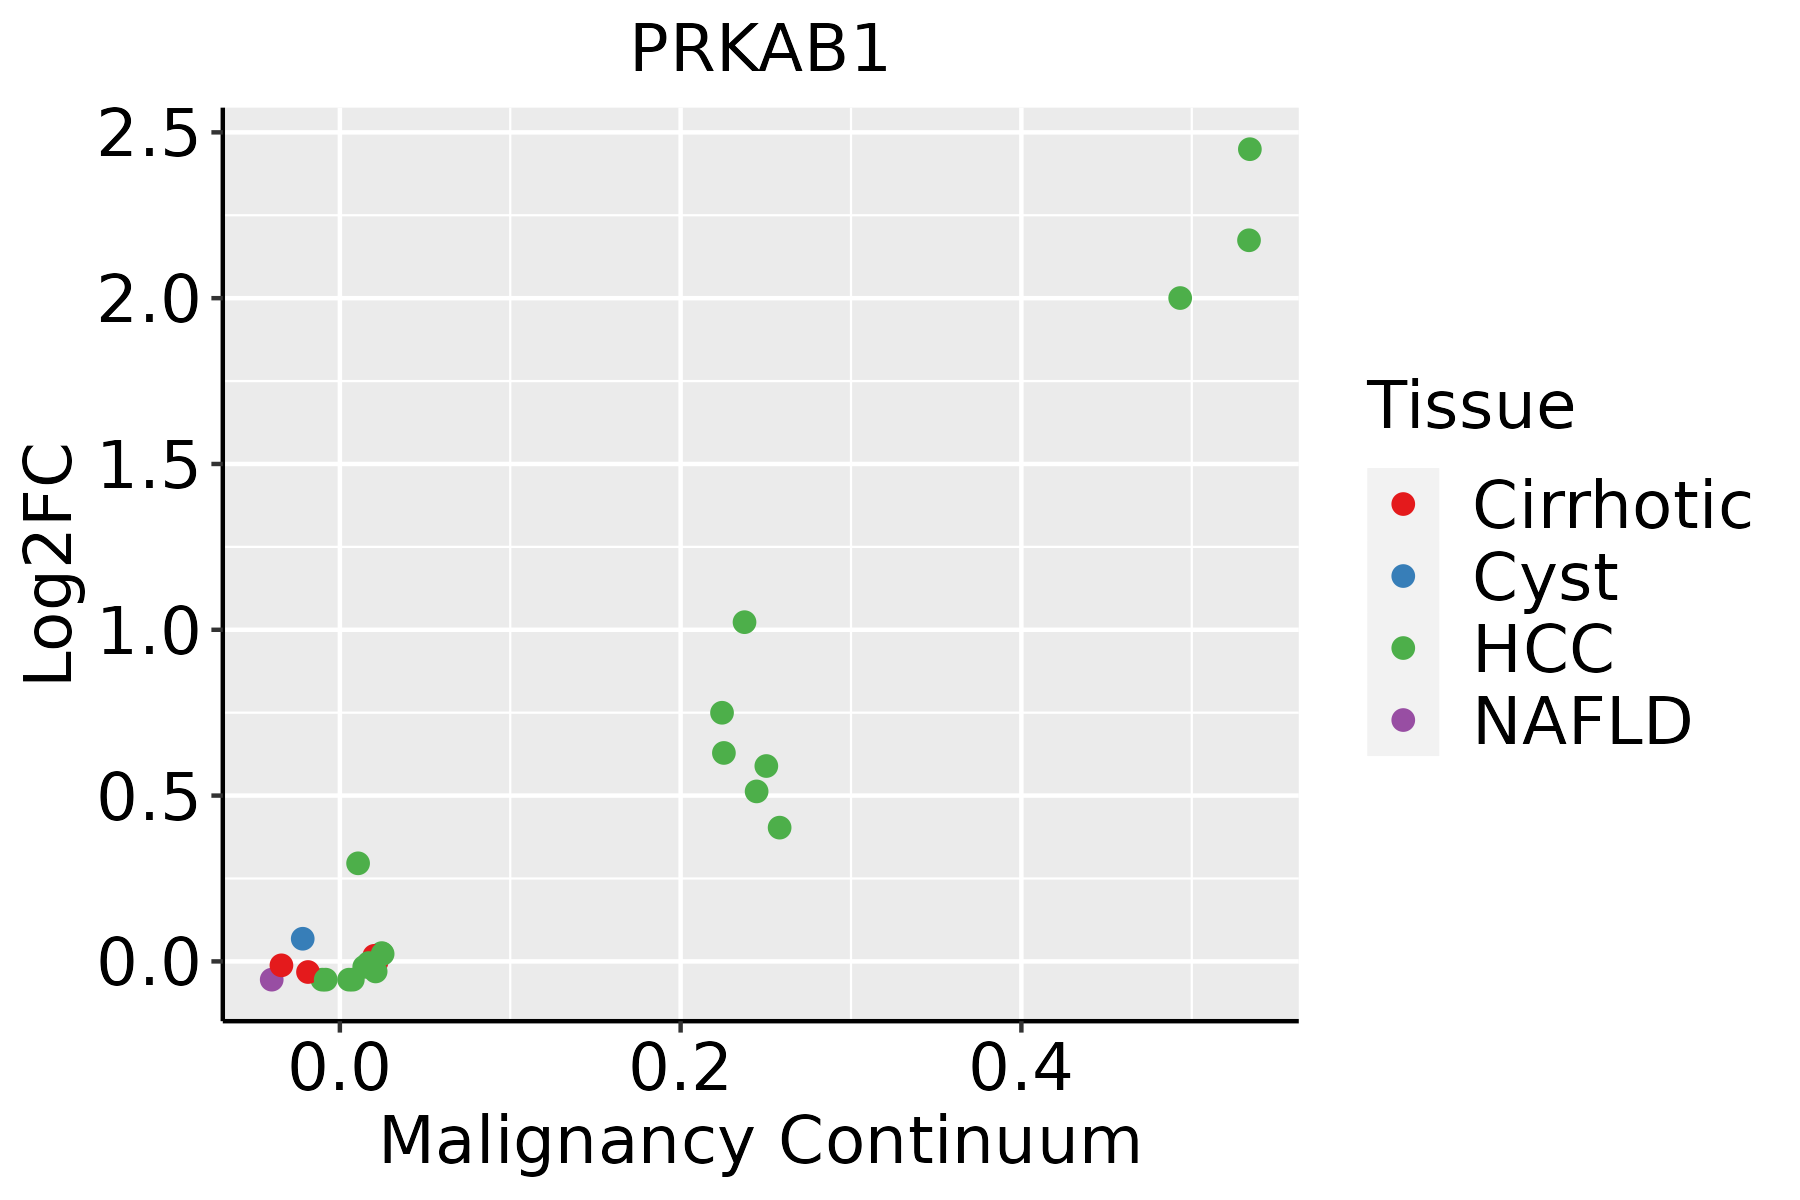 | HCC: Hepatocellular carcinoma |
| NAFLD: Non-alcoholic fatty liver disease | ||
| Oral Cavity | 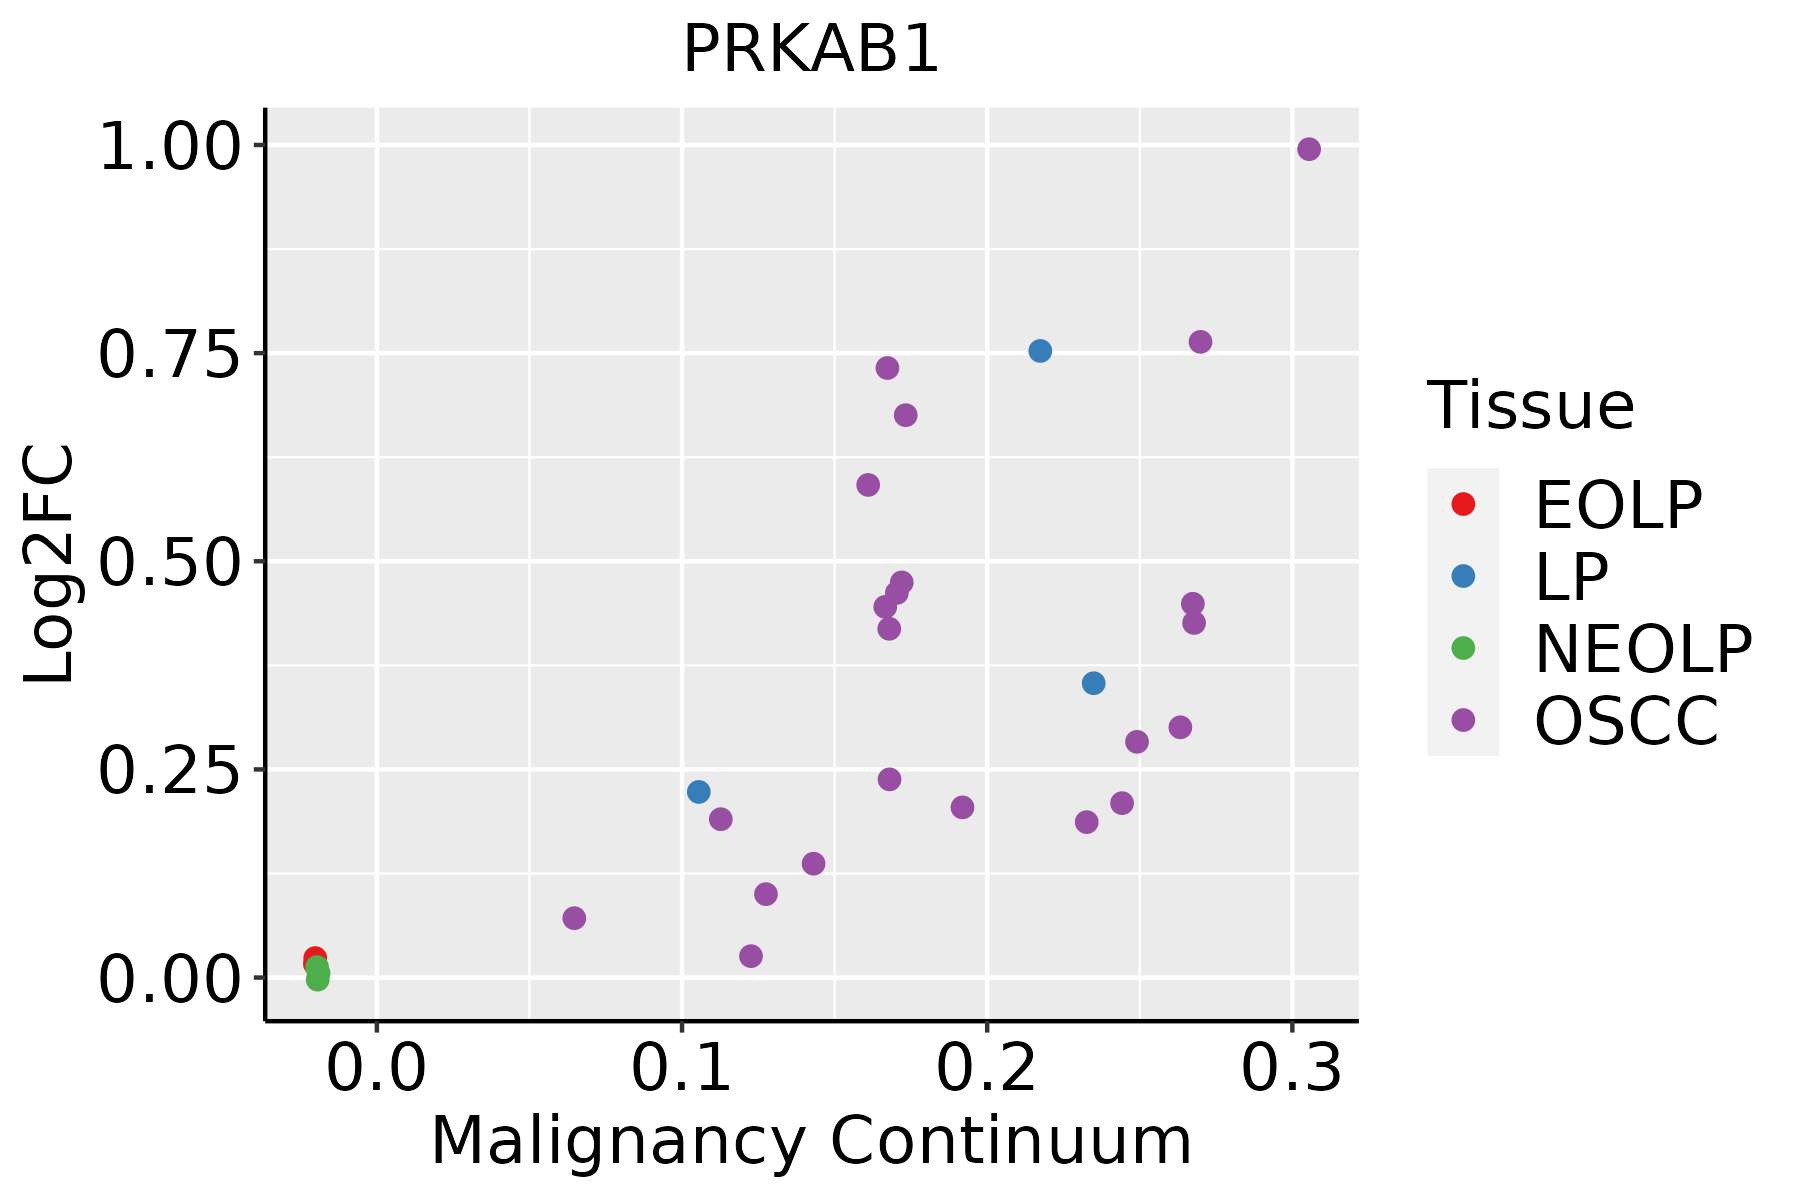 | EOLP: Erosive Oral lichen planus |
| LP: leukoplakia | ||
| NEOLP: Non-erosive oral lichen planus | ||
| OSCC: Oral squamous cell carcinoma |
| ∗log2FC in expression of this searched gene in stem-like cells from each diseased tissue sample relative to stem-like cells in normal samples in each tissue plotted against the malignancy continuum. Samples are colored based on if they are from different disease stage. |
Top |
Malignant transformation related pathway analysis |
| Find out the enriched GO biological processes and KEGG pathways involved in transition from healthy to precancer to cancer |
| Tissue | Disease Stage | Enriched GO biological Processes |
| Colorectum | AD |  |
| Colorectum | SER |  |
| Colorectum | MSS |  |
| Colorectum | MSI-H |  |
| Colorectum | FAP |  |
| ∗Top 15 enriched GO BP terms are showed in the bar plot of each disease state in each tissue. Each row represents a significant GO biological process which is colored according to the -log10(p.adjust). |
| Page: 1 2 3 4 5 6 7 8 9 |
| GO ID | Tissue | Disease Stage | Description | Gene Ratio | Bg Ratio | pvalue | p.adjust | Count |
| GO:00066318 | Esophagus | ESCC | fatty acid metabolic process | 217/8552 | 390/18723 | 4.21e-05 | 3.39e-04 | 217 |
| GO:00463948 | Esophagus | ESCC | carboxylic acid biosynthetic process | 175/8552 | 314/18723 | 1.98e-04 | 1.26e-03 | 175 |
| GO:00160538 | Esophagus | ESCC | organic acid biosynthetic process | 175/8552 | 316/18723 | 3.04e-04 | 1.82e-03 | 175 |
| GO:00487367 | Esophagus | ESCC | appendage development | 98/8552 | 172/18723 | 1.83e-03 | 8.37e-03 | 98 |
| GO:00601737 | Esophagus | ESCC | limb development | 98/8552 | 172/18723 | 1.83e-03 | 8.37e-03 | 98 |
| GO:01201624 | Esophagus | ESCC | positive regulation of cold-induced thermogenesis | 57/8552 | 97/18723 | 6.43e-03 | 2.35e-02 | 57 |
| GO:01061066 | Esophagus | ESCC | cold-induced thermogenesis | 80/8552 | 144/18723 | 1.07e-02 | 3.65e-02 | 80 |
| GO:01201616 | Esophagus | ESCC | regulation of cold-induced thermogenesis | 80/8552 | 144/18723 | 1.07e-02 | 3.65e-02 | 80 |
| GO:001605321 | Liver | HCC | organic acid biosynthetic process | 200/7958 | 316/18723 | 5.24e-14 | 3.22e-12 | 200 |
| GO:000663122 | Liver | HCC | fatty acid metabolic process | 238/7958 | 390/18723 | 8.24e-14 | 4.84e-12 | 238 |
| GO:004639421 | Liver | HCC | carboxylic acid biosynthetic process | 198/7958 | 314/18723 | 1.19e-13 | 6.78e-12 | 198 |
| GO:007233021 | Liver | HCC | monocarboxylic acid biosynthetic process | 129/7958 | 214/18723 | 1.08e-07 | 2.09e-06 | 129 |
| GO:000663321 | Liver | HCC | fatty acid biosynthetic process | 96/7958 | 163/18723 | 1.71e-05 | 1.85e-04 | 96 |
| GO:010610611 | Liver | HCC | cold-induced thermogenesis | 76/7958 | 144/18723 | 8.07e-03 | 3.18e-02 | 76 |
| GO:012016111 | Liver | HCC | regulation of cold-induced thermogenesis | 76/7958 | 144/18723 | 8.07e-03 | 3.18e-02 | 76 |
| GO:199084511 | Liver | HCC | adaptive thermogenesis | 81/7958 | 157/18723 | 1.32e-02 | 4.72e-02 | 81 |
| GO:00160537 | Oral cavity | OSCC | organic acid biosynthetic process | 155/7305 | 316/18723 | 1.64e-04 | 1.13e-03 | 155 |
| GO:00463947 | Oral cavity | OSCC | carboxylic acid biosynthetic process | 154/7305 | 314/18723 | 1.73e-04 | 1.19e-03 | 154 |
| GO:00066317 | Oral cavity | OSCC | fatty acid metabolic process | 186/7305 | 390/18723 | 2.65e-04 | 1.69e-03 | 186 |
| GO:01061065 | Oral cavity | OSCC | cold-induced thermogenesis | 71/7305 | 144/18723 | 7.51e-03 | 2.75e-02 | 71 |
| Page: 1 2 |
| Pathway ID | Tissue | Disease Stage | Description | Gene Ratio | Bg Ratio | pvalue | p.adjust | qvalue | Count |
| hsa04932210 | Esophagus | ESCC | Non-alcoholic fatty liver disease | 122/4205 | 155/8465 | 5.69e-14 | 1.59e-12 | 8.14e-13 | 122 |
| hsa04714211 | Esophagus | ESCC | Thermogenesis | 163/4205 | 232/8465 | 9.22e-11 | 1.14e-09 | 5.86e-10 | 163 |
| hsa040689 | Esophagus | ESCC | FoxO signaling pathway | 89/4205 | 131/8465 | 1.56e-05 | 7.98e-05 | 4.09e-05 | 89 |
| hsa0415210 | Esophagus | ESCC | AMPK signaling pathway | 80/4205 | 121/8465 | 1.73e-04 | 6.67e-04 | 3.42e-04 | 80 |
| hsa049109 | Esophagus | ESCC | Insulin signaling pathway | 89/4205 | 137/8465 | 1.97e-04 | 7.32e-04 | 3.75e-04 | 89 |
| hsa04530211 | Esophagus | ESCC | Tight junction | 105/4205 | 169/8465 | 6.73e-04 | 2.23e-03 | 1.14e-03 | 105 |
| hsa049318 | Esophagus | ESCC | Insulin resistance | 69/4205 | 108/8465 | 1.92e-03 | 5.54e-03 | 2.84e-03 | 69 |
| hsa0421114 | Esophagus | ESCC | Longevity regulating pathway | 58/4205 | 89/8465 | 2.19e-03 | 6.16e-03 | 3.16e-03 | 58 |
| hsa047105 | Esophagus | ESCC | Circadian rhythm | 24/4205 | 34/8465 | 1.09e-02 | 2.51e-02 | 1.29e-02 | 24 |
| hsa0492214 | Esophagus | ESCC | Glucagon signaling pathway | 64/4205 | 107/8465 | 2.18e-02 | 4.80e-02 | 2.46e-02 | 64 |
| hsa0493238 | Esophagus | ESCC | Non-alcoholic fatty liver disease | 122/4205 | 155/8465 | 5.69e-14 | 1.59e-12 | 8.14e-13 | 122 |
| hsa04714310 | Esophagus | ESCC | Thermogenesis | 163/4205 | 232/8465 | 9.22e-11 | 1.14e-09 | 5.86e-10 | 163 |
| hsa0406814 | Esophagus | ESCC | FoxO signaling pathway | 89/4205 | 131/8465 | 1.56e-05 | 7.98e-05 | 4.09e-05 | 89 |
| hsa0415213 | Esophagus | ESCC | AMPK signaling pathway | 80/4205 | 121/8465 | 1.73e-04 | 6.67e-04 | 3.42e-04 | 80 |
| hsa0491014 | Esophagus | ESCC | Insulin signaling pathway | 89/4205 | 137/8465 | 1.97e-04 | 7.32e-04 | 3.75e-04 | 89 |
| hsa04530310 | Esophagus | ESCC | Tight junction | 105/4205 | 169/8465 | 6.73e-04 | 2.23e-03 | 1.14e-03 | 105 |
| hsa0493113 | Esophagus | ESCC | Insulin resistance | 69/4205 | 108/8465 | 1.92e-03 | 5.54e-03 | 2.84e-03 | 69 |
| hsa0421115 | Esophagus | ESCC | Longevity regulating pathway | 58/4205 | 89/8465 | 2.19e-03 | 6.16e-03 | 3.16e-03 | 58 |
| hsa0471012 | Esophagus | ESCC | Circadian rhythm | 24/4205 | 34/8465 | 1.09e-02 | 2.51e-02 | 1.29e-02 | 24 |
| hsa0492215 | Esophagus | ESCC | Glucagon signaling pathway | 64/4205 | 107/8465 | 2.18e-02 | 4.80e-02 | 2.46e-02 | 64 |
| Page: 1 2 3 4 |
Top |
Cell-cell communication analysis |
| Identification of potential cell-cell interactions between two cell types and their ligand-receptor pairs for different disease states |
| Ligand | Receptor | LRpair | Pathway | Tissue | Disease Stage |
| Page: 1 |
Top |
Single-cell gene regulatory network inference analysis |
| Find out the significant the regulons (TFs) and the target genes of each regulon across cell types for different disease states |
| TF | Cell Type | Tissue | Disease Stage | Target Gene | RSS | Regulon Activity |
| ∗The dot plots of a searched regulon are shown for all cell subpopulations in each disease state of each tissue based on the regulon specific score inferred using pySCENIC and by calculating the average expression. |
| Page: 1 |
Top |
Somatic mutation of malignant transformation related genes |
| Annotation of somatic variants for genes involved in malignant transformation |
| Hugo Symbol | Variant Class | Variant Classification | dbSNP RS | HGVSc | HGVSp | HGVSp Short | SWISSPROT | BIOTYPE | SIFT | PolyPhen | Tumor Sample Barcode | Tissue | Histology | Sex | Age | Stage | Therapy Types | Drugs | Outcome |
| PRKAB1 | SNV | Missense_Mutation | rs375579154 | c.262N>A | p.Gly88Arg | p.G88R | Q9Y478 | protein_coding | deleterious(0) | probably_damaging(0.915) | TCGA-A7-A0CG-01 | Breast | breast invasive carcinoma | Female | >=65 | I/II | Unknown | Unknown | SD |
| PRKAB1 | SNV | Missense_Mutation | rs756977389 | c.601N>T | p.Arg201Trp | p.R201W | Q9Y478 | protein_coding | deleterious(0) | possibly_damaging(0.67) | TCGA-AN-A046-01 | Breast | breast invasive carcinoma | Female | >=65 | I/II | Unknown | Unknown | SD |
| PRKAB1 | insertion | Frame_Shift_Ins | novel | c.260dupG | p.Gly88ArgfsTer15 | p.G88Rfs*15 | Q9Y478 | protein_coding | TCGA-A7-A6VX-01 | Breast | breast invasive carcinoma | Female | >=65 | I/II | Chemotherapy | docetaxel | CR | ||
| PRKAB1 | insertion | In_Frame_Ins | novel | c.240_241insACCACACTGGAGGTTATCATTTATCCTAATGAGGGTTCA | p.Thr80_Val81insThrThrLeuGluValIleIleTyrProAsnGluGlySer | p.T80_V81insTTLEVIIYPNEGS | Q9Y478 | protein_coding | TCGA-BH-A0AY-01 | Breast | breast invasive carcinoma | Female | <65 | I/II | Chemotherapy | SD | |||
| PRKAB1 | SNV | Missense_Mutation | rs745730456 | c.259G>T | p.Gly87Cys | p.G87C | Q9Y478 | protein_coding | deleterious(0) | possibly_damaging(0.853) | TCGA-VS-A9UP-01 | Cervix | cervical & endocervical cancer | Female | <65 | I/II | Chemotherapy | cisplatin | PD |
| PRKAB1 | SNV | Missense_Mutation | novel | c.214N>G | p.Lys72Glu | p.K72E | Q9Y478 | protein_coding | tolerated(0.18) | benign(0.086) | TCGA-5M-AAT6-01 | Colorectum | colon adenocarcinoma | Female | <65 | III/IV | Unknown | Unknown | PD |
| PRKAB1 | SNV | Missense_Mutation | rs568377821 | c.722N>T | p.Ala241Val | p.A241V | Q9Y478 | protein_coding | deleterious(0) | probably_damaging(0.999) | TCGA-AY-6197-01 | Colorectum | colon adenocarcinoma | Male | <65 | I/II | Unknown | Unknown | SD |
| PRKAB1 | SNV | Missense_Mutation | c.260N>A | p.Gly87Asp | p.G87D | Q9Y478 | protein_coding | deleterious(0.05) | benign(0.053) | TCGA-DM-A1HA-01 | Colorectum | colon adenocarcinoma | Male | >=65 | III/IV | Unknown | Unknown | SD | |
| PRKAB1 | SNV | Missense_Mutation | rs772422545 | c.121N>T | p.Pro41Ser | p.P41S | Q9Y478 | protein_coding | tolerated(0.81) | benign(0.001) | TCGA-DM-A28M-01 | Colorectum | colon adenocarcinoma | Male | <65 | I/II | Unknown | Unknown | SD |
| PRKAB1 | SNV | Missense_Mutation | c.677N>A | p.Ala226Asp | p.A226D | Q9Y478 | protein_coding | deleterious(0.03) | possibly_damaging(0.67) | TCGA-WS-AB45-01 | Colorectum | colon adenocarcinoma | Female | <65 | I/II | Unknown | Unknown | SD |
| Page: 1 2 3 4 |
Top |
Related drugs of malignant transformation related genes |
| Identification of chemicals and drugs interact with genes involved in malignant transfromation |
| (DGIdb 4.0) |
| Entrez ID | Symbol | Category | Interaction Types | Drug Claim Name | Drug Name | PMIDs |
| 5564 | PRKAB1 | ENZYME, KINASE, DRUGGABLE GENOME | ANTIOXIDANT | 14502105 | ||
| 5564 | PRKAB1 | ENZYME, KINASE, DRUGGABLE GENOME | METFORMIN | METFORMIN | 26471090 | |
| 5564 | PRKAB1 | ENZYME, KINASE, DRUGGABLE GENOME | activator | 252827478 | ||
| 5564 | PRKAB1 | ENZYME, KINASE, DRUGGABLE GENOME | PROGESTERONE | PROGESTERONE | 16020477 | |
| 5564 | PRKAB1 | ENZYME, KINASE, DRUGGABLE GENOME | METFORMIN | METFORMIN | ||
| 5564 | PRKAB1 | ENZYME, KINASE, DRUGGABLE GENOME | PROPYLTHIOURACIL | PROPYLTHIOURACIL | 12433937 | |
| 5564 | PRKAB1 | ENZYME, KINASE, DRUGGABLE GENOME | SAPONARIN | SAPONARIN | 26471090 | |
| 5564 | PRKAB1 | ENZYME, KINASE, DRUGGABLE GENOME | metformin | METFORMIN | 22722338 | |
| 5564 | PRKAB1 | ENZYME, KINASE, DRUGGABLE GENOME | METFORMIN HYDROCHLORIDE | |||
| 5564 | PRKAB1 | ENZYME, KINASE, DRUGGABLE GENOME | WORTMANNIN | WORTMANNIN | 15928020 |
| Page: 1 2 |

Copyright 2023-Present -The University of Texas Health Science Center at Houston |