
|
|||||
|
 | |
| |
| |
| |
| |
| |
|
Gene: PRKAA2 |
Gene summary for PRKAA2 |
| Gene information | Species | Human | Gene symbol | PRKAA2 | Gene ID | 5563 |
| Gene name | protein kinase AMP-activated catalytic subunit alpha 2 | |
| Gene Alias | AMPK | |
| Cytomap | 1p32.2 | |
| Gene Type | protein-coding | GO ID | GO:0000226 | UniProtAcc | P54646 |
Top |
Malignant transformation analysis |
| Identification of the aberrant gene expression in precancerous and cancerous lesions by comparing the gene expression of stem-like cells in diseased tissues with normal stem cells |
| Entrez ID | Symbol | Replicates | Species | Organ | Tissue | Adj P-value | Log2FC | Malignancy |
| 5563 | PRKAA2 | HCC1_Meng | Human | Liver | HCC | 7.48e-49 | 2.98e-02 | 0.0246 |
| 5563 | PRKAA2 | HCC2_Meng | Human | Liver | HCC | 1.83e-05 | -1.02e-02 | 0.0107 |
| 5563 | PRKAA2 | cirrhotic2 | Human | Liver | Cirrhotic | 3.60e-03 | 2.33e-02 | 0.0201 |
| 5563 | PRKAA2 | HCC1 | Human | Liver | HCC | 7.53e-11 | 5.06e+00 | 0.5336 |
| 5563 | PRKAA2 | HCC2 | Human | Liver | HCC | 1.25e-22 | 4.10e+00 | 0.5341 |
| 5563 | PRKAA2 | S014 | Human | Liver | HCC | 1.96e-16 | 8.25e-01 | 0.2254 |
| 5563 | PRKAA2 | S015 | Human | Liver | HCC | 6.52e-18 | 1.28e+00 | 0.2375 |
| 5563 | PRKAA2 | S016 | Human | Liver | HCC | 1.07e-25 | 1.12e+00 | 0.2243 |
| 5563 | PRKAA2 | S027 | Human | Liver | HCC | 1.42e-07 | 8.30e-01 | 0.2446 |
| 5563 | PRKAA2 | S028 | Human | Liver | HCC | 7.73e-09 | 6.61e-01 | 0.2503 |
| 5563 | PRKAA2 | S029 | Human | Liver | HCC | 4.36e-13 | 8.60e-01 | 0.2581 |
| Page: 1 |
| Tissue | Expression Dynamics | Abbreviation |
| Liver | 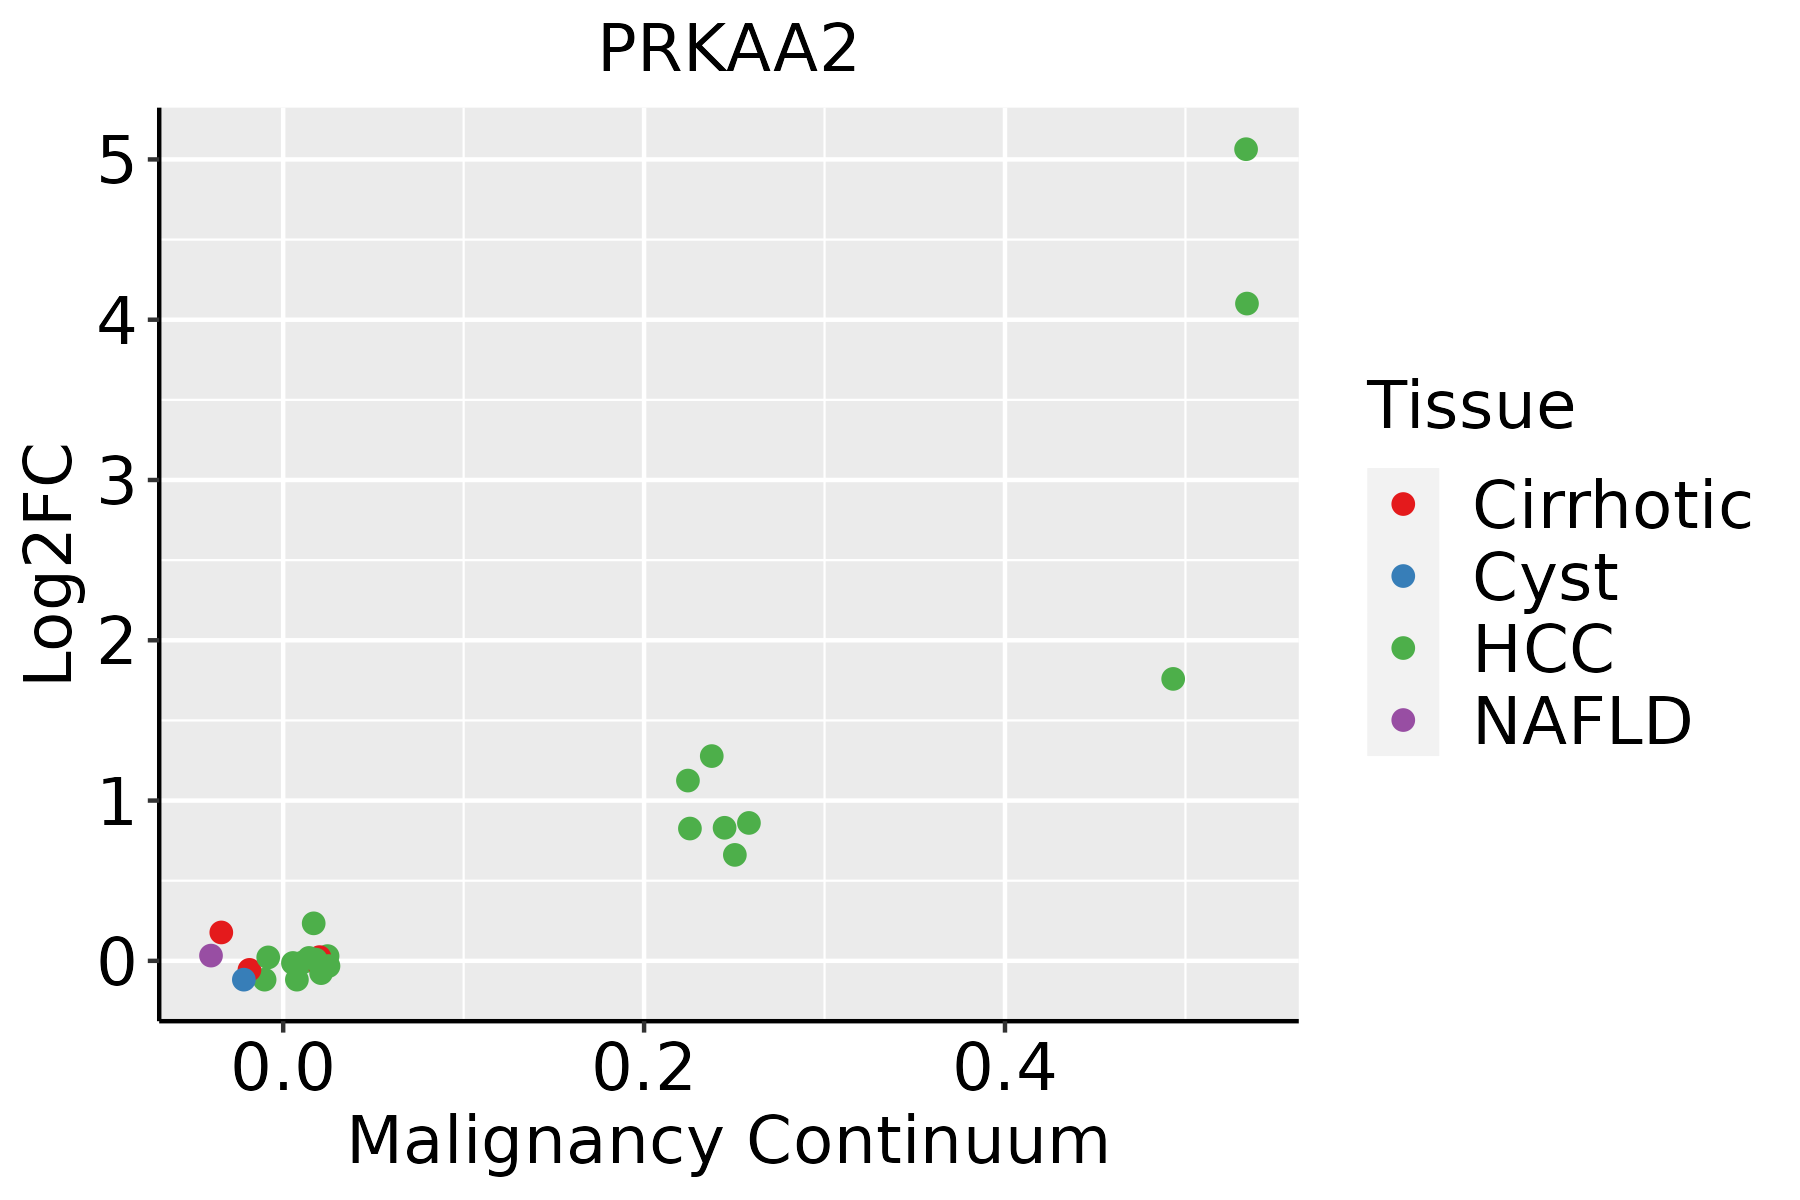 | HCC: Hepatocellular carcinoma |
| NAFLD: Non-alcoholic fatty liver disease | ||
| Prostate |  | BPH: Benign Prostatic Hyperplasia |
| ∗log2FC in expression of this searched gene in stem-like cells from each diseased tissue sample relative to stem-like cells in normal samples in each tissue plotted against the malignancy continuum. Samples are colored based on if they are from different disease stage. |
Top |
Malignant transformation related pathway analysis |
| Find out the enriched GO biological processes and KEGG pathways involved in transition from healthy to precancer to cancer |
| Tissue | Disease Stage | Enriched GO biological Processes |
| Colorectum | AD |  |
| Colorectum | SER |  |
| Colorectum | MSS |  |
| Colorectum | MSI-H |  |
| Colorectum | FAP |  |
| ∗Top 15 enriched GO BP terms are showed in the bar plot of each disease state in each tissue. Each row represents a significant GO biological process which is colored according to the -log10(p.adjust). |
| Page: 1 2 3 4 5 6 7 8 9 |
| GO ID | Tissue | Disease Stage | Description | Gene Ratio | Bg Ratio | pvalue | p.adjust | Count |
| GO:000609112 | Liver | Cirrhotic | generation of precursor metabolites and energy | 238/4634 | 490/18723 | 6.85e-31 | 1.07e-27 | 238 |
| GO:004603412 | Liver | Cirrhotic | ATP metabolic process | 144/4634 | 277/18723 | 1.04e-22 | 5.02e-20 | 144 |
| GO:000989612 | Liver | Cirrhotic | positive regulation of catabolic process | 215/4634 | 492/18723 | 1.13e-20 | 3.56e-18 | 215 |
| GO:003133112 | Liver | Cirrhotic | positive regulation of cellular catabolic process | 190/4634 | 427/18723 | 1.94e-19 | 4.18e-17 | 190 |
| GO:000697912 | Liver | Cirrhotic | response to oxidative stress | 196/4634 | 446/18723 | 2.80e-19 | 5.86e-17 | 196 |
| GO:000820211 | Liver | Cirrhotic | steroid metabolic process | 143/4634 | 319/18723 | 2.79e-15 | 3.18e-13 | 143 |
| GO:000663112 | Liver | Cirrhotic | fatty acid metabolic process | 165/4634 | 390/18723 | 1.29e-14 | 1.26e-12 | 165 |
| GO:006219712 | Liver | Cirrhotic | cellular response to chemical stress | 147/4634 | 337/18723 | 1.84e-14 | 1.72e-12 | 147 |
| GO:001605312 | Liver | Cirrhotic | organic acid biosynthetic process | 139/4634 | 316/18723 | 4.28e-14 | 3.83e-12 | 139 |
| GO:004639412 | Liver | Cirrhotic | carboxylic acid biosynthetic process | 137/4634 | 314/18723 | 1.40e-13 | 1.14e-11 | 137 |
| GO:001623611 | Liver | Cirrhotic | macroautophagy | 129/4634 | 291/18723 | 1.75e-13 | 1.41e-11 | 129 |
| GO:190382912 | Liver | Cirrhotic | positive regulation of cellular protein localization | 123/4634 | 276/18723 | 4.06e-13 | 3.22e-11 | 123 |
| GO:003459912 | Liver | Cirrhotic | cellular response to oxidative stress | 127/4634 | 288/18723 | 4.29e-13 | 3.32e-11 | 127 |
| GO:19026521 | Liver | Cirrhotic | secondary alcohol metabolic process | 75/4634 | 147/18723 | 5.62e-12 | 3.91e-10 | 75 |
| GO:000675312 | Liver | Cirrhotic | nucleoside phosphate metabolic process | 190/4634 | 497/18723 | 1.10e-11 | 6.96e-10 | 190 |
| GO:000911712 | Liver | Cirrhotic | nucleotide metabolic process | 187/4634 | 489/18723 | 1.55e-11 | 9.63e-10 | 187 |
| GO:001050611 | Liver | Cirrhotic | regulation of autophagy | 132/4634 | 317/18723 | 2.17e-11 | 1.33e-09 | 132 |
| GO:001003812 | Liver | Cirrhotic | response to metal ion | 150/4634 | 373/18723 | 2.27e-11 | 1.37e-09 | 150 |
| GO:00082031 | Liver | Cirrhotic | cholesterol metabolic process | 70/4634 | 137/18723 | 2.59e-11 | 1.55e-09 | 70 |
| GO:00161251 | Liver | Cirrhotic | sterol metabolic process | 75/4634 | 152/18723 | 4.54e-11 | 2.61e-09 | 75 |
| Page: 1 2 3 4 5 6 7 8 9 10 11 12 13 14 15 16 17 18 19 20 |
| Pathway ID | Tissue | Disease Stage | Description | Gene Ratio | Bg Ratio | pvalue | p.adjust | qvalue | Count |
| hsa0493222 | Liver | Cirrhotic | Non-alcoholic fatty liver disease | 106/2530 | 155/8465 | 2.16e-23 | 2.40e-21 | 1.48e-21 | 106 |
| hsa0471414 | Liver | Cirrhotic | Thermogenesis | 121/2530 | 232/8465 | 5.70e-13 | 1.36e-11 | 8.36e-12 | 121 |
| hsa0453022 | Liver | Cirrhotic | Tight junction | 82/2530 | 169/8465 | 2.14e-07 | 2.85e-06 | 1.76e-06 | 82 |
| hsa041406 | Liver | Cirrhotic | Autophagy - animal | 65/2530 | 141/8465 | 3.10e-05 | 2.47e-04 | 1.52e-04 | 65 |
| hsa0541822 | Liver | Cirrhotic | Fluid shear stress and atherosclerosis | 62/2530 | 139/8465 | 1.53e-04 | 1.06e-03 | 6.54e-04 | 62 |
| hsa04936 | Liver | Cirrhotic | Alcoholic liver disease | 60/2530 | 142/8465 | 1.07e-03 | 5.85e-03 | 3.61e-03 | 60 |
| hsa0491021 | Liver | Cirrhotic | Insulin signaling pathway | 56/2530 | 137/8465 | 3.74e-03 | 1.50e-02 | 9.26e-03 | 56 |
| hsa0415221 | Liver | Cirrhotic | AMPK signaling pathway | 49/2530 | 121/8465 | 7.90e-03 | 2.74e-02 | 1.69e-02 | 49 |
| hsa040682 | Liver | Cirrhotic | FoxO signaling pathway | 52/2530 | 131/8465 | 9.98e-03 | 3.32e-02 | 2.05e-02 | 52 |
| hsa042118 | Liver | Cirrhotic | Longevity regulating pathway | 37/2530 | 89/8465 | 1.22e-02 | 3.89e-02 | 2.40e-02 | 37 |
| hsa0492221 | Liver | Cirrhotic | Glucagon signaling pathway | 43/2530 | 107/8465 | 1.42e-02 | 4.35e-02 | 2.68e-02 | 43 |
| hsa0493232 | Liver | Cirrhotic | Non-alcoholic fatty liver disease | 106/2530 | 155/8465 | 2.16e-23 | 2.40e-21 | 1.48e-21 | 106 |
| hsa0471415 | Liver | Cirrhotic | Thermogenesis | 121/2530 | 232/8465 | 5.70e-13 | 1.36e-11 | 8.36e-12 | 121 |
| hsa0453032 | Liver | Cirrhotic | Tight junction | 82/2530 | 169/8465 | 2.14e-07 | 2.85e-06 | 1.76e-06 | 82 |
| hsa0414011 | Liver | Cirrhotic | Autophagy - animal | 65/2530 | 141/8465 | 3.10e-05 | 2.47e-04 | 1.52e-04 | 65 |
| hsa0541832 | Liver | Cirrhotic | Fluid shear stress and atherosclerosis | 62/2530 | 139/8465 | 1.53e-04 | 1.06e-03 | 6.54e-04 | 62 |
| hsa049361 | Liver | Cirrhotic | Alcoholic liver disease | 60/2530 | 142/8465 | 1.07e-03 | 5.85e-03 | 3.61e-03 | 60 |
| hsa0491031 | Liver | Cirrhotic | Insulin signaling pathway | 56/2530 | 137/8465 | 3.74e-03 | 1.50e-02 | 9.26e-03 | 56 |
| hsa0415231 | Liver | Cirrhotic | AMPK signaling pathway | 49/2530 | 121/8465 | 7.90e-03 | 2.74e-02 | 1.69e-02 | 49 |
| hsa040683 | Liver | Cirrhotic | FoxO signaling pathway | 52/2530 | 131/8465 | 9.98e-03 | 3.32e-02 | 2.05e-02 | 52 |
| Page: 1 2 3 4 5 |
Top |
Cell-cell communication analysis |
| Identification of potential cell-cell interactions between two cell types and their ligand-receptor pairs for different disease states |
| Ligand | Receptor | LRpair | Pathway | Tissue | Disease Stage |
| Page: 1 |
Top |
Single-cell gene regulatory network inference analysis |
| Find out the significant the regulons (TFs) and the target genes of each regulon across cell types for different disease states |
| TF | Cell Type | Tissue | Disease Stage | Target Gene | RSS | Regulon Activity |
| PRKAA2 | PERI | Breast | Healthy | IRS1,BCL2,SMIM14, etc. | 1.56e-01 |  |
| PRKAA2 | CHO | Liver | Healthy | TMC5,DEPDC1B,MAMLD1, etc. | 2.61e-01 |  |
| ∗The dot plots of a searched regulon are shown for all cell subpopulations in each disease state of each tissue based on the regulon specific score inferred using pySCENIC and by calculating the average expression. |
| Page: 1 |
Top |
Somatic mutation of malignant transformation related genes |
| Annotation of somatic variants for genes involved in malignant transformation |
| Hugo Symbol | Variant Class | Variant Classification | dbSNP RS | HGVSc | HGVSp | HGVSp Short | SWISSPROT | BIOTYPE | SIFT | PolyPhen | Tumor Sample Barcode | Tissue | Histology | Sex | Age | Stage | Therapy Types | Drugs | Outcome |
| PRKAA2 | SNV | Missense_Mutation | c.859G>A | p.Val287Ile | p.V287I | P54646 | protein_coding | tolerated(0.74) | benign(0.021) | TCGA-AN-A0FT-01 | Breast | breast invasive carcinoma | Female | <65 | I/II | Unknown | Unknown | SD | |
| PRKAA2 | SNV | Missense_Mutation | novel | c.651G>T | p.Glu217Asp | p.E217D | P54646 | protein_coding | tolerated(0.17) | benign(0.046) | TCGA-AR-A24W-01 | Breast | breast invasive carcinoma | Female | <65 | I/II | Hormone Therapy | letrozole | SD |
| PRKAA2 | SNV | Missense_Mutation | c.476N>T | p.Gly159Val | p.G159V | P54646 | protein_coding | deleterious(0) | probably_damaging(0.999) | TCGA-B6-A0IJ-01 | Breast | breast invasive carcinoma | Female | <65 | I/II | Unknown | Unknown | SD | |
| PRKAA2 | SNV | Missense_Mutation | c.629G>A | p.Gly210Asp | p.G210D | P54646 | protein_coding | deleterious(0) | probably_damaging(1) | TCGA-BH-A18G-01 | Breast | breast invasive carcinoma | Female | >=65 | I/II | Unknown | Unknown | SD | |
| PRKAA2 | SNV | Missense_Mutation | c.192N>C | p.Glu64Asp | p.E64D | P54646 | protein_coding | deleterious(0) | probably_damaging(1) | TCGA-D8-A142-01 | Breast | breast invasive carcinoma | Female | >=65 | I/II | Chemotherapy | cyclophosphamid | SD | |
| PRKAA2 | SNV | Missense_Mutation | rs781506978 | c.328N>T | p.Arg110Trp | p.R110W | P54646 | protein_coding | deleterious(0) | probably_damaging(0.978) | TCGA-D8-A142-01 | Breast | breast invasive carcinoma | Female | >=65 | I/II | Chemotherapy | cyclophosphamid | SD |
| PRKAA2 | SNV | Missense_Mutation | c.1591N>T | p.Arg531Cys | p.R531C | P54646 | protein_coding | deleterious_low_confidence(0.01) | possibly_damaging(0.608) | TCGA-DG-A2KH-01 | Cervix | cervical & endocervical cancer | Female | <65 | I/II | Unknown | Unknown | SD | |
| PRKAA2 | SNV | Missense_Mutation | c.346N>A | p.Ala116Thr | p.A116T | P54646 | protein_coding | deleterious(0) | possibly_damaging(0.902) | TCGA-EK-A2RC-01 | Cervix | cervical & endocervical cancer | Female | <65 | I/II | Unknown | Unknown | SD | |
| PRKAA2 | SNV | Missense_Mutation | c.1002N>A | p.Met334Ile | p.M334I | P54646 | protein_coding | tolerated(0.26) | benign(0.191) | TCGA-HM-A4S6-01 | Cervix | cervical & endocervical cancer | Female | <65 | III/IV | Chemotherapy | cisplatin | CR | |
| PRKAA2 | SNV | Missense_Mutation | c.777N>G | p.Ile259Met | p.I259M | P54646 | protein_coding | tolerated(0.05) | possibly_damaging(0.583) | TCGA-IR-A3LH-01 | Cervix | cervical & endocervical cancer | Female | <65 | I/II | Chemotherapy | cisplatin | CR |
| Page: 1 2 3 4 5 6 7 8 9 |
Top |
Related drugs of malignant transformation related genes |
| Identification of chemicals and drugs interact with genes involved in malignant transfromation |
| (DGIdb 4.0) |
| Entrez ID | Symbol | Category | Interaction Types | Drug Claim Name | Drug Name | PMIDs |
| 5563 | PRKAA2 | SERINE THREONINE KINASE, KINASE, DRUGGABLE GENOME, TRANSPORTER, ENZYME | metformin | METFORMIN | 22722338 | |
| 5563 | PRKAA2 | SERINE THREONINE KINASE, KINASE, DRUGGABLE GENOME, TRANSPORTER, ENZYME | METFORMIN HYDROCHLORIDE | |||
| 5563 | PRKAA2 | SERINE THREONINE KINASE, KINASE, DRUGGABLE GENOME, TRANSPORTER, ENZYME | METFORMIN | METFORMIN | 26471090 | |
| 5563 | PRKAA2 | SERINE THREONINE KINASE, KINASE, DRUGGABLE GENOME, TRANSPORTER, ENZYME | METFORMIN HYDROCHLORIDE | METFORMIN HYDROCHLORIDE | 23490148 | |
| 5563 | PRKAA2 | SERINE THREONINE KINASE, KINASE, DRUGGABLE GENOME, TRANSPORTER, ENZYME | HL010183 | CHEMBL2348411 | 23490148 | |
| 5563 | PRKAA2 | SERINE THREONINE KINASE, KINASE, DRUGGABLE GENOME, TRANSPORTER, ENZYME | inhibitor | HESPERADIN | HESPERADIN | 19035792 |
| 5563 | PRKAA2 | SERINE THREONINE KINASE, KINASE, DRUGGABLE GENOME, TRANSPORTER, ENZYME | SAPONARIN | SAPONARIN | 26471090 |
| Page: 1 |

Copyright 2023-Present -The University of Texas Health Science Center at Houston |