
|
|||||
|
 | |
| |
| |
| |
| |
| |
|
Gene: PRKAA1 |
Gene summary for PRKAA1 |
| Gene information | Species | Human | Gene symbol | PRKAA1 | Gene ID | 5562 |
| Gene name | protein kinase AMP-activated catalytic subunit alpha 1 | |
| Gene Alias | AMPK | |
| Cytomap | 5p13.1 | |
| Gene Type | protein-coding | GO ID | GO:0000226 | UniProtAcc | Q13131 |
Top |
Malignant transformation analysis |
| Identification of the aberrant gene expression in precancerous and cancerous lesions by comparing the gene expression of stem-like cells in diseased tissues with normal stem cells |
| Entrez ID | Symbol | Replicates | Species | Organ | Tissue | Adj P-value | Log2FC | Malignancy |
| 5562 | PRKAA1 | LZE2T | Human | Esophagus | ESCC | 4.24e-02 | 2.82e-01 | 0.082 |
| 5562 | PRKAA1 | LZE4T | Human | Esophagus | ESCC | 1.34e-11 | 2.82e-01 | 0.0811 |
| 5562 | PRKAA1 | LZE5T | Human | Esophagus | ESCC | 3.85e-12 | 7.60e-01 | 0.0514 |
| 5562 | PRKAA1 | LZE7T | Human | Esophagus | ESCC | 6.40e-08 | 3.73e-01 | 0.0667 |
| 5562 | PRKAA1 | LZE8T | Human | Esophagus | ESCC | 1.74e-12 | 2.63e-01 | 0.067 |
| 5562 | PRKAA1 | LZE20T | Human | Esophagus | ESCC | 1.12e-11 | 5.24e-01 | 0.0662 |
| 5562 | PRKAA1 | LZE24T | Human | Esophagus | ESCC | 1.04e-09 | 1.84e-01 | 0.0596 |
| 5562 | PRKAA1 | LZE6T | Human | Esophagus | ESCC | 2.09e-07 | 2.91e-01 | 0.0845 |
| 5562 | PRKAA1 | P1T-E | Human | Esophagus | ESCC | 3.85e-02 | 1.80e-01 | 0.0875 |
| 5562 | PRKAA1 | P2T-E | Human | Esophagus | ESCC | 5.41e-14 | 1.76e-01 | 0.1177 |
| 5562 | PRKAA1 | P4T-E | Human | Esophagus | ESCC | 7.55e-16 | 2.30e-01 | 0.1323 |
| 5562 | PRKAA1 | P5T-E | Human | Esophagus | ESCC | 8.58e-14 | 1.16e-01 | 0.1327 |
| 5562 | PRKAA1 | P8T-E | Human | Esophagus | ESCC | 2.66e-36 | 7.55e-01 | 0.0889 |
| 5562 | PRKAA1 | P9T-E | Human | Esophagus | ESCC | 2.09e-16 | 2.85e-01 | 0.1131 |
| 5562 | PRKAA1 | P10T-E | Human | Esophagus | ESCC | 1.05e-26 | 3.94e-01 | 0.116 |
| 5562 | PRKAA1 | P11T-E | Human | Esophagus | ESCC | 2.41e-05 | 1.89e-01 | 0.1426 |
| 5562 | PRKAA1 | P12T-E | Human | Esophagus | ESCC | 2.21e-17 | 2.39e-01 | 0.1122 |
| 5562 | PRKAA1 | P15T-E | Human | Esophagus | ESCC | 2.75e-11 | 1.98e-01 | 0.1149 |
| 5562 | PRKAA1 | P16T-E | Human | Esophagus | ESCC | 1.46e-12 | 1.64e-01 | 0.1153 |
| 5562 | PRKAA1 | P17T-E | Human | Esophagus | ESCC | 4.36e-10 | 4.52e-01 | 0.1278 |
| Page: 1 2 3 4 5 6 |
| Tissue | Expression Dynamics | Abbreviation |
| Esophagus | 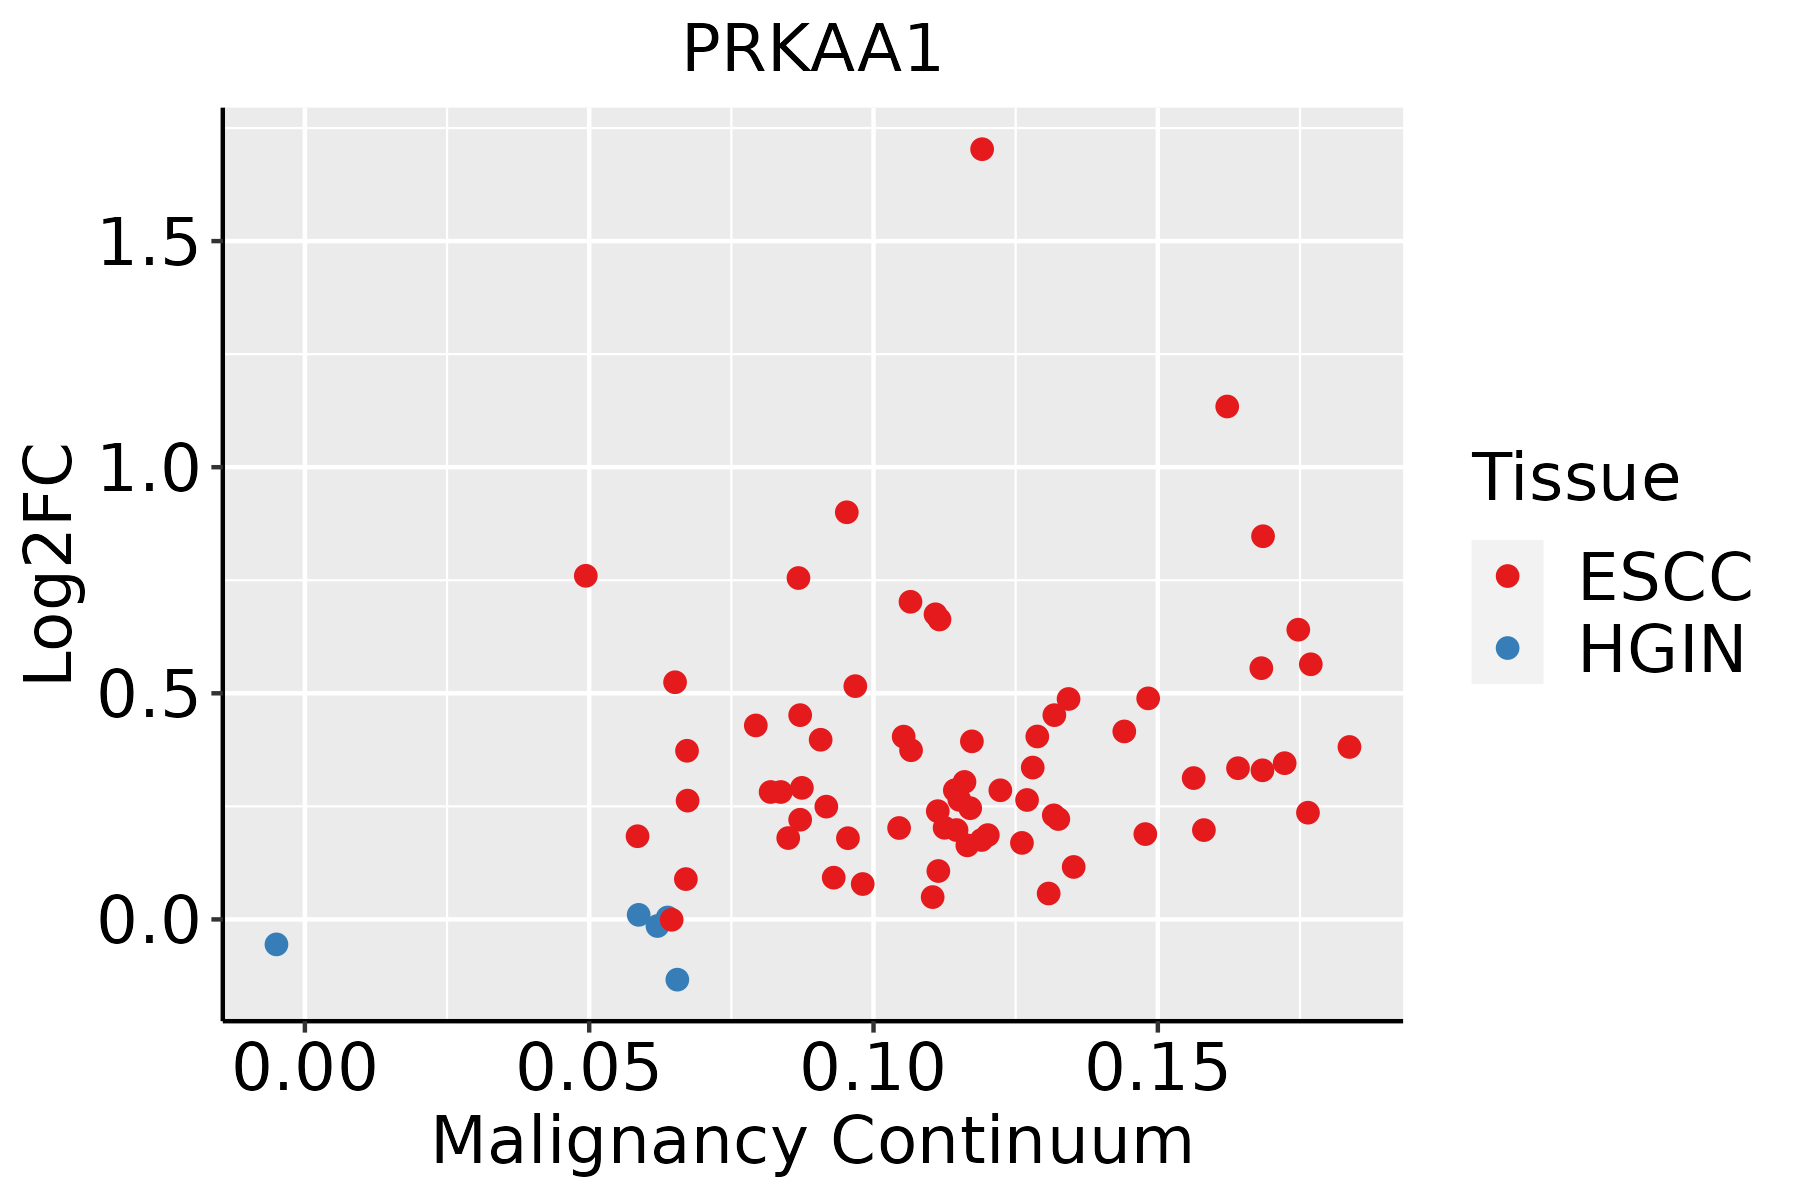 | ESCC: Esophageal squamous cell carcinoma |
| HGIN: High-grade intraepithelial neoplasias | ||
| LGIN: Low-grade intraepithelial neoplasias | ||
| Liver | 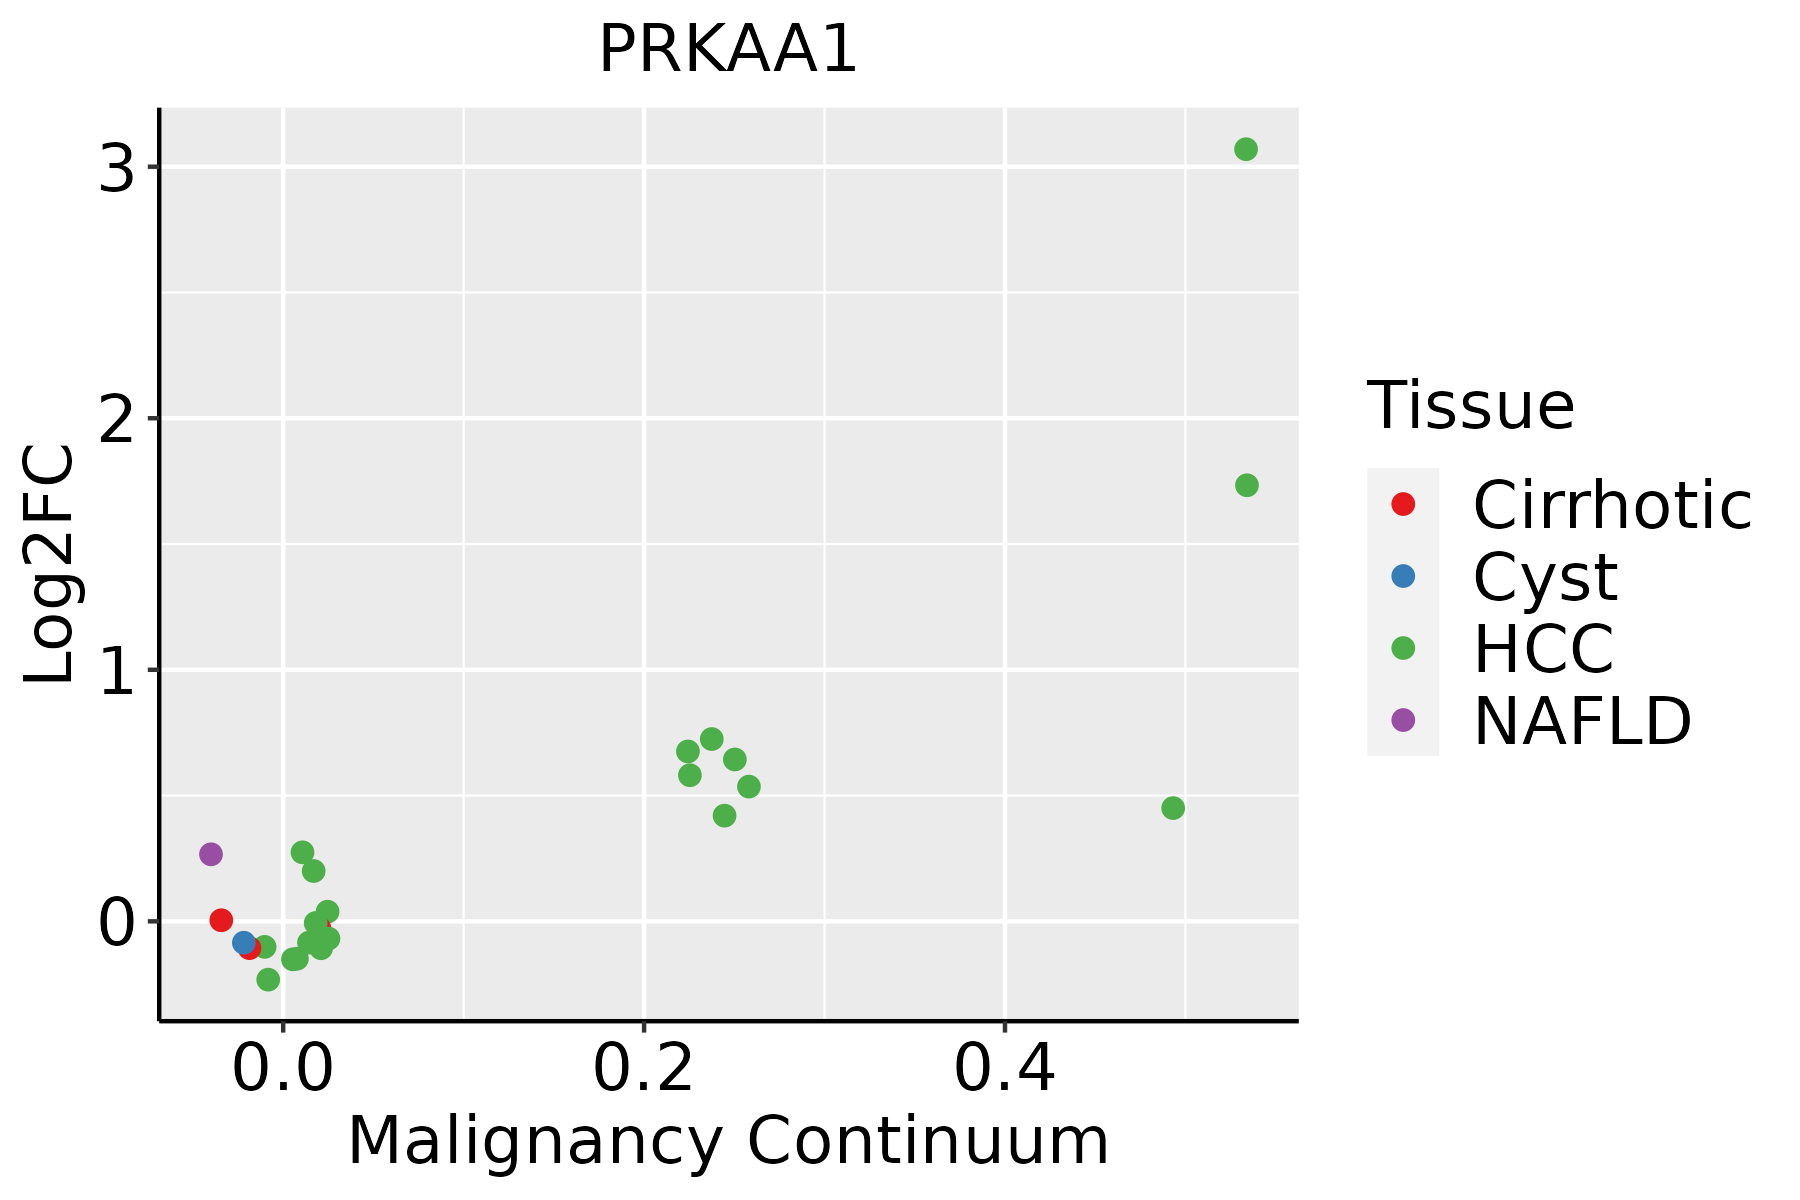 | HCC: Hepatocellular carcinoma |
| NAFLD: Non-alcoholic fatty liver disease | ||
| Oral Cavity | 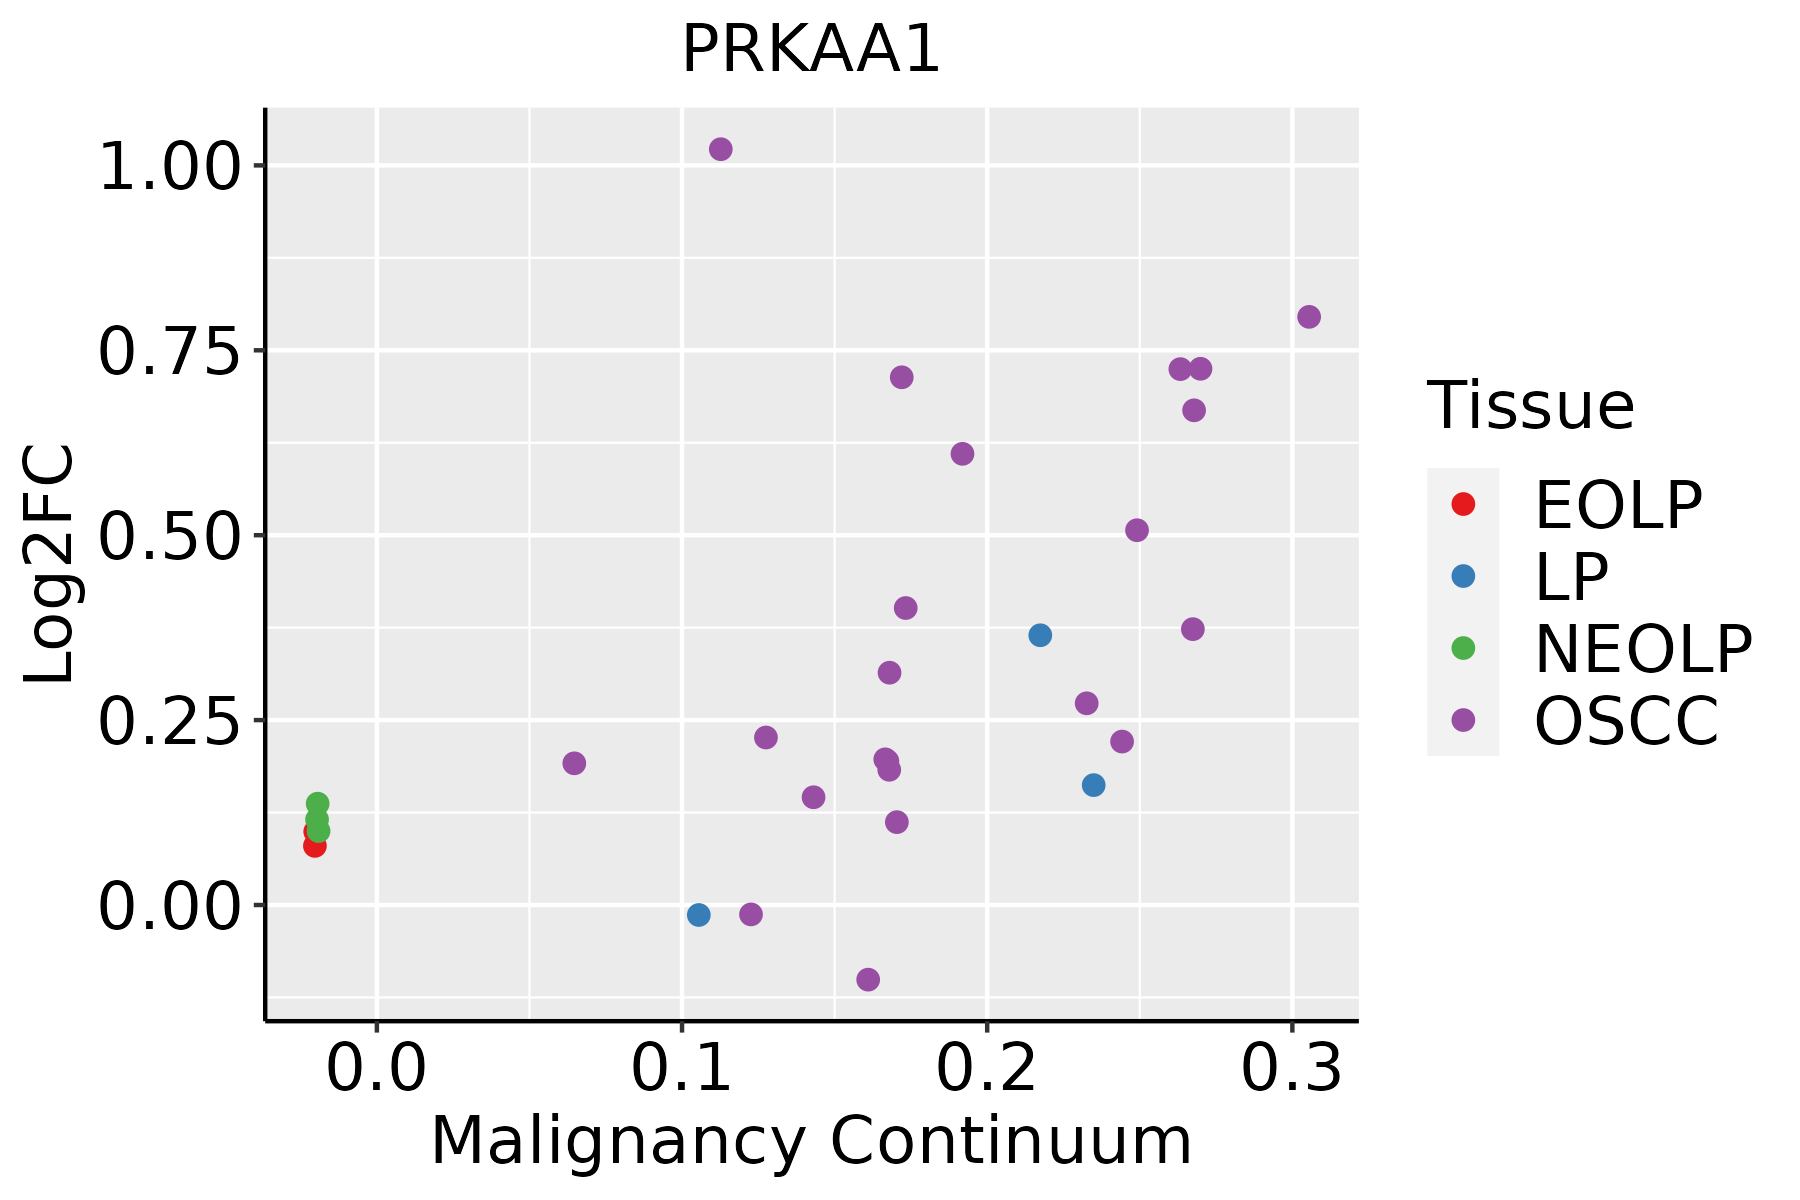 | EOLP: Erosive Oral lichen planus |
| LP: leukoplakia | ||
| NEOLP: Non-erosive oral lichen planus | ||
| OSCC: Oral squamous cell carcinoma | ||
| Thyroid |  | ATC: Anaplastic thyroid cancer |
| HT: Hashimoto's thyroiditis | ||
| PTC: Papillary thyroid cancer |
| ∗log2FC in expression of this searched gene in stem-like cells from each diseased tissue sample relative to stem-like cells in normal samples in each tissue plotted against the malignancy continuum. Samples are colored based on if they are from different disease stage. |
Top |
Malignant transformation related pathway analysis |
| Find out the enriched GO biological processes and KEGG pathways involved in transition from healthy to precancer to cancer |
| Tissue | Disease Stage | Enriched GO biological Processes |
| Colorectum | AD |  |
| Colorectum | SER |  |
| Colorectum | MSS |  |
| Colorectum | MSI-H |  |
| Colorectum | FAP |  |
| ∗Top 15 enriched GO BP terms are showed in the bar plot of each disease state in each tissue. Each row represents a significant GO biological process which is colored according to the -log10(p.adjust). |
| Page: 1 2 3 4 5 6 7 8 9 |
| GO ID | Tissue | Disease Stage | Description | Gene Ratio | Bg Ratio | pvalue | p.adjust | Count |
| GO:0072594110 | Esophagus | ESCC | establishment of protein localization to organelle | 311/8552 | 422/18723 | 3.02e-32 | 2.13e-29 | 311 |
| GO:001657015 | Esophagus | ESCC | histone modification | 323/8552 | 463/18723 | 2.61e-26 | 7.88e-24 | 323 |
| GO:003238618 | Esophagus | ESCC | regulation of intracellular transport | 243/8552 | 337/18723 | 3.20e-23 | 7.25e-21 | 243 |
| GO:0006091110 | Esophagus | ESCC | generation of precursor metabolites and energy | 331/8552 | 490/18723 | 3.86e-23 | 8.45e-21 | 331 |
| GO:0009896111 | Esophagus | ESCC | positive regulation of catabolic process | 332/8552 | 492/18723 | 4.36e-23 | 9.22e-21 | 332 |
| GO:0006605111 | Esophagus | ESCC | protein targeting | 229/8552 | 314/18723 | 4.93e-23 | 1.01e-20 | 229 |
| GO:0006979111 | Esophagus | ESCC | response to oxidative stress | 303/8552 | 446/18723 | 7.15e-22 | 1.30e-19 | 303 |
| GO:0031331111 | Esophagus | ESCC | positive regulation of cellular catabolic process | 292/8552 | 427/18723 | 8.67e-22 | 1.53e-19 | 292 |
| GO:001820514 | Esophagus | ESCC | peptidyl-lysine modification | 259/8552 | 376/18723 | 3.90e-20 | 5.26e-18 | 259 |
| GO:0006839110 | Esophagus | ESCC | mitochondrial transport | 187/8552 | 254/18723 | 8.35e-20 | 9.81e-18 | 187 |
| GO:1903829111 | Esophagus | ESCC | positive regulation of cellular protein localization | 199/8552 | 276/18723 | 2.99e-19 | 3.45e-17 | 199 |
| GO:0062197111 | Esophagus | ESCC | cellular response to chemical stress | 234/8552 | 337/18723 | 5.37e-19 | 5.97e-17 | 234 |
| GO:014005313 | Esophagus | ESCC | mitochondrial gene expression | 93/8552 | 108/18723 | 1.96e-18 | 2.03e-16 | 93 |
| GO:0033157110 | Esophagus | ESCC | regulation of intracellular protein transport | 169/8552 | 229/18723 | 3.31e-18 | 3.23e-16 | 169 |
| GO:001050617 | Esophagus | ESCC | regulation of autophagy | 220/8552 | 317/18723 | 6.72e-18 | 6.36e-16 | 220 |
| GO:0032388110 | Esophagus | ESCC | positive regulation of intracellular transport | 152/8552 | 202/18723 | 7.89e-18 | 7.36e-16 | 152 |
| GO:1904951111 | Esophagus | ESCC | positive regulation of establishment of protein localization | 216/8552 | 319/18723 | 1.01e-15 | 6.86e-14 | 216 |
| GO:0072655110 | Esophagus | ESCC | establishment of protein localization to mitochondrion | 97/8552 | 120/18723 | 2.17e-15 | 1.33e-13 | 97 |
| GO:009031617 | Esophagus | ESCC | positive regulation of intracellular protein transport | 122/8552 | 160/18723 | 2.45e-15 | 1.49e-13 | 122 |
| GO:0070585110 | Esophagus | ESCC | protein localization to mitochondrion | 100/8552 | 125/18723 | 2.96e-15 | 1.77e-13 | 100 |
| Page: 1 2 3 4 5 6 7 8 9 10 11 12 13 14 15 16 17 18 19 20 21 22 23 24 25 26 27 28 29 30 31 32 33 34 35 36 37 38 39 40 41 42 43 44 45 46 47 48 49 50 51 52 53 54 55 56 |
| Pathway ID | Tissue | Disease Stage | Description | Gene Ratio | Bg Ratio | pvalue | p.adjust | qvalue | Count |
| hsa04932210 | Esophagus | ESCC | Non-alcoholic fatty liver disease | 122/4205 | 155/8465 | 5.69e-14 | 1.59e-12 | 8.14e-13 | 122 |
| hsa05418211 | Esophagus | ESCC | Fluid shear stress and atherosclerosis | 109/4205 | 139/8465 | 2.00e-12 | 3.72e-11 | 1.90e-11 | 109 |
| hsa04714211 | Esophagus | ESCC | Thermogenesis | 163/4205 | 232/8465 | 9.22e-11 | 1.14e-09 | 5.86e-10 | 163 |
| hsa0414010 | Esophagus | ESCC | Autophagy - animal | 101/4205 | 141/8465 | 7.60e-08 | 6.21e-07 | 3.18e-07 | 101 |
| hsa040689 | Esophagus | ESCC | FoxO signaling pathway | 89/4205 | 131/8465 | 1.56e-05 | 7.98e-05 | 4.09e-05 | 89 |
| hsa0415210 | Esophagus | ESCC | AMPK signaling pathway | 80/4205 | 121/8465 | 1.73e-04 | 6.67e-04 | 3.42e-04 | 80 |
| hsa049109 | Esophagus | ESCC | Insulin signaling pathway | 89/4205 | 137/8465 | 1.97e-04 | 7.32e-04 | 3.75e-04 | 89 |
| hsa041505 | Esophagus | ESCC | mTOR signaling pathway | 98/4205 | 156/8465 | 5.81e-04 | 1.95e-03 | 9.97e-04 | 98 |
| hsa04530211 | Esophagus | ESCC | Tight junction | 105/4205 | 169/8465 | 6.73e-04 | 2.23e-03 | 1.14e-03 | 105 |
| hsa049318 | Esophagus | ESCC | Insulin resistance | 69/4205 | 108/8465 | 1.92e-03 | 5.54e-03 | 2.84e-03 | 69 |
| hsa0421114 | Esophagus | ESCC | Longevity regulating pathway | 58/4205 | 89/8465 | 2.19e-03 | 6.16e-03 | 3.16e-03 | 58 |
| hsa047105 | Esophagus | ESCC | Circadian rhythm | 24/4205 | 34/8465 | 1.09e-02 | 2.51e-02 | 1.29e-02 | 24 |
| hsa041517 | Esophagus | ESCC | PI3K-Akt signaling pathway | 197/4205 | 354/8465 | 1.24e-02 | 2.83e-02 | 1.45e-02 | 197 |
| hsa0492214 | Esophagus | ESCC | Glucagon signaling pathway | 64/4205 | 107/8465 | 2.18e-02 | 4.80e-02 | 2.46e-02 | 64 |
| hsa0493238 | Esophagus | ESCC | Non-alcoholic fatty liver disease | 122/4205 | 155/8465 | 5.69e-14 | 1.59e-12 | 8.14e-13 | 122 |
| hsa05418310 | Esophagus | ESCC | Fluid shear stress and atherosclerosis | 109/4205 | 139/8465 | 2.00e-12 | 3.72e-11 | 1.90e-11 | 109 |
| hsa04714310 | Esophagus | ESCC | Thermogenesis | 163/4205 | 232/8465 | 9.22e-11 | 1.14e-09 | 5.86e-10 | 163 |
| hsa0414015 | Esophagus | ESCC | Autophagy - animal | 101/4205 | 141/8465 | 7.60e-08 | 6.21e-07 | 3.18e-07 | 101 |
| hsa0406814 | Esophagus | ESCC | FoxO signaling pathway | 89/4205 | 131/8465 | 1.56e-05 | 7.98e-05 | 4.09e-05 | 89 |
| hsa0415213 | Esophagus | ESCC | AMPK signaling pathway | 80/4205 | 121/8465 | 1.73e-04 | 6.67e-04 | 3.42e-04 | 80 |
| Page: 1 2 3 4 5 6 7 |
Top |
Cell-cell communication analysis |
| Identification of potential cell-cell interactions between two cell types and their ligand-receptor pairs for different disease states |
| Ligand | Receptor | LRpair | Pathway | Tissue | Disease Stage |
| Page: 1 |
Top |
Single-cell gene regulatory network inference analysis |
| Find out the significant the regulons (TFs) and the target genes of each regulon across cell types for different disease states |
| TF | Cell Type | Tissue | Disease Stage | Target Gene | RSS | Regulon Activity |
| PRKAA1 | pDC | Lung | AAH | PTGDS,KANSL1,FBRS, etc. | 1.30e-02 |  |
| PRKAA1 | GDT | Thyroid | HT | FAM111A-DT,TRGC1,SPIN4, etc. | 6.52e-02 |  |
| ∗The dot plots of a searched regulon are shown for all cell subpopulations in each disease state of each tissue based on the regulon specific score inferred using pySCENIC and by calculating the average expression. |
| Page: 1 |
Top |
Somatic mutation of malignant transformation related genes |
| Annotation of somatic variants for genes involved in malignant transformation |
| Hugo Symbol | Variant Class | Variant Classification | dbSNP RS | HGVSc | HGVSp | HGVSp Short | SWISSPROT | BIOTYPE | SIFT | PolyPhen | Tumor Sample Barcode | Tissue | Histology | Sex | Age | Stage | Therapy Types | Drugs | Outcome |
| PRKAA1 | SNV | Missense_Mutation | novel | c.768N>G | p.Ile256Met | p.I256M | Q13131 | protein_coding | tolerated(0.15) | possibly_damaging(0.822) | TCGA-3C-AALI-01 | Breast | breast invasive carcinoma | Female | <65 | I/II | Unspecific | Poly E | Complete Response |
| PRKAA1 | SNV | Missense_Mutation | novel | c.104N>G | p.Val35Gly | p.V35G | Q13131 | protein_coding | deleterious(0) | possibly_damaging(0.474) | TCGA-A2-A0CS-01 | Breast | breast invasive carcinoma | Female | >=65 | III/IV | Hormone Therapy | anastrozole | SD |
| PRKAA1 | SNV | Missense_Mutation | c.398N>G | p.Ser133Cys | p.S133C | Q13131 | protein_coding | deleterious_low_confidence(0.05) | benign(0.344) | TCGA-B6-A0WZ-01 | Breast | breast invasive carcinoma | Female | <65 | I/II | Unknown | Unknown | PD | |
| PRKAA1 | SNV | Missense_Mutation | c.856N>C | p.Lys286Gln | p.K286Q | Q13131 | protein_coding | tolerated(0.21) | benign(0.29) | TCGA-BH-A18V-01 | Breast | breast invasive carcinoma | Female | <65 | I/II | Unknown | Unknown | SD | |
| PRKAA1 | SNV | Missense_Mutation | rs200927672 | c.217C>T | p.Arg73Cys | p.R73C | Q13131 | protein_coding | deleterious(0) | possibly_damaging(0.899) | TCGA-C8-A12X-01 | Breast | breast invasive carcinoma | Female | <65 | I/II | Unknown | Unknown | SD |
| PRKAA1 | SNV | Missense_Mutation | novel | c.344A>G | p.Tyr115Cys | p.Y115C | Q13131 | protein_coding | deleterious(0.01) | possibly_damaging(0.878) | TCGA-LL-A6FR-01 | Breast | breast invasive carcinoma | Female | <65 | I/II | Chemotherapy | adriamycin | SD |
| PRKAA1 | SNV | Missense_Mutation | rs369722345 | c.1547N>C | p.Arg516Pro | p.R516P | Q13131 | protein_coding | tolerated(0.32) | benign(0.269) | TCGA-UU-A93S-01 | Breast | breast invasive carcinoma | Female | <65 | III/IV | Unknown | Unknown | PD |
| PRKAA1 | insertion | Frame_Shift_Ins | novel | c.193_194insCCCAGGTTATGTGGTATGCAAAAGCCCCTTTGTGGGAGAGCTG | p.Ser65ThrfsTer17 | p.S65Tfs*17 | Q13131 | protein_coding | TCGA-AN-A04C-01 | Breast | breast invasive carcinoma | Female | <65 | I/II | Unknown | Unknown | SD | ||
| PRKAA1 | insertion | In_Frame_Ins | novel | c.1085_1086insGCC | p.Glu362_Ala363insPro | p.E362_A363insP | Q13131 | protein_coding | TCGA-AO-A03R-01 | Breast | breast invasive carcinoma | Female | <65 | I/II | Chemotherapy | doxorubicin | SD | ||
| PRKAA1 | insertion | In_Frame_Ins | novel | c.1084_1085insGAAAGTTTGTGGTTCACTTATATTATC | p.Glu362delinsGlyLysPheValValHisLeuTyrTyrGln | p.E362delinsGKFVVHLYYQ | Q13131 | protein_coding | TCGA-AO-A03R-01 | Breast | breast invasive carcinoma | Female | <65 | I/II | Chemotherapy | doxorubicin | SD |
| Page: 1 2 3 4 5 6 7 8 |
Top |
Related drugs of malignant transformation related genes |
| Identification of chemicals and drugs interact with genes involved in malignant transfromation |
| (DGIdb 4.0) |
| Entrez ID | Symbol | Category | Interaction Types | Drug Claim Name | Drug Name | PMIDs |
| 5562 | PRKAA1 | KINASE, DRUGGABLE GENOME, ENZYME, TRANSCRIPTION FACTOR, TRANSPORTER, SERINE THREONINE KINASE | DEOXYCOFORMYCIN | PENTOSTATIN | 11969266 | |
| 5562 | PRKAA1 | KINASE, DRUGGABLE GENOME, ENZYME, TRANSCRIPTION FACTOR, TRANSPORTER, SERINE THREONINE KINASE | THYROXINE | THYROXINE | 12433937 | |
| 5562 | PRKAA1 | KINASE, DRUGGABLE GENOME, ENZYME, TRANSCRIPTION FACTOR, TRANSPORTER, SERINE THREONINE KINASE | ENTRECTINIB | ENTRECTINIB | ||
| 5562 | PRKAA1 | KINASE, DRUGGABLE GENOME, ENZYME, TRANSCRIPTION FACTOR, TRANSPORTER, SERINE THREONINE KINASE | CHEMOPREVENTIVE AGENT | 16041863 | ||
| 5562 | PRKAA1 | KINASE, DRUGGABLE GENOME, ENZYME, TRANSCRIPTION FACTOR, TRANSPORTER, SERINE THREONINE KINASE | PHENFORMIN | PHENFORMIN | ||
| 5562 | PRKAA1 | KINASE, DRUGGABLE GENOME, ENZYME, TRANSCRIPTION FACTOR, TRANSPORTER, SERINE THREONINE KINASE | JNJ-7706621 | JNJ-7706621 | ||
| 5562 | PRKAA1 | KINASE, DRUGGABLE GENOME, ENZYME, TRANSCRIPTION FACTOR, TRANSPORTER, SERINE THREONINE KINASE | STREPTOZOTOCIN | STREPTOZOCIN | 15616011 | |
| 5562 | PRKAA1 | KINASE, DRUGGABLE GENOME, ENZYME, TRANSCRIPTION FACTOR, TRANSPORTER, SERINE THREONINE KINASE | CENISERTIB | CENISERTIB | ||
| 5562 | PRKAA1 | KINASE, DRUGGABLE GENOME, ENZYME, TRANSCRIPTION FACTOR, TRANSPORTER, SERINE THREONINE KINASE | LY-2090314 | LY-2090314 | ||
| 5562 | PRKAA1 | KINASE, DRUGGABLE GENOME, ENZYME, TRANSCRIPTION FACTOR, TRANSPORTER, SERINE THREONINE KINASE | PD-0166285 | PD-0166285 |
| Page: 1 2 3 4 |

Copyright 2023-Present -The University of Texas Health Science Center at Houston |