
|
|||||
|
 | |
| |
| |
| |
| |
| |
|
Gene: PRIMPOL |
Gene summary for PRIMPOL |
| Gene information | Species | Human | Gene symbol | PRIMPOL | Gene ID | 201973 |
| Gene name | primase and DNA directed polymerase | |
| Gene Alias | CCDC111 | |
| Cytomap | 4q35.1 | |
| Gene Type | protein-coding | GO ID | GO:0000002 | UniProtAcc | D3DP56 |
Top |
Malignant transformation analysis |
| Identification of the aberrant gene expression in precancerous and cancerous lesions by comparing the gene expression of stem-like cells in diseased tissues with normal stem cells |
| Entrez ID | Symbol | Replicates | Species | Organ | Tissue | Adj P-value | Log2FC | Malignancy |
| 201973 | PRIMPOL | LZE4T | Human | Esophagus | ESCC | 6.14e-11 | 2.20e-01 | 0.0811 |
| 201973 | PRIMPOL | LZE7T | Human | Esophagus | ESCC | 1.00e-05 | 1.91e-01 | 0.0667 |
| 201973 | PRIMPOL | LZE22T | Human | Esophagus | ESCC | 1.30e-02 | 1.52e-01 | 0.068 |
| 201973 | PRIMPOL | LZE24T | Human | Esophagus | ESCC | 2.84e-07 | 1.09e-01 | 0.0596 |
| 201973 | PRIMPOL | P1T-E | Human | Esophagus | ESCC | 4.57e-04 | 2.37e-01 | 0.0875 |
| 201973 | PRIMPOL | P2T-E | Human | Esophagus | ESCC | 6.47e-25 | 3.27e-01 | 0.1177 |
| 201973 | PRIMPOL | P4T-E | Human | Esophagus | ESCC | 5.00e-23 | 1.75e-01 | 0.1323 |
| 201973 | PRIMPOL | P5T-E | Human | Esophagus | ESCC | 1.09e-07 | 1.53e-01 | 0.1327 |
| 201973 | PRIMPOL | P8T-E | Human | Esophagus | ESCC | 5.28e-04 | 9.01e-02 | 0.0889 |
| 201973 | PRIMPOL | P9T-E | Human | Esophagus | ESCC | 4.94e-09 | 7.42e-02 | 0.1131 |
| 201973 | PRIMPOL | P10T-E | Human | Esophagus | ESCC | 8.53e-12 | 1.72e-01 | 0.116 |
| 201973 | PRIMPOL | P11T-E | Human | Esophagus | ESCC | 2.20e-02 | 1.67e-01 | 0.1426 |
| 201973 | PRIMPOL | P12T-E | Human | Esophagus | ESCC | 5.04e-22 | 3.92e-01 | 0.1122 |
| 201973 | PRIMPOL | P15T-E | Human | Esophagus | ESCC | 5.35e-14 | 1.23e-01 | 0.1149 |
| 201973 | PRIMPOL | P16T-E | Human | Esophagus | ESCC | 1.45e-13 | 2.85e-01 | 0.1153 |
| 201973 | PRIMPOL | P17T-E | Human | Esophagus | ESCC | 5.31e-06 | 2.28e-01 | 0.1278 |
| 201973 | PRIMPOL | P20T-E | Human | Esophagus | ESCC | 2.00e-08 | 1.80e-01 | 0.1124 |
| 201973 | PRIMPOL | P21T-E | Human | Esophagus | ESCC | 4.74e-12 | 2.04e-01 | 0.1617 |
| 201973 | PRIMPOL | P22T-E | Human | Esophagus | ESCC | 5.43e-12 | 2.16e-01 | 0.1236 |
| 201973 | PRIMPOL | P23T-E | Human | Esophagus | ESCC | 1.84e-31 | 8.61e-01 | 0.108 |
| Page: 1 2 3 |
| Tissue | Expression Dynamics | Abbreviation |
| Esophagus | 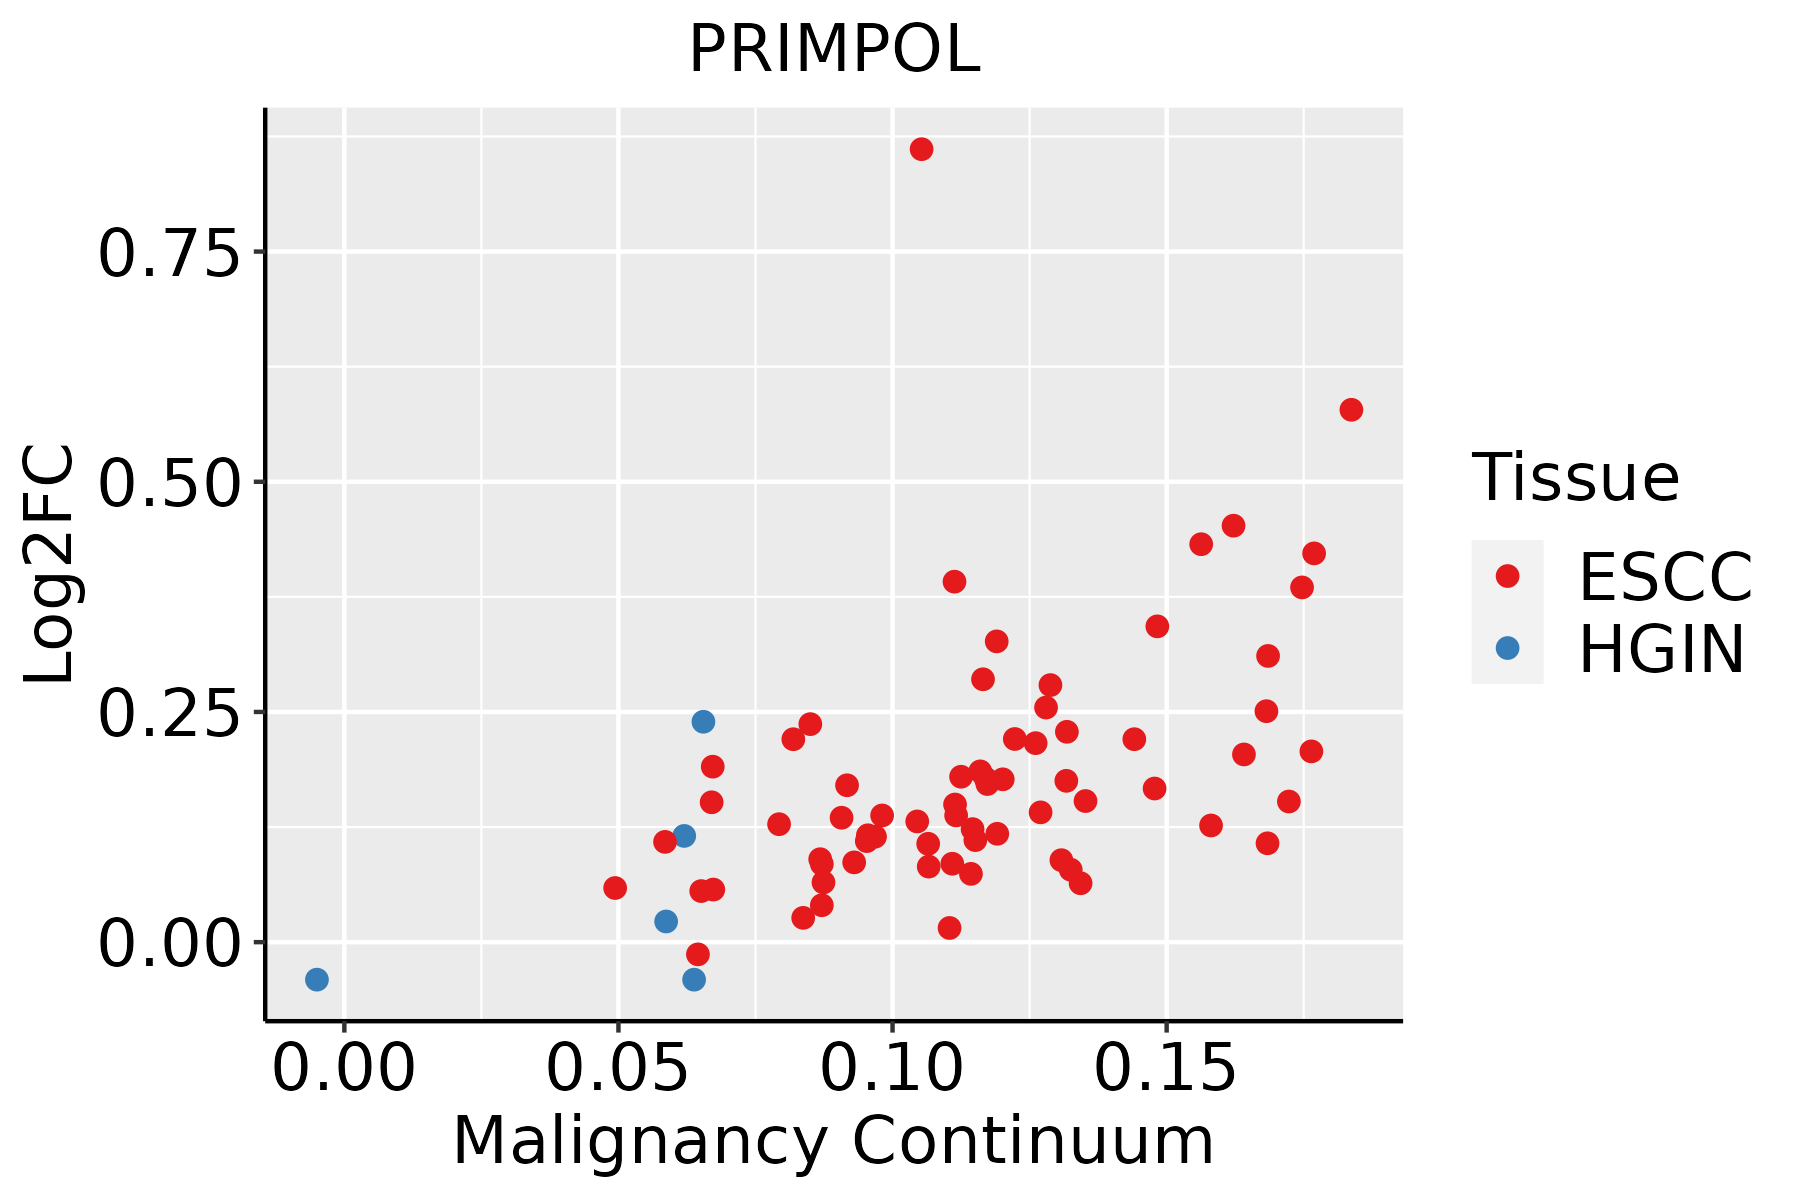 | ESCC: Esophageal squamous cell carcinoma |
| HGIN: High-grade intraepithelial neoplasias | ||
| LGIN: Low-grade intraepithelial neoplasias |
| ∗log2FC in expression of this searched gene in stem-like cells from each diseased tissue sample relative to stem-like cells in normal samples in each tissue plotted against the malignancy continuum. Samples are colored based on if they are from different disease stage. |
Top |
Malignant transformation related pathway analysis |
| Find out the enriched GO biological processes and KEGG pathways involved in transition from healthy to precancer to cancer |
| Tissue | Disease Stage | Enriched GO biological Processes |
| Colorectum | AD |  |
| Colorectum | SER |  |
| Colorectum | MSS |  |
| Colorectum | MSI-H |  |
| Colorectum | FAP |  |
| ∗Top 15 enriched GO BP terms are showed in the bar plot of each disease state in each tissue. Each row represents a significant GO biological process which is colored according to the -log10(p.adjust). |
| Page: 1 2 3 4 5 6 7 8 9 |
| GO ID | Tissue | Disease Stage | Description | Gene Ratio | Bg Ratio | pvalue | p.adjust | Count |
| GO:000941113 | Esophagus | ESCC | response to UV | 115/8552 | 149/18723 | 3.29e-15 | 1.93e-13 | 115 |
| GO:00062604 | Esophagus | ESCC | DNA replication | 181/8552 | 260/18723 | 3.55e-15 | 2.05e-13 | 181 |
| GO:007189716 | Esophagus | ESCC | DNA biosynthetic process | 127/8552 | 180/18723 | 1.04e-11 | 3.85e-10 | 127 |
| GO:000931419 | Esophagus | ESCC | response to radiation | 277/8552 | 456/18723 | 4.42e-11 | 1.43e-09 | 277 |
| GO:00062612 | Esophagus | ESCC | DNA-dependent DNA replication | 100/8552 | 151/18723 | 2.61e-07 | 3.94e-06 | 100 |
| GO:00063012 | Esophagus | ESCC | postreplication repair | 26/8552 | 31/18723 | 1.32e-05 | 1.21e-04 | 26 |
| GO:000941611 | Esophagus | ESCC | response to light stimulus | 183/8552 | 320/18723 | 2.03e-05 | 1.76e-04 | 183 |
| GO:00000021 | Esophagus | ESCC | mitochondrial genome maintenance | 17/8552 | 21/18723 | 1.03e-03 | 5.19e-03 | 17 |
| GO:0019985 | Esophagus | ESCC | translesion synthesis | 17/8552 | 21/18723 | 1.03e-03 | 5.19e-03 | 17 |
| Page: 1 |
| Pathway ID | Tissue | Disease Stage | Description | Gene Ratio | Bg Ratio | pvalue | p.adjust | qvalue | Count |
| Page: 1 |
Top |
Cell-cell communication analysis |
| Identification of potential cell-cell interactions between two cell types and their ligand-receptor pairs for different disease states |
| Ligand | Receptor | LRpair | Pathway | Tissue | Disease Stage |
| Page: 1 |
Top |
Single-cell gene regulatory network inference analysis |
| Find out the significant the regulons (TFs) and the target genes of each regulon across cell types for different disease states |
| TF | Cell Type | Tissue | Disease Stage | Target Gene | RSS | Regulon Activity |
| ∗The dot plots of a searched regulon are shown for all cell subpopulations in each disease state of each tissue based on the regulon specific score inferred using pySCENIC and by calculating the average expression. |
| Page: 1 |
Top |
Somatic mutation of malignant transformation related genes |
| Annotation of somatic variants for genes involved in malignant transformation |
| Hugo Symbol | Variant Class | Variant Classification | dbSNP RS | HGVSc | HGVSp | HGVSp Short | SWISSPROT | BIOTYPE | SIFT | PolyPhen | Tumor Sample Barcode | Tissue | Histology | Sex | Age | Stage | Therapy Types | Drugs | Outcome |
| PRIMPOL | SNV | Missense_Mutation | novel | c.58N>C | p.Glu20Gln | p.E20Q | Q96LW4 | protein_coding | tolerated(0.31) | benign(0.121) | TCGA-A7-A26H-01 | Breast | breast invasive carcinoma | Female | >=65 | I/II | Hormone Therapy | anastrozole | PD |
| PRIMPOL | SNV | Missense_Mutation | c.607N>A | p.Glu203Lys | p.E203K | Q96LW4 | protein_coding | tolerated(0.65) | benign(0.015) | TCGA-AC-A23H-01 | Breast | breast invasive carcinoma | Female | >=65 | I/II | Unknown | Unknown | PD | |
| PRIMPOL | SNV | Missense_Mutation | novel | c.139N>G | p.Arg47Gly | p.R47G | Q96LW4 | protein_coding | deleterious(0) | probably_damaging(0.958) | TCGA-AC-A3W6-01 | Breast | breast invasive carcinoma | Female | >=65 | III/IV | Unknown | Unknown | SD |
| PRIMPOL | SNV | Missense_Mutation | c.1108G>C | p.Glu370Gln | p.E370Q | Q96LW4 | protein_coding | tolerated(0.09) | benign(0.024) | TCGA-BH-A18U-01 | Breast | breast invasive carcinoma | Female | >=65 | III/IV | Unknown | Unknown | SD | |
| PRIMPOL | SNV | Missense_Mutation | c.560A>T | p.Asn187Ile | p.N187I | Q96LW4 | protein_coding | deleterious(0) | benign(0.209) | TCGA-AD-6889-01 | Colorectum | colon adenocarcinoma | Male | >=65 | I/II | Chemotherapy | xeloda | PD | |
| PRIMPOL | SNV | Missense_Mutation | rs770207392 | c.967N>A | p.Glu323Lys | p.E323K | Q96LW4 | protein_coding | deleterious(0) | probably_damaging(0.995) | TCGA-CA-6717-01 | Colorectum | colon adenocarcinoma | Male | <65 | I/II | Chemotherapy | oxaliplatin | CR |
| PRIMPOL | SNV | Missense_Mutation | c.699N>A | p.Met233Ile | p.M233I | Q96LW4 | protein_coding | tolerated(0.39) | benign(0.007) | TCGA-CM-6168-01 | Colorectum | colon adenocarcinoma | Female | >=65 | I/II | Unknown | Unknown | SD | |
| PRIMPOL | SNV | Missense_Mutation | c.602N>A | p.Gly201Asp | p.G201D | Q96LW4 | protein_coding | tolerated(0.55) | benign(0.001) | TCGA-G4-6588-01 | Colorectum | colon adenocarcinoma | Female | <65 | I/II | Unknown | Unknown | SD | |
| PRIMPOL | SNV | Missense_Mutation | rs568649420 | c.226N>T | p.Arg76Cys | p.R76C | Q96LW4 | protein_coding | deleterious(0) | probably_damaging(0.998) | TCGA-NH-A5IV-01 | Colorectum | colon adenocarcinoma | Female | >=65 | I/II | Unknown | Unknown | SD |
| PRIMPOL | SNV | Missense_Mutation | c.286N>A | p.Leu96Ile | p.L96I | Q96LW4 | protein_coding | deleterious(0.01) | probably_damaging(0.944) | TCGA-AG-A002-01 | Colorectum | rectum adenocarcinoma | Male | <65 | I/II | Unknown | Unknown | SD |
| Page: 1 2 3 4 5 |
Top |
Related drugs of malignant transformation related genes |
| Identification of chemicals and drugs interact with genes involved in malignant transfromation |
| (DGIdb 4.0) |
| Entrez ID | Symbol | Category | Interaction Types | Drug Claim Name | Drug Name | PMIDs |
| Page: 1 |

Copyright 2023-Present -The University of Texas Health Science Center at Houston |