
|
|||||
|
 | |
| |
| |
| |
| |
| |
|
Gene: PRIM2 |
Gene summary for PRIM2 |
| Gene information | Species | Human | Gene symbol | PRIM2 | Gene ID | 5558 |
| Gene name | DNA primase subunit 2 | |
| Gene Alias | PRIM2A | |
| Cytomap | 6p11.2 | |
| Gene Type | protein-coding | GO ID | GO:0006139 | UniProtAcc | P49643 |
Top |
Malignant transformation analysis |
| Identification of the aberrant gene expression in precancerous and cancerous lesions by comparing the gene expression of stem-like cells in diseased tissues with normal stem cells |
| Entrez ID | Symbol | Replicates | Species | Organ | Tissue | Adj P-value | Log2FC | Malignancy |
| 5558 | PRIM2 | CCI_1 | Human | Cervix | CC | 3.46e-15 | 9.49e-01 | 0.528 |
| 5558 | PRIM2 | CCI_2 | Human | Cervix | CC | 1.22e-06 | 6.51e-01 | 0.5249 |
| 5558 | PRIM2 | CCI_3 | Human | Cervix | CC | 4.05e-23 | 1.17e+00 | 0.516 |
| 5558 | PRIM2 | CCII_1 | Human | Cervix | CC | 1.90e-03 | 2.07e-01 | 0.3249 |
| 5558 | PRIM2 | LZE5T | Human | Esophagus | ESCC | 1.23e-02 | 3.59e-01 | 0.0514 |
| 5558 | PRIM2 | LZE7T | Human | Esophagus | ESCC | 8.25e-05 | 3.80e-01 | 0.0667 |
| 5558 | PRIM2 | LZE20T | Human | Esophagus | ESCC | 2.59e-05 | 2.68e-01 | 0.0662 |
| 5558 | PRIM2 | LZE24T | Human | Esophagus | ESCC | 1.23e-06 | 3.01e-01 | 0.0596 |
| 5558 | PRIM2 | LZE21T | Human | Esophagus | ESCC | 1.96e-03 | 2.27e-01 | 0.0655 |
| 5558 | PRIM2 | LZE6T | Human | Esophagus | ESCC | 1.82e-04 | 2.47e-01 | 0.0845 |
| 5558 | PRIM2 | P1T-E | Human | Esophagus | ESCC | 4.30e-05 | 3.27e-01 | 0.0875 |
| 5558 | PRIM2 | P2T-E | Human | Esophagus | ESCC | 8.08e-19 | 3.22e-01 | 0.1177 |
| 5558 | PRIM2 | P4T-E | Human | Esophagus | ESCC | 3.65e-15 | 3.66e-01 | 0.1323 |
| 5558 | PRIM2 | P5T-E | Human | Esophagus | ESCC | 5.00e-17 | 3.02e-01 | 0.1327 |
| 5558 | PRIM2 | P8T-E | Human | Esophagus | ESCC | 3.28e-14 | 2.64e-01 | 0.0889 |
| 5558 | PRIM2 | P9T-E | Human | Esophagus | ESCC | 2.27e-03 | 1.52e-01 | 0.1131 |
| 5558 | PRIM2 | P10T-E | Human | Esophagus | ESCC | 1.13e-16 | 2.72e-01 | 0.116 |
| 5558 | PRIM2 | P11T-E | Human | Esophagus | ESCC | 1.03e-04 | 2.62e-01 | 0.1426 |
| 5558 | PRIM2 | P12T-E | Human | Esophagus | ESCC | 2.56e-16 | 3.34e-01 | 0.1122 |
| 5558 | PRIM2 | P15T-E | Human | Esophagus | ESCC | 1.04e-03 | 1.66e-01 | 0.1149 |
| Page: 1 2 3 4 5 |
| Tissue | Expression Dynamics | Abbreviation |
| Cervix | 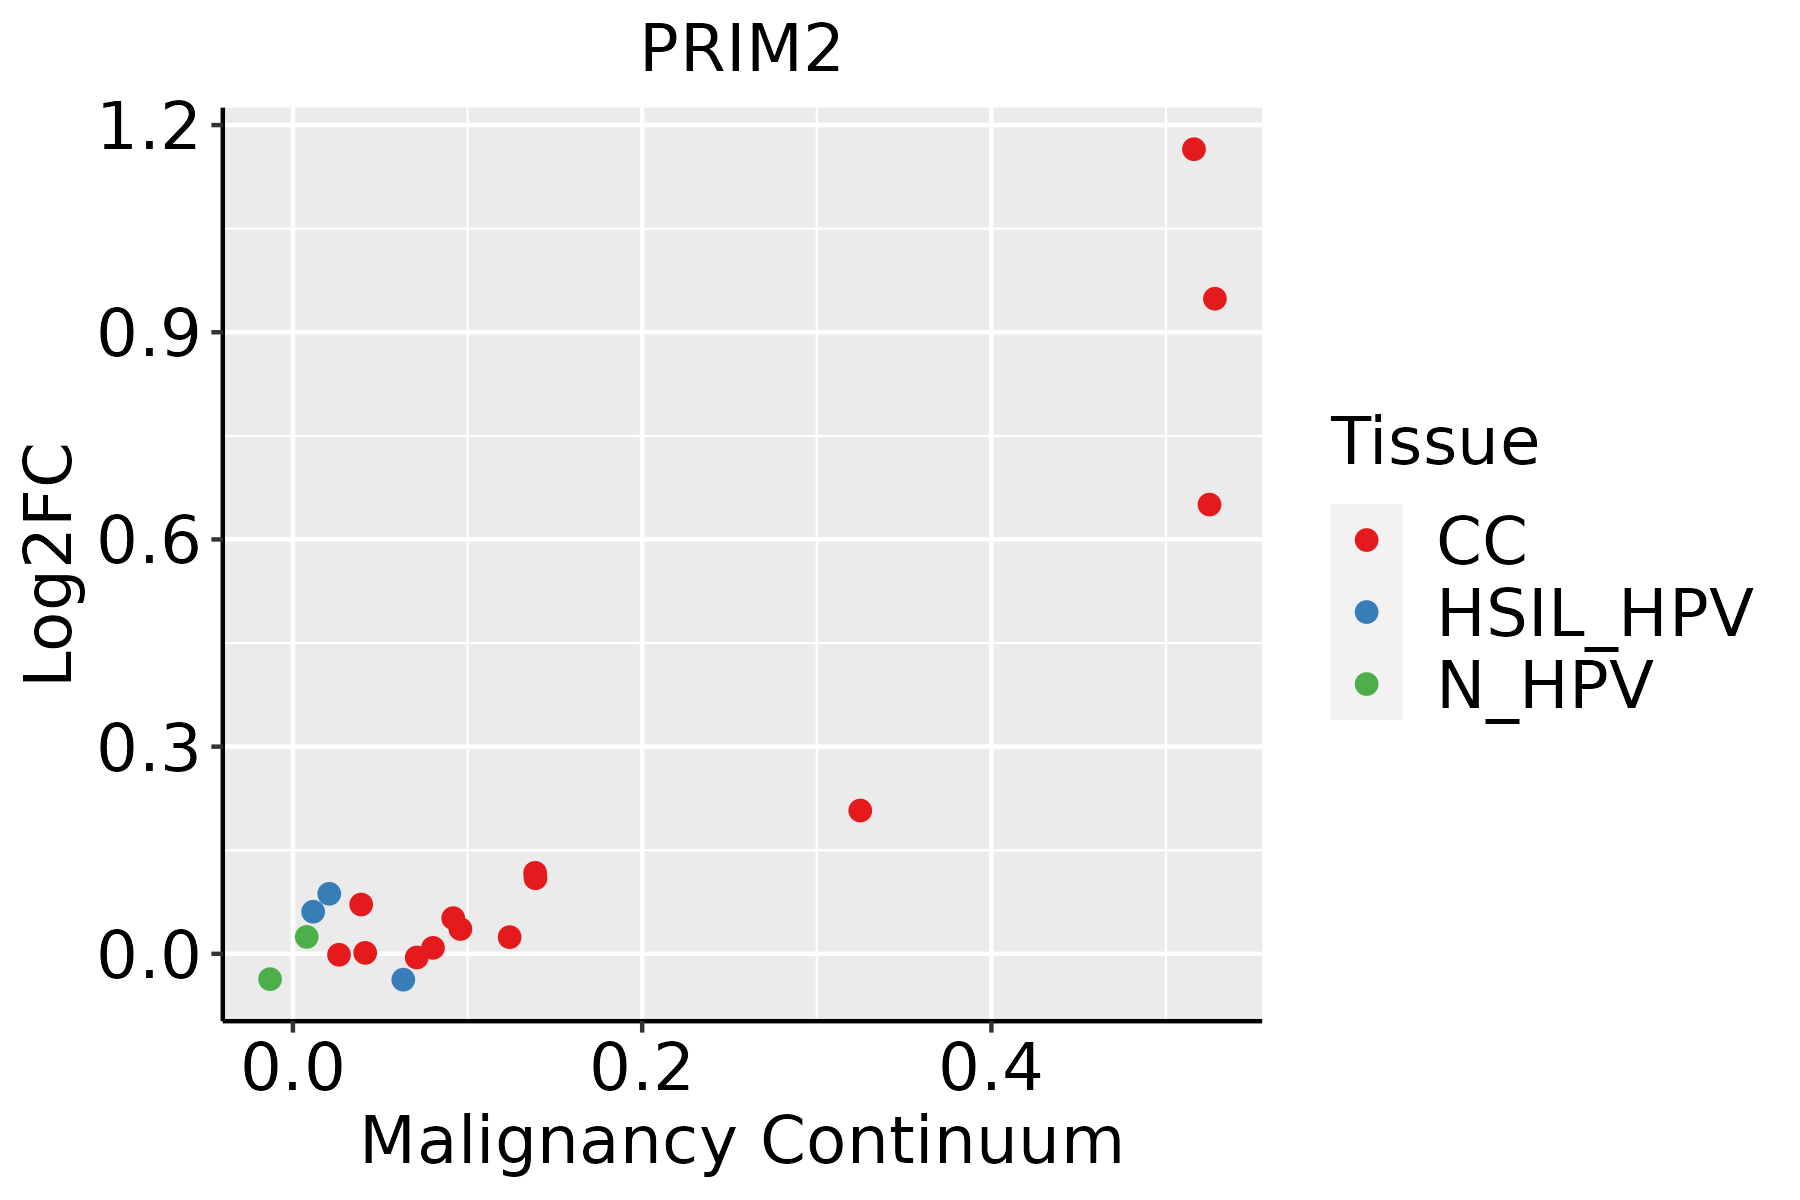 | CC: Cervix cancer |
| HSIL_HPV: HPV-infected high-grade squamous intraepithelial lesions | ||
| N_HPV: HPV-infected normal cervix | ||
| Esophagus | 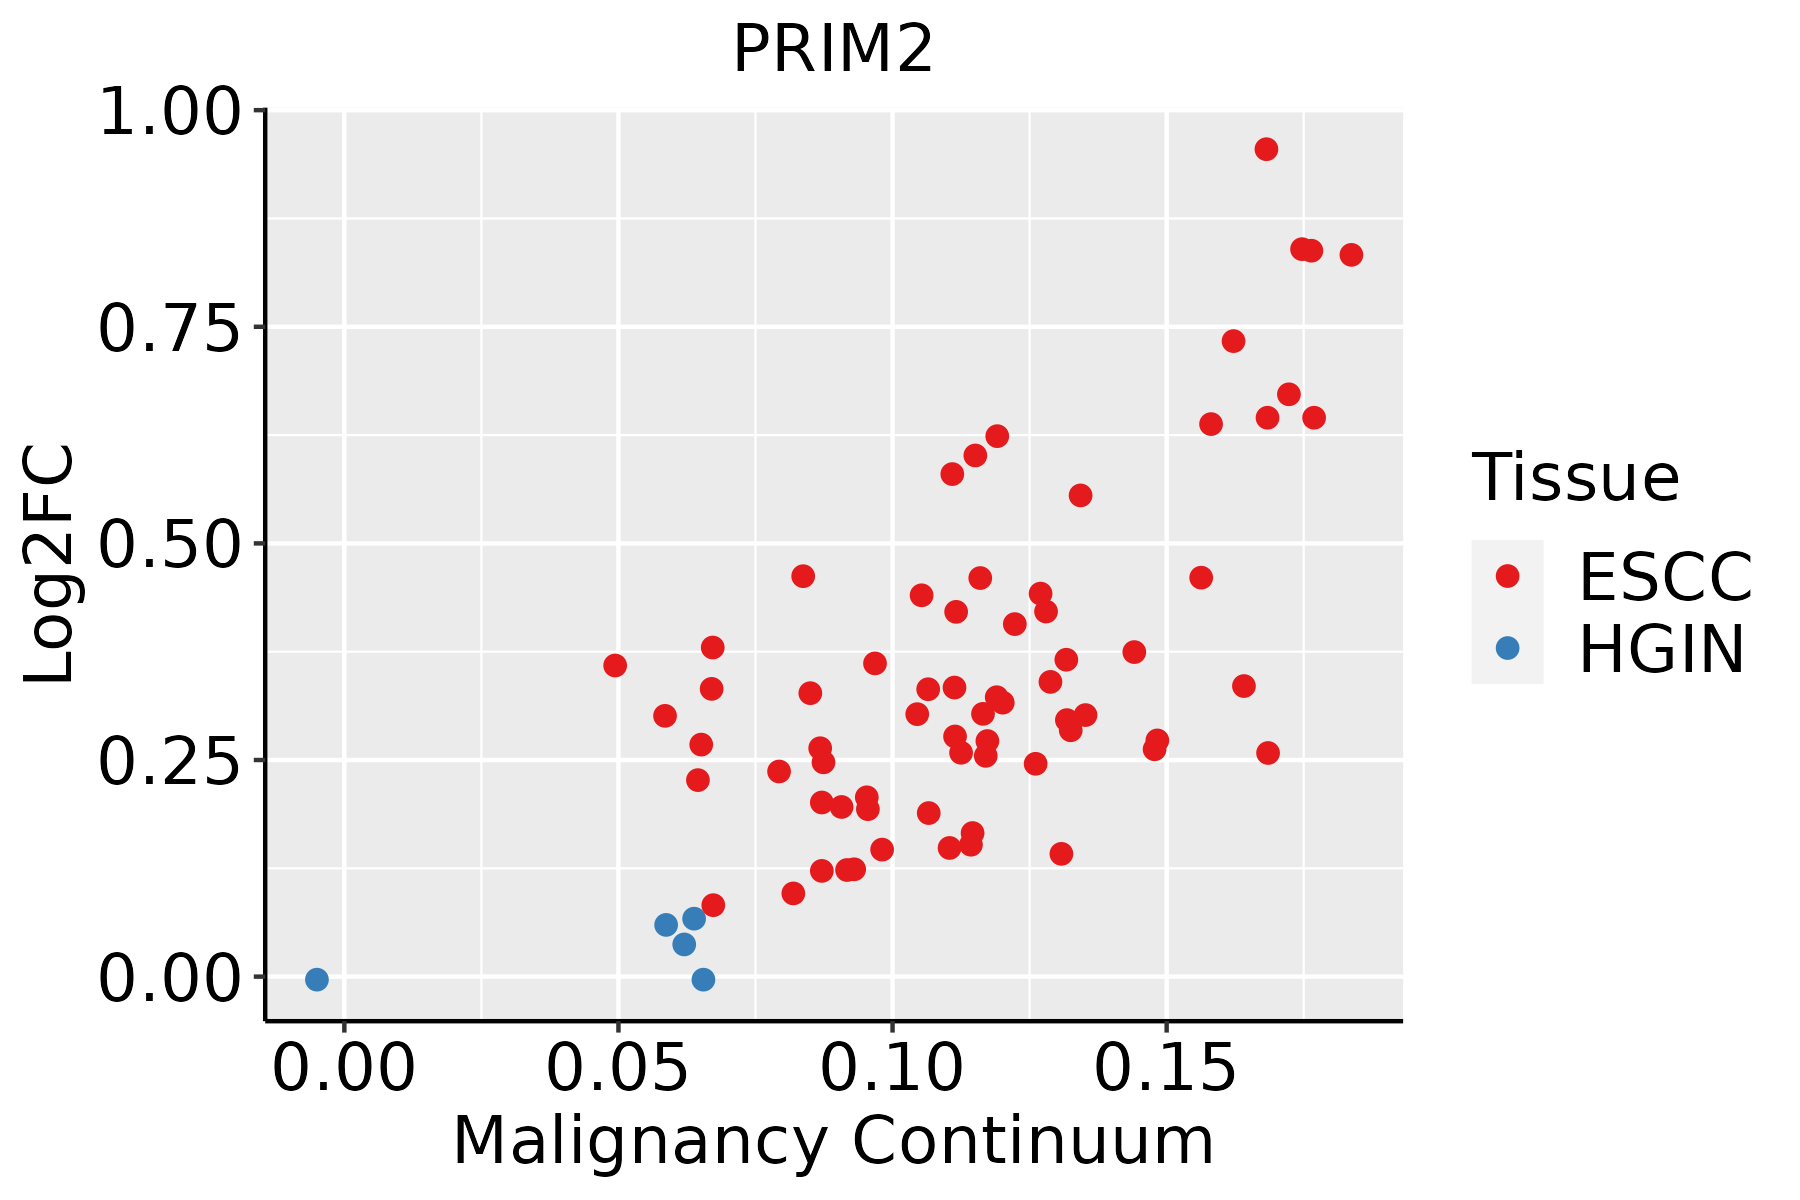 | ESCC: Esophageal squamous cell carcinoma |
| HGIN: High-grade intraepithelial neoplasias | ||
| LGIN: Low-grade intraepithelial neoplasias | ||
| Lung |  | AAH: Atypical adenomatous hyperplasia |
| AIS: Adenocarcinoma in situ | ||
| IAC: Invasive lung adenocarcinoma | ||
| MIA: Minimally invasive adenocarcinoma | ||
| Oral Cavity |  | EOLP: Erosive Oral lichen planus |
| LP: leukoplakia | ||
| NEOLP: Non-erosive oral lichen planus | ||
| OSCC: Oral squamous cell carcinoma |
| ∗log2FC in expression of this searched gene in stem-like cells from each diseased tissue sample relative to stem-like cells in normal samples in each tissue plotted against the malignancy continuum. Samples are colored based on if they are from different disease stage. |
Top |
Malignant transformation related pathway analysis |
| Find out the enriched GO biological processes and KEGG pathways involved in transition from healthy to precancer to cancer |
| Tissue | Disease Stage | Enriched GO biological Processes |
| Colorectum | AD |  |
| Colorectum | SER |  |
| Colorectum | MSS |  |
| Colorectum | MSI-H |  |
| Colorectum | FAP |  |
| ∗Top 15 enriched GO BP terms are showed in the bar plot of each disease state in each tissue. Each row represents a significant GO biological process which is colored according to the -log10(p.adjust). |
| Page: 1 2 3 4 5 6 7 8 9 |
| GO ID | Tissue | Disease Stage | Description | Gene Ratio | Bg Ratio | pvalue | p.adjust | Count |
| GO:00510528 | Cervix | CC | regulation of DNA metabolic process | 65/2311 | 359/18723 | 9.25e-04 | 7.84e-03 | 65 |
| GO:00062602 | Cervix | CC | DNA replication | 48/2311 | 260/18723 | 2.70e-03 | 1.85e-02 | 48 |
| GO:00062604 | Esophagus | ESCC | DNA replication | 181/8552 | 260/18723 | 3.55e-15 | 2.05e-13 | 181 |
| GO:005105215 | Esophagus | ESCC | regulation of DNA metabolic process | 232/8552 | 359/18723 | 2.40e-13 | 1.13e-11 | 232 |
| GO:005105417 | Esophagus | ESCC | positive regulation of DNA metabolic process | 139/8552 | 201/18723 | 1.20e-11 | 4.33e-10 | 139 |
| GO:00062612 | Esophagus | ESCC | DNA-dependent DNA replication | 100/8552 | 151/18723 | 2.61e-07 | 3.94e-06 | 100 |
| GO:00510547 | Lung | IAC | positive regulation of DNA metabolic process | 35/2061 | 201/18723 | 4.07e-03 | 3.32e-02 | 35 |
| GO:00510527 | Lung | IAC | regulation of DNA metabolic process | 55/2061 | 359/18723 | 7.12e-03 | 4.87e-02 | 55 |
| GO:00062603 | Oral cavity | OSCC | DNA replication | 159/7305 | 260/18723 | 3.25e-13 | 1.59e-11 | 159 |
| GO:005105210 | Oral cavity | OSCC | regulation of DNA metabolic process | 207/7305 | 359/18723 | 4.45e-13 | 2.17e-11 | 207 |
| GO:005105414 | Oral cavity | OSCC | positive regulation of DNA metabolic process | 126/7305 | 201/18723 | 8.12e-12 | 3.01e-10 | 126 |
| GO:00062611 | Oral cavity | OSCC | DNA-dependent DNA replication | 84/7305 | 151/18723 | 2.46e-05 | 2.30e-04 | 84 |
| GO:005105222 | Oral cavity | EOLP | regulation of DNA metabolic process | 75/2218 | 359/18723 | 5.81e-07 | 1.53e-05 | 75 |
| GO:005105421 | Oral cavity | EOLP | positive regulation of DNA metabolic process | 45/2218 | 201/18723 | 1.68e-05 | 2.77e-04 | 45 |
| Page: 1 |
| Pathway ID | Tissue | Disease Stage | Description | Gene Ratio | Bg Ratio | pvalue | p.adjust | qvalue | Count |
| hsa030304 | Esophagus | ESCC | DNA replication | 32/4205 | 36/8465 | 7.71e-07 | 5.06e-06 | 2.59e-06 | 32 |
| hsa0303011 | Esophagus | ESCC | DNA replication | 32/4205 | 36/8465 | 7.71e-07 | 5.06e-06 | 2.59e-06 | 32 |
| hsa03030 | Oral cavity | OSCC | DNA replication | 31/3704 | 36/8465 | 1.70e-07 | 1.19e-06 | 6.03e-07 | 31 |
| hsa030301 | Oral cavity | OSCC | DNA replication | 31/3704 | 36/8465 | 1.70e-07 | 1.19e-06 | 6.03e-07 | 31 |
| Page: 1 |
Top |
Cell-cell communication analysis |
| Identification of potential cell-cell interactions between two cell types and their ligand-receptor pairs for different disease states |
| Ligand | Receptor | LRpair | Pathway | Tissue | Disease Stage |
| Page: 1 |
Top |
Single-cell gene regulatory network inference analysis |
| Find out the significant the regulons (TFs) and the target genes of each regulon across cell types for different disease states |
| TF | Cell Type | Tissue | Disease Stage | Target Gene | RSS | Regulon Activity |
| ∗The dot plots of a searched regulon are shown for all cell subpopulations in each disease state of each tissue based on the regulon specific score inferred using pySCENIC and by calculating the average expression. |
| Page: 1 |
Top |
Somatic mutation of malignant transformation related genes |
| Annotation of somatic variants for genes involved in malignant transformation |
| Hugo Symbol | Variant Class | Variant Classification | dbSNP RS | HGVSc | HGVSp | HGVSp Short | SWISSPROT | BIOTYPE | SIFT | PolyPhen | Tumor Sample Barcode | Tissue | Histology | Sex | Age | Stage | Therapy Types | Drugs | Outcome |
| PRIM2 | SNV | Missense_Mutation | novel | c.1273C>G | p.Gln425Glu | p.Q425E | P49643 | protein_coding | tolerated(0.29) | possibly_damaging(0.731) | TCGA-D8-A1JL-01 | Breast | breast invasive carcinoma | Female | >=65 | I/II | Unknown | Unknown | SD |
| PRIM2 | SNV | Missense_Mutation | novel | c.474G>T | p.Glu158Asp | p.E158D | P49643 | protein_coding | tolerated(0.11) | probably_damaging(0.94) | TCGA-2W-A8YY-01 | Cervix | cervical & endocervical cancer | Female | <65 | I/II | Chemotherapy | cisplatin | CR |
| PRIM2 | SNV | Missense_Mutation | c.907N>T | p.His303Tyr | p.H303Y | P49643 | protein_coding | deleterious(0.05) | possibly_damaging(0.902) | TCGA-EK-A3GK-01 | Cervix | cervical & endocervical cancer | Female | <65 | I/II | Unknown | Unknown | SD | |
| PRIM2 | SNV | Missense_Mutation | novel | c.1037N>T | p.Ser346Phe | p.S346F | P49643 | protein_coding | deleterious(0) | probably_damaging(0.916) | TCGA-HM-A4S6-01 | Cervix | cervical & endocervical cancer | Female | <65 | III/IV | Chemotherapy | cisplatin | CR |
| PRIM2 | SNV | Missense_Mutation | novel | c.866N>A | p.Arg289His | p.R289H | P49643 | protein_coding | deleterious(0.01) | probably_damaging(0.997) | TCGA-AA-3852-01 | Colorectum | colon adenocarcinoma | Male | >=65 | I/II | Unknown | Unknown | PD |
| PRIM2 | SNV | Missense_Mutation | c.171A>C | p.Glu57Asp | p.E57D | P49643 | protein_coding | tolerated(0.1) | possibly_damaging(0.669) | TCGA-AA-A00N-01 | Colorectum | colon adenocarcinoma | Male | >=65 | I/II | Unknown | Unknown | PD | |
| PRIM2 | SNV | Missense_Mutation | c.1341C>A | p.Phe447Leu | p.F447L | P49643 | protein_coding | deleterious(0) | benign(0.22) | TCGA-AA-A00N-01 | Colorectum | colon adenocarcinoma | Male | >=65 | I/II | Unknown | Unknown | PD | |
| PRIM2 | SNV | Missense_Mutation | c.641N>A | p.Ile214Asn | p.I214N | P49643 | protein_coding | deleterious(0) | possibly_damaging(0.839) | TCGA-AA-A010-01 | Colorectum | colon adenocarcinoma | Female | <65 | I/II | Chemotherapy | folinic | CR | |
| PRIM2 | SNV | Missense_Mutation | novel | c.337N>A | p.Ser113Thr | p.S113T | P49643 | protein_coding | tolerated(0.49) | benign(0.009) | TCGA-G4-6302-01 | Colorectum | colon adenocarcinoma | Female | >=65 | I/II | Unknown | Unknown | SD |
| PRIM2 | SNV | Missense_Mutation | novel | c.620C>A | p.Ala207Asp | p.A207D | P49643 | protein_coding | deleterious(0) | probably_damaging(0.997) | TCGA-AG-3727-01 | Colorectum | rectum adenocarcinoma | Female | >=65 | III/IV | Unknown | Unknown | SD |
| Page: 1 2 3 4 5 |
Top |
Related drugs of malignant transformation related genes |
| Identification of chemicals and drugs interact with genes involved in malignant transfromation |
| (DGIdb 4.0) |
| Entrez ID | Symbol | Category | Interaction Types | Drug Claim Name | Drug Name | PMIDs |
| Page: 1 |

Copyright 2023-Present -The University of Texas Health Science Center at Houston |