
|
|||||
|
 | |
| |
| |
| |
| |
| |
|
Gene: PRIM1 |
Gene summary for PRIM1 |
| Gene information | Species | Human | Gene symbol | PRIM1 | Gene ID | 5557 |
| Gene name | DNA primase subunit 1 | |
| Gene Alias | p49 | |
| Cytomap | 12q13.3 | |
| Gene Type | protein-coding | GO ID | GO:0006139 | UniProtAcc | P49642 |
Top |
Malignant transformation analysis |
| Identification of the aberrant gene expression in precancerous and cancerous lesions by comparing the gene expression of stem-like cells in diseased tissues with normal stem cells |
| Entrez ID | Symbol | Replicates | Species | Organ | Tissue | Adj P-value | Log2FC | Malignancy |
| 5557 | PRIM1 | LZE7T | Human | Esophagus | ESCC | 6.33e-03 | 1.70e-01 | 0.0667 |
| 5557 | PRIM1 | LZE24T | Human | Esophagus | ESCC | 2.65e-05 | 1.43e-01 | 0.0596 |
| 5557 | PRIM1 | LZE6T | Human | Esophagus | ESCC | 1.62e-02 | 1.33e-01 | 0.0845 |
| 5557 | PRIM1 | P1T-E | Human | Esophagus | ESCC | 7.11e-04 | 1.78e-01 | 0.0875 |
| 5557 | PRIM1 | P2T-E | Human | Esophagus | ESCC | 4.99e-26 | 5.68e-01 | 0.1177 |
| 5557 | PRIM1 | P4T-E | Human | Esophagus | ESCC | 1.44e-21 | 4.25e-01 | 0.1323 |
| 5557 | PRIM1 | P5T-E | Human | Esophagus | ESCC | 2.73e-09 | 2.76e-01 | 0.1327 |
| 5557 | PRIM1 | P12T-E | Human | Esophagus | ESCC | 1.12e-09 | 2.35e-01 | 0.1122 |
| 5557 | PRIM1 | P15T-E | Human | Esophagus | ESCC | 3.38e-04 | 1.28e-01 | 0.1149 |
| 5557 | PRIM1 | P16T-E | Human | Esophagus | ESCC | 8.39e-08 | 2.16e-01 | 0.1153 |
| 5557 | PRIM1 | P17T-E | Human | Esophagus | ESCC | 2.68e-03 | 2.47e-01 | 0.1278 |
| 5557 | PRIM1 | P19T-E | Human | Esophagus | ESCC | 7.48e-03 | 2.76e-01 | 0.1662 |
| 5557 | PRIM1 | P20T-E | Human | Esophagus | ESCC | 1.61e-08 | 1.96e-01 | 0.1124 |
| 5557 | PRIM1 | P21T-E | Human | Esophagus | ESCC | 5.66e-07 | 1.72e-01 | 0.1617 |
| 5557 | PRIM1 | P22T-E | Human | Esophagus | ESCC | 2.06e-04 | 1.55e-01 | 0.1236 |
| 5557 | PRIM1 | P23T-E | Human | Esophagus | ESCC | 2.13e-09 | 2.91e-01 | 0.108 |
| 5557 | PRIM1 | P24T-E | Human | Esophagus | ESCC | 1.76e-06 | 2.66e-01 | 0.1287 |
| 5557 | PRIM1 | P26T-E | Human | Esophagus | ESCC | 1.73e-14 | 2.70e-01 | 0.1276 |
| 5557 | PRIM1 | P27T-E | Human | Esophagus | ESCC | 5.56e-21 | 3.95e-01 | 0.1055 |
| 5557 | PRIM1 | P28T-E | Human | Esophagus | ESCC | 2.92e-07 | 1.68e-01 | 0.1149 |
| Page: 1 2 3 4 |
| Tissue | Expression Dynamics | Abbreviation |
| Esophagus | 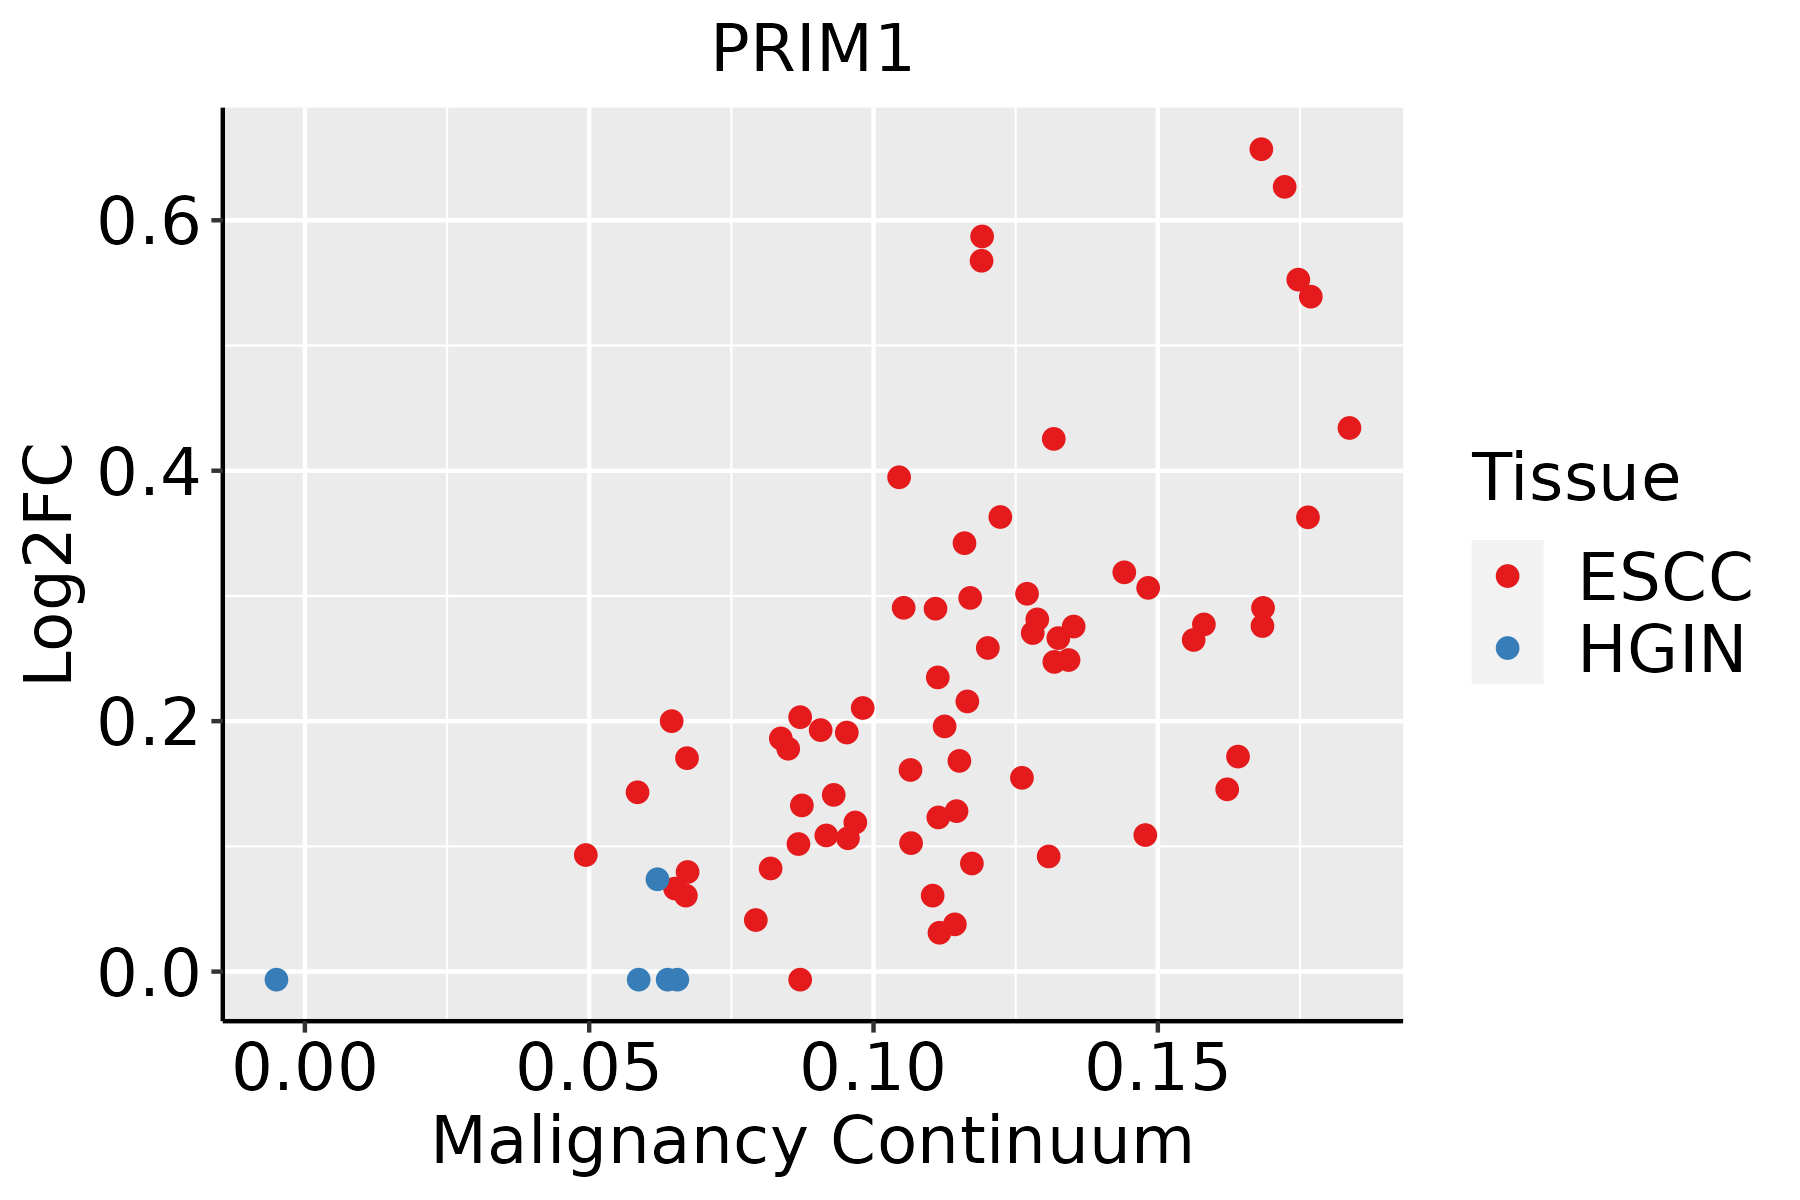 | ESCC: Esophageal squamous cell carcinoma |
| HGIN: High-grade intraepithelial neoplasias | ||
| LGIN: Low-grade intraepithelial neoplasias | ||
| Oral Cavity |  | EOLP: Erosive Oral lichen planus |
| LP: leukoplakia | ||
| NEOLP: Non-erosive oral lichen planus | ||
| OSCC: Oral squamous cell carcinoma | ||
| Skin | 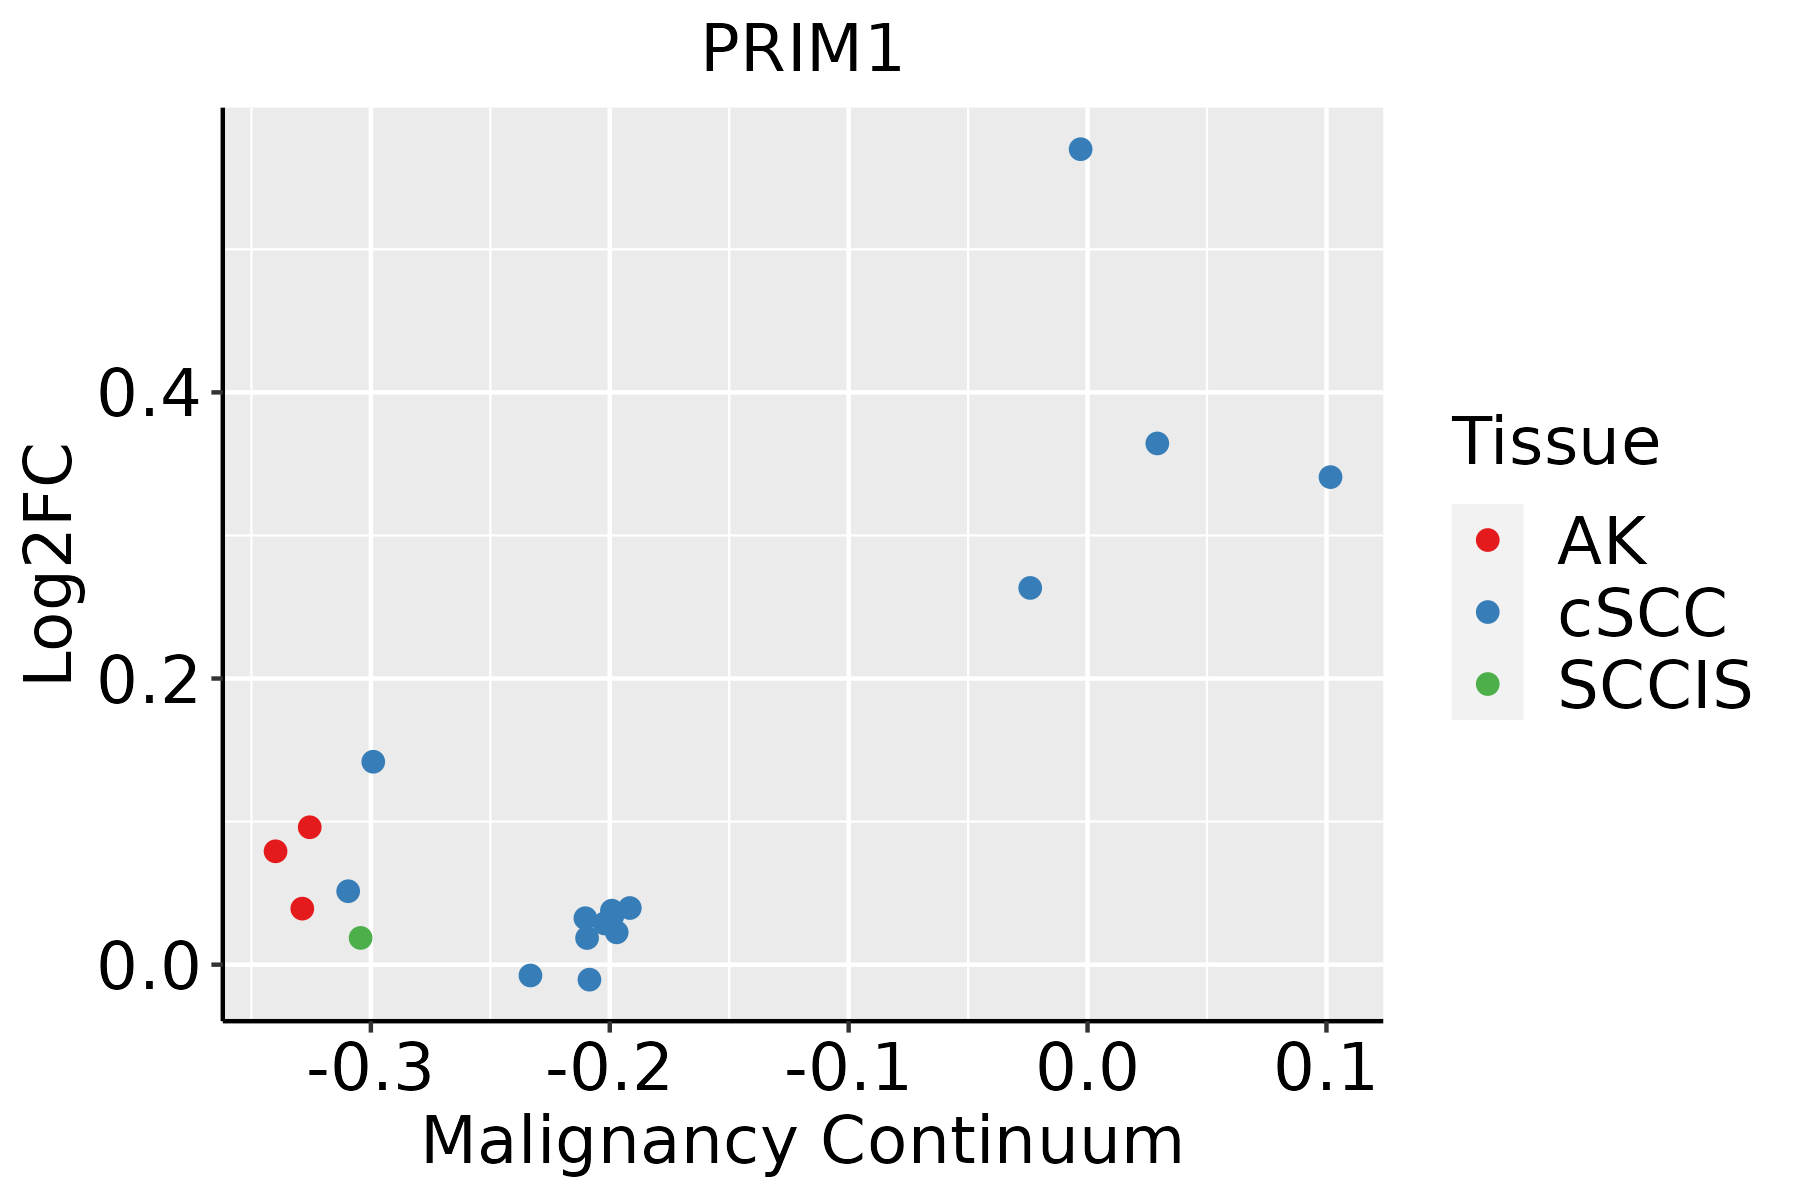 | AK: Actinic keratosis |
| cSCC: Cutaneous squamous cell carcinoma | ||
| SCCIS:squamous cell carcinoma in situ |
| ∗log2FC in expression of this searched gene in stem-like cells from each diseased tissue sample relative to stem-like cells in normal samples in each tissue plotted against the malignancy continuum. Samples are colored based on if they are from different disease stage. |
Top |
Malignant transformation related pathway analysis |
| Find out the enriched GO biological processes and KEGG pathways involved in transition from healthy to precancer to cancer |
| Tissue | Disease Stage | Enriched GO biological Processes |
| Colorectum | AD |  |
| Colorectum | SER |  |
| Colorectum | MSS |  |
| Colorectum | MSI-H |  |
| Colorectum | FAP |  |
| ∗Top 15 enriched GO BP terms are showed in the bar plot of each disease state in each tissue. Each row represents a significant GO biological process which is colored according to the -log10(p.adjust). |
| Page: 1 2 3 4 5 6 7 8 9 |
| GO ID | Tissue | Disease Stage | Description | Gene Ratio | Bg Ratio | pvalue | p.adjust | Count |
| GO:00062604 | Esophagus | ESCC | DNA replication | 181/8552 | 260/18723 | 3.55e-15 | 2.05e-13 | 181 |
| GO:00062612 | Esophagus | ESCC | DNA-dependent DNA replication | 100/8552 | 151/18723 | 2.61e-07 | 3.94e-06 | 100 |
| GO:00062603 | Oral cavity | OSCC | DNA replication | 159/7305 | 260/18723 | 3.25e-13 | 1.59e-11 | 159 |
| GO:00062611 | Oral cavity | OSCC | DNA-dependent DNA replication | 84/7305 | 151/18723 | 2.46e-05 | 2.30e-04 | 84 |
| GO:000626012 | Skin | cSCC | DNA replication | 106/4864 | 260/18723 | 1.18e-07 | 2.77e-06 | 106 |
| Page: 1 |
| Pathway ID | Tissue | Disease Stage | Description | Gene Ratio | Bg Ratio | pvalue | p.adjust | qvalue | Count |
| hsa030304 | Esophagus | ESCC | DNA replication | 32/4205 | 36/8465 | 7.71e-07 | 5.06e-06 | 2.59e-06 | 32 |
| hsa0303011 | Esophagus | ESCC | DNA replication | 32/4205 | 36/8465 | 7.71e-07 | 5.06e-06 | 2.59e-06 | 32 |
| Page: 1 |
Top |
Cell-cell communication analysis |
| Identification of potential cell-cell interactions between two cell types and their ligand-receptor pairs for different disease states |
| Ligand | Receptor | LRpair | Pathway | Tissue | Disease Stage |
| Page: 1 |
Top |
Single-cell gene regulatory network inference analysis |
| Find out the significant the regulons (TFs) and the target genes of each regulon across cell types for different disease states |
| TF | Cell Type | Tissue | Disease Stage | Target Gene | RSS | Regulon Activity |
| ∗The dot plots of a searched regulon are shown for all cell subpopulations in each disease state of each tissue based on the regulon specific score inferred using pySCENIC and by calculating the average expression. |
| Page: 1 |
Top |
Somatic mutation of malignant transformation related genes |
| Annotation of somatic variants for genes involved in malignant transformation |
| Hugo Symbol | Variant Class | Variant Classification | dbSNP RS | HGVSc | HGVSp | HGVSp Short | SWISSPROT | BIOTYPE | SIFT | PolyPhen | Tumor Sample Barcode | Tissue | Histology | Sex | Age | Stage | Therapy Types | Drugs | Outcome |
| PRIM1 | SNV | Missense_Mutation | c.189N>C | p.Gln63His | p.Q63H | P49642 | protein_coding | tolerated(0.07) | benign(0.017) | TCGA-D8-A27G-01 | Breast | breast invasive carcinoma | Female | >=65 | I/II | Unknown | Unknown | SD | |
| PRIM1 | insertion | In_Frame_Ins | novel | c.1224_1225insTATCTA | p.Gly408_Glu409insTyrLeu | p.G408_E409insYL | P49642 | protein_coding | TCGA-A2-A0ER-01 | Breast | breast invasive carcinoma | Female | <65 | I/II | Chemotherapy | cytoxan | SD | ||
| PRIM1 | insertion | Nonsense_Mutation | novel | c.1222_1223insATTTCTGAAGACAGAGCTCCTCAAACCATTGTG | p.Lys407_Gly408insAspPheTerArgGlnSerSerSerAsnHisCys | p.K407_G408insDF*RQSSSNHC | P49642 | protein_coding | TCGA-A2-A0ER-01 | Breast | breast invasive carcinoma | Female | <65 | I/II | Chemotherapy | cytoxan | SD | ||
| PRIM1 | SNV | Missense_Mutation | novel | c.331N>A | p.Asp111Asn | p.D111N | P49642 | protein_coding | deleterious(0) | probably_damaging(1) | TCGA-C5-A1MH-01 | Cervix | cervical & endocervical cancer | Female | >=65 | III/IV | Chemotherapy | cisplatin | PD |
| PRIM1 | SNV | Missense_Mutation | novel | c.427G>C | p.Asp143His | p.D143H | P49642 | protein_coding | deleterious(0.02) | probably_damaging(0.941) | TCGA-JW-AAVH-01 | Cervix | cervical & endocervical cancer | Female | <65 | I/II | Unknown | Unknown | SD |
| PRIM1 | deletion | Frame_Shift_Del | c.663delA | p.Lys221AsnfsTer24 | p.K221Nfs*24 | P49642 | protein_coding | TCGA-VS-A9U6-01 | Cervix | cervical & endocervical cancer | Female | <65 | I/II | Chemotherapy | cisplatin | PD | |||
| PRIM1 | SNV | Missense_Mutation | c.632N>G | p.Phe211Cys | p.F211C | P49642 | protein_coding | deleterious(0.04) | benign(0.035) | TCGA-AA-3510-01 | Colorectum | colon adenocarcinoma | Male | >=65 | I/II | Unknown | Unknown | SD | |
| PRIM1 | SNV | Missense_Mutation | c.1160G>A | p.Ser387Asn | p.S387N | P49642 | protein_coding | deleterious(0) | possibly_damaging(0.77) | TCGA-AA-3712-01 | Colorectum | colon adenocarcinoma | Male | >=65 | III/IV | Unknown | Unknown | SD | |
| PRIM1 | SNV | Missense_Mutation | c.623T>A | p.Ile208Asn | p.I208N | P49642 | protein_coding | deleterious(0.01) | benign(0.389) | TCGA-CK-5913-01 | Colorectum | colon adenocarcinoma | Female | <65 | I/II | Unknown | Unknown | SD | |
| PRIM1 | SNV | Missense_Mutation | rs770956129 | c.277N>G | p.Thr93Ala | p.T93A | P49642 | protein_coding | tolerated(0.32) | benign(0.005) | TCGA-F5-6814-01 | Colorectum | rectum adenocarcinoma | Male | <65 | I/II | Unknown | Unknown | SD |
| Page: 1 2 3 4 |
Top |
Related drugs of malignant transformation related genes |
| Identification of chemicals and drugs interact with genes involved in malignant transfromation |
| (DGIdb 4.0) |
| Entrez ID | Symbol | Category | Interaction Types | Drug Claim Name | Drug Name | PMIDs |
| 5557 | PRIM1 | DRUGGABLE GENOME | 3&APOS;-DEOXYADENOSINE | 8827435 |
| Page: 1 |

Copyright 2023-Present -The University of Texas Health Science Center at Houston |