
|
|||||
|
 | |
| |
| |
| |
| |
| |
|
Gene: PRH1 |
Gene summary for PRH1 |
| Gene information | Species | Human | Gene symbol | PRH1 | Gene ID | 5554 |
| Gene name | proline rich protein HaeIII subfamily 1 | |
| Gene Alias | Db-s | |
| Cytomap | 12p13.2 | |
| Gene Type | protein-coding | GO ID | GO:0005575 | UniProtAcc | A0A087WV42 |
Top |
Malignant transformation analysis |
| Identification of the aberrant gene expression in precancerous and cancerous lesions by comparing the gene expression of stem-like cells in diseased tissues with normal stem cells |
| Entrez ID | Symbol | Replicates | Species | Organ | Tissue | Adj P-value | Log2FC | Malignancy |
| 5554 | PRH1 | RNA-P25T1-P25T1-1 | Human | Lung | AIS | 1.02e-16 | 6.31e-01 | -0.2116 |
| 5554 | PRH1 | RNA-P25T1-P25T1-2 | Human | Lung | AIS | 9.39e-09 | 7.48e-01 | -0.1941 |
| 5554 | PRH1 | RNA-P25T1-P25T1-4 | Human | Lung | AIS | 2.31e-08 | 4.51e-01 | -0.2119 |
| 5554 | PRH1 | RNA-P6T2-P6T2-1 | Human | Lung | IAC | 7.27e-09 | 3.45e-01 | -0.0166 |
| 5554 | PRH1 | RNA-P6T2-P6T2-2 | Human | Lung | IAC | 7.32e-11 | 3.73e-01 | -0.0132 |
| 5554 | PRH1 | RNA-P6T2-P6T2-3 | Human | Lung | IAC | 7.06e-14 | 4.28e-01 | -0.013 |
| 5554 | PRH1 | RNA-P6T2-P6T2-4 | Human | Lung | IAC | 1.16e-09 | 3.77e-01 | -0.0121 |
| 5554 | PRH1 | HTA12-15-2 | Human | Pancreas | PDAC | 3.13e-02 | 2.86e-01 | 0.2315 |
| 5554 | PRH1 | HTA12-23-1 | Human | Pancreas | PDAC | 1.27e-03 | 6.05e-01 | 0.3405 |
| 5554 | PRH1 | HTA12-25-1 | Human | Pancreas | PDAC | 2.55e-12 | 8.07e-01 | 0.313 |
| 5554 | PRH1 | HTA12-26-1 | Human | Pancreas | PDAC | 2.36e-13 | 6.78e-01 | 0.3728 |
| 5554 | PRH1 | HTA12-29-1 | Human | Pancreas | PDAC | 1.06e-34 | 7.52e-01 | 0.3722 |
| 5554 | PRH1 | HTA12-30-1 | Human | Pancreas | PDAC | 2.66e-04 | 1.08e+00 | 0.3671 |
| 5554 | PRH1 | PTC01 | Human | Thyroid | PTC | 4.70e-13 | 2.17e-01 | 0.1899 |
| 5554 | PRH1 | PTC04 | Human | Thyroid | PTC | 5.71e-10 | 2.13e-01 | 0.1927 |
| 5554 | PRH1 | PTC05 | Human | Thyroid | PTC | 2.27e-12 | 3.62e-01 | 0.2065 |
| 5554 | PRH1 | PTC06 | Human | Thyroid | PTC | 1.25e-13 | 2.94e-01 | 0.2057 |
| 5554 | PRH1 | PTC07 | Human | Thyroid | PTC | 6.38e-17 | 3.09e-01 | 0.2044 |
| 5554 | PRH1 | ATC09 | Human | Thyroid | ATC | 6.68e-10 | 3.15e-01 | 0.2871 |
| 5554 | PRH1 | ATC11 | Human | Thyroid | ATC | 3.71e-05 | 4.68e-01 | 0.3386 |
| Page: 1 2 |
| Tissue | Expression Dynamics | Abbreviation |
| Lung |  | AAH: Atypical adenomatous hyperplasia |
| AIS: Adenocarcinoma in situ | ||
| IAC: Invasive lung adenocarcinoma | ||
| MIA: Minimally invasive adenocarcinoma | ||
| Thyroid | 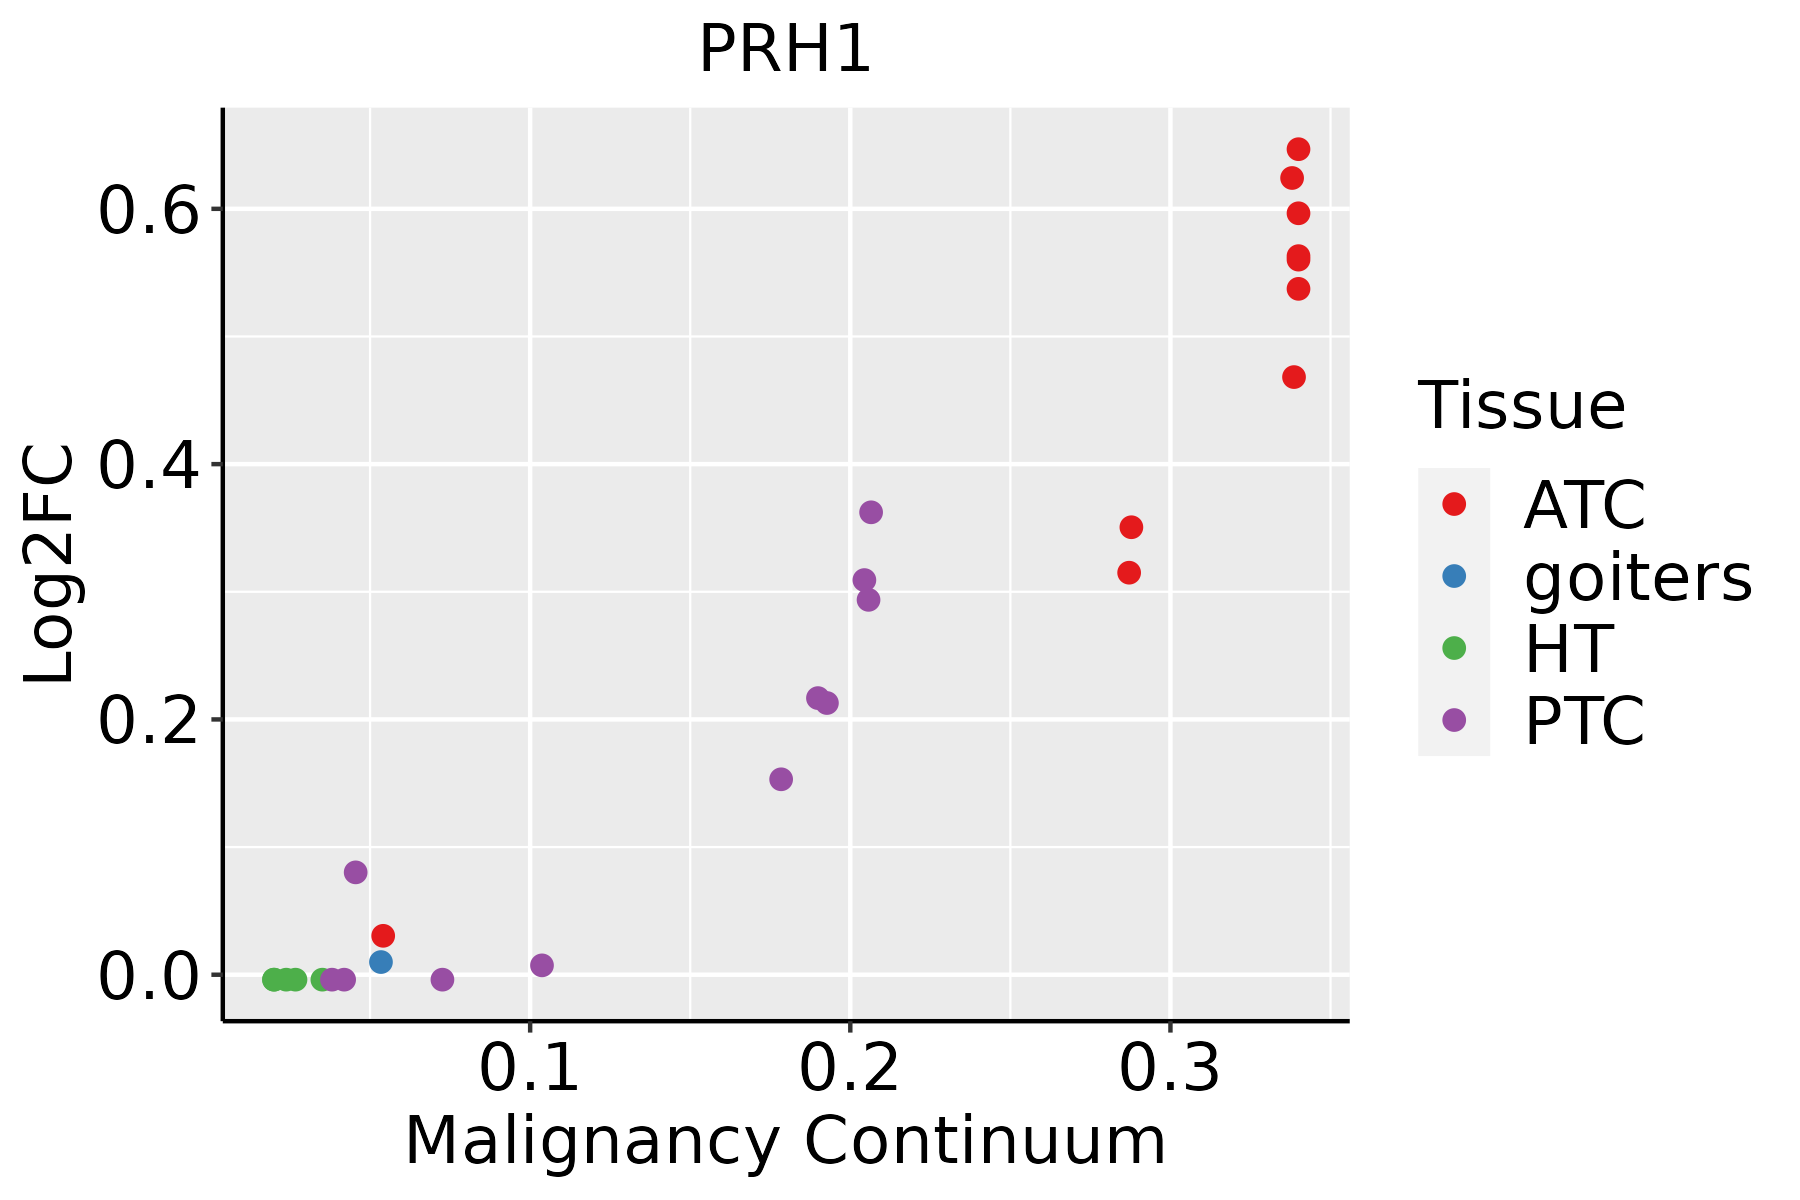 | ATC: Anaplastic thyroid cancer |
| HT: Hashimoto's thyroiditis | ||
| PTC: Papillary thyroid cancer |
| ∗log2FC in expression of this searched gene in stem-like cells from each diseased tissue sample relative to stem-like cells in normal samples in each tissue plotted against the malignancy continuum. Samples are colored based on if they are from different disease stage. |
Top |
Malignant transformation related pathway analysis |
| Find out the enriched GO biological processes and KEGG pathways involved in transition from healthy to precancer to cancer |
| Tissue | Disease Stage | Enriched GO biological Processes |
| Colorectum | AD |  |
| Colorectum | SER |  |
| Colorectum | MSS |  |
| Colorectum | MSI-H |  |
| Colorectum | FAP |  |
| ∗Top 15 enriched GO BP terms are showed in the bar plot of each disease state in each tissue. Each row represents a significant GO biological process which is colored according to the -log10(p.adjust). |
| Page: 1 2 3 4 5 6 7 8 9 |
| GO ID | Tissue | Disease Stage | Description | Gene Ratio | Bg Ratio | pvalue | p.adjust | Count |
| Page: 1 |
| Pathway ID | Tissue | Disease Stage | Description | Gene Ratio | Bg Ratio | pvalue | p.adjust | qvalue | Count |
| Page: 1 |
Top |
Cell-cell communication analysis |
| Identification of potential cell-cell interactions between two cell types and their ligand-receptor pairs for different disease states |
| Ligand | Receptor | LRpair | Pathway | Tissue | Disease Stage |
| Page: 1 |
Top |
Single-cell gene regulatory network inference analysis |
| Find out the significant the regulons (TFs) and the target genes of each regulon across cell types for different disease states |
| TF | Cell Type | Tissue | Disease Stage | Target Gene | RSS | Regulon Activity |
| ∗The dot plots of a searched regulon are shown for all cell subpopulations in each disease state of each tissue based on the regulon specific score inferred using pySCENIC and by calculating the average expression. |
| Page: 1 |
Top |
Somatic mutation of malignant transformation related genes |
| Annotation of somatic variants for genes involved in malignant transformation |
| Hugo Symbol | Variant Class | Variant Classification | dbSNP RS | HGVSc | HGVSp | HGVSp Short | SWISSPROT | BIOTYPE | SIFT | PolyPhen | Tumor Sample Barcode | Tissue | Histology | Sex | Age | Stage | Therapy Types | Drugs | Outcome |
| PRH1 | SNV | Missense_Mutation | rs758146734 | c.526N>T | p.Arg176Cys | p.R176C | protein_coding | deleterious_low_confidence(0.02) | possibly_damaging(0.542) | TCGA-AA-3950-01 | Colorectum | colon adenocarcinoma | Female | >=65 | I/II | Unknown | Unknown | SD | |
| PRH1 | SNV | Missense_Mutation | novel | c.123C>A | p.Phe41Leu | p.F41L | protein_coding | tolerated_low_confidence(0.66) | benign(0.015) | TCGA-A5-A0G2-01 | Endometrium | uterine corpus endometrioid carcinoma | Female | <65 | III/IV | Unknown | Unknown | SD | |
| PRH1 | SNV | Missense_Mutation | c.250C>T | p.Pro84Ser | p.P84S | protein_coding | tolerated_low_confidence(0.09) | unknown(0) | TCGA-AX-A06F-01 | Endometrium | uterine corpus endometrioid carcinoma | Female | <65 | III/IV | Chemotherapy | carboplatin | SD | ||
| PRH1 | SNV | Missense_Mutation | c.368N>A | p.Pro123His | p.P123H | protein_coding | deleterious_low_confidence(0.01) | benign(0.2) | TCGA-D1-A103-01 | Endometrium | uterine corpus endometrioid carcinoma | Female | >=65 | I/II | Unknown | Unknown | SD | ||
| PRH1 | SNV | Missense_Mutation | rs372138349 | c.412N>T | p.His138Tyr | p.H138Y | protein_coding | tolerated_low_confidence(0.52) | benign(0.06) | TCGA-05-4403-01 | Lung | lung adenocarcinoma | Male | >=65 | I/II | Unknown | Unknown | SD | |
| PRH1 | SNV | Missense_Mutation | novel | c.456N>T | p.Gln152His | p.Q152H | protein_coding | deleterious_low_confidence(0) | possibly_damaging(0.452) | TCGA-49-6744-01 | Lung | lung adenocarcinoma | Female | <65 | I/II | Chemotherapy | unknown | SD | |
| PRH1 | SNV | Missense_Mutation | c.44N>T | p.Ser15Leu | p.S15L | protein_coding | deleterious_low_confidence(0.01) | probably_damaging(0.958) | TCGA-50-6590-01 | Lung | lung adenocarcinoma | Female | >=65 | I/II | Chemotherapy | paclitaxel | CR | ||
| PRH1 | SNV | Missense_Mutation | c.530N>T | p.Pro177Leu | p.P177L | protein_coding | deleterious_low_confidence(0) | benign(0.373) | TCGA-56-6546-01 | Lung | lung squamous cell carcinoma | Male | >=65 | I/II | Unknown | Unknown | SD | ||
| PRH1 | SNV | Missense_Mutation | novel | c.470A>C | p.Gln157Pro | p.Q157P | protein_coding | tolerated_low_confidence(0.14) | possibly_damaging(0.702) | TCGA-77-A5G3-01 | Lung | lung squamous cell carcinoma | Male | <65 | I/II | Unknown | Unknown | SD | |
| PRH1 | SNV | Missense_Mutation | rs762959146 | c.461N>A | p.Gly154Asp | p.G154D | protein_coding | deleterious_low_confidence(0) | probably_damaging(0.995) | TCGA-CX-7082-01 | Oral cavity | head & neck squamous cell carcinoma | Male | >=65 | I/II | Unknown | Unknown | SD |
| Page: 1 2 |
Top |
Related drugs of malignant transformation related genes |
| Identification of chemicals and drugs interact with genes involved in malignant transfromation |
| (DGIdb 4.0) |
| Entrez ID | Symbol | Category | Interaction Types | Drug Claim Name | Drug Name | PMIDs |
| Page: 1 |

Copyright 2023-Present -The University of Texas Health Science Center at Houston |