
|
|||||
|
 | |
| |
| |
| |
| |
| |
|
Gene: PRG4 |
Gene summary for PRG4 |
| Gene information | Species | Human | Gene symbol | PRG4 | Gene ID | 10216 |
| Gene name | proteoglycan 4 | |
| Gene Alias | CACP | |
| Cytomap | 1q31.1 | |
| Gene Type | protein-coding | GO ID | GO:0002376 | UniProtAcc | Q92954 |
Top |
Malignant transformation analysis |
| Identification of the aberrant gene expression in precancerous and cancerous lesions by comparing the gene expression of stem-like cells in diseased tissues with normal stem cells |
| Entrez ID | Symbol | Replicates | Species | Organ | Tissue | Adj P-value | Log2FC | Malignancy |
| 10216 | PRG4 | NAFLD1 | Human | Liver | NAFLD | 1.53e-03 | 3.30e-01 | -0.04 |
| 10216 | PRG4 | HCC1_Meng | Human | Liver | HCC | 2.67e-79 | 3.04e-01 | 0.0246 |
| 10216 | PRG4 | cirrhotic3 | Human | Liver | Cirrhotic | 7.74e-05 | 3.34e-01 | 0.0215 |
| 10216 | PRG4 | HCC2 | Human | Liver | HCC | 2.81e-72 | 6.87e+00 | 0.5341 |
| 10216 | PRG4 | Pt14.a | Human | Liver | HCC | 1.26e-06 | 2.67e-01 | 0.0169 |
| 10216 | PRG4 | S027 | Human | Liver | HCC | 3.63e-08 | 6.89e-01 | 0.2446 |
| 10216 | PRG4 | S028 | Human | Liver | HCC | 2.91e-25 | 1.00e+00 | 0.2503 |
| 10216 | PRG4 | S029 | Human | Liver | HCC | 1.79e-27 | 1.13e+00 | 0.2581 |
| 10216 | PRG4 | HTA12-23-1 | Human | Pancreas | PDAC | 8.83e-07 | 6.58e-01 | 0.3405 |
| 10216 | PRG4 | HTA12-25-1 | Human | Pancreas | PDAC | 3.56e-02 | 3.28e-01 | 0.313 |
| 10216 | PRG4 | HTA12-26-1 | Human | Pancreas | PDAC | 1.03e-14 | 7.48e-01 | 0.3728 |
| 10216 | PRG4 | HTA12-29-1 | Human | Pancreas | PDAC | 1.08e-04 | 1.96e-01 | 0.3722 |
| 10216 | PRG4 | HTA12-30-1 | Human | Pancreas | PDAC | 1.14e-02 | 8.14e-01 | 0.3671 |
| 10216 | PRG4 | HTA12-9-1 | Human | Pancreas | PDAC | 4.42e-05 | 4.11e-01 | 0.1532 |
| 10216 | PRG4 | HTA12-9-3 | Human | Pancreas | PDAC | 5.91e-13 | 1.20e+00 | 0.2045 |
| Page: 1 |
| Tissue | Expression Dynamics | Abbreviation |
| Liver | 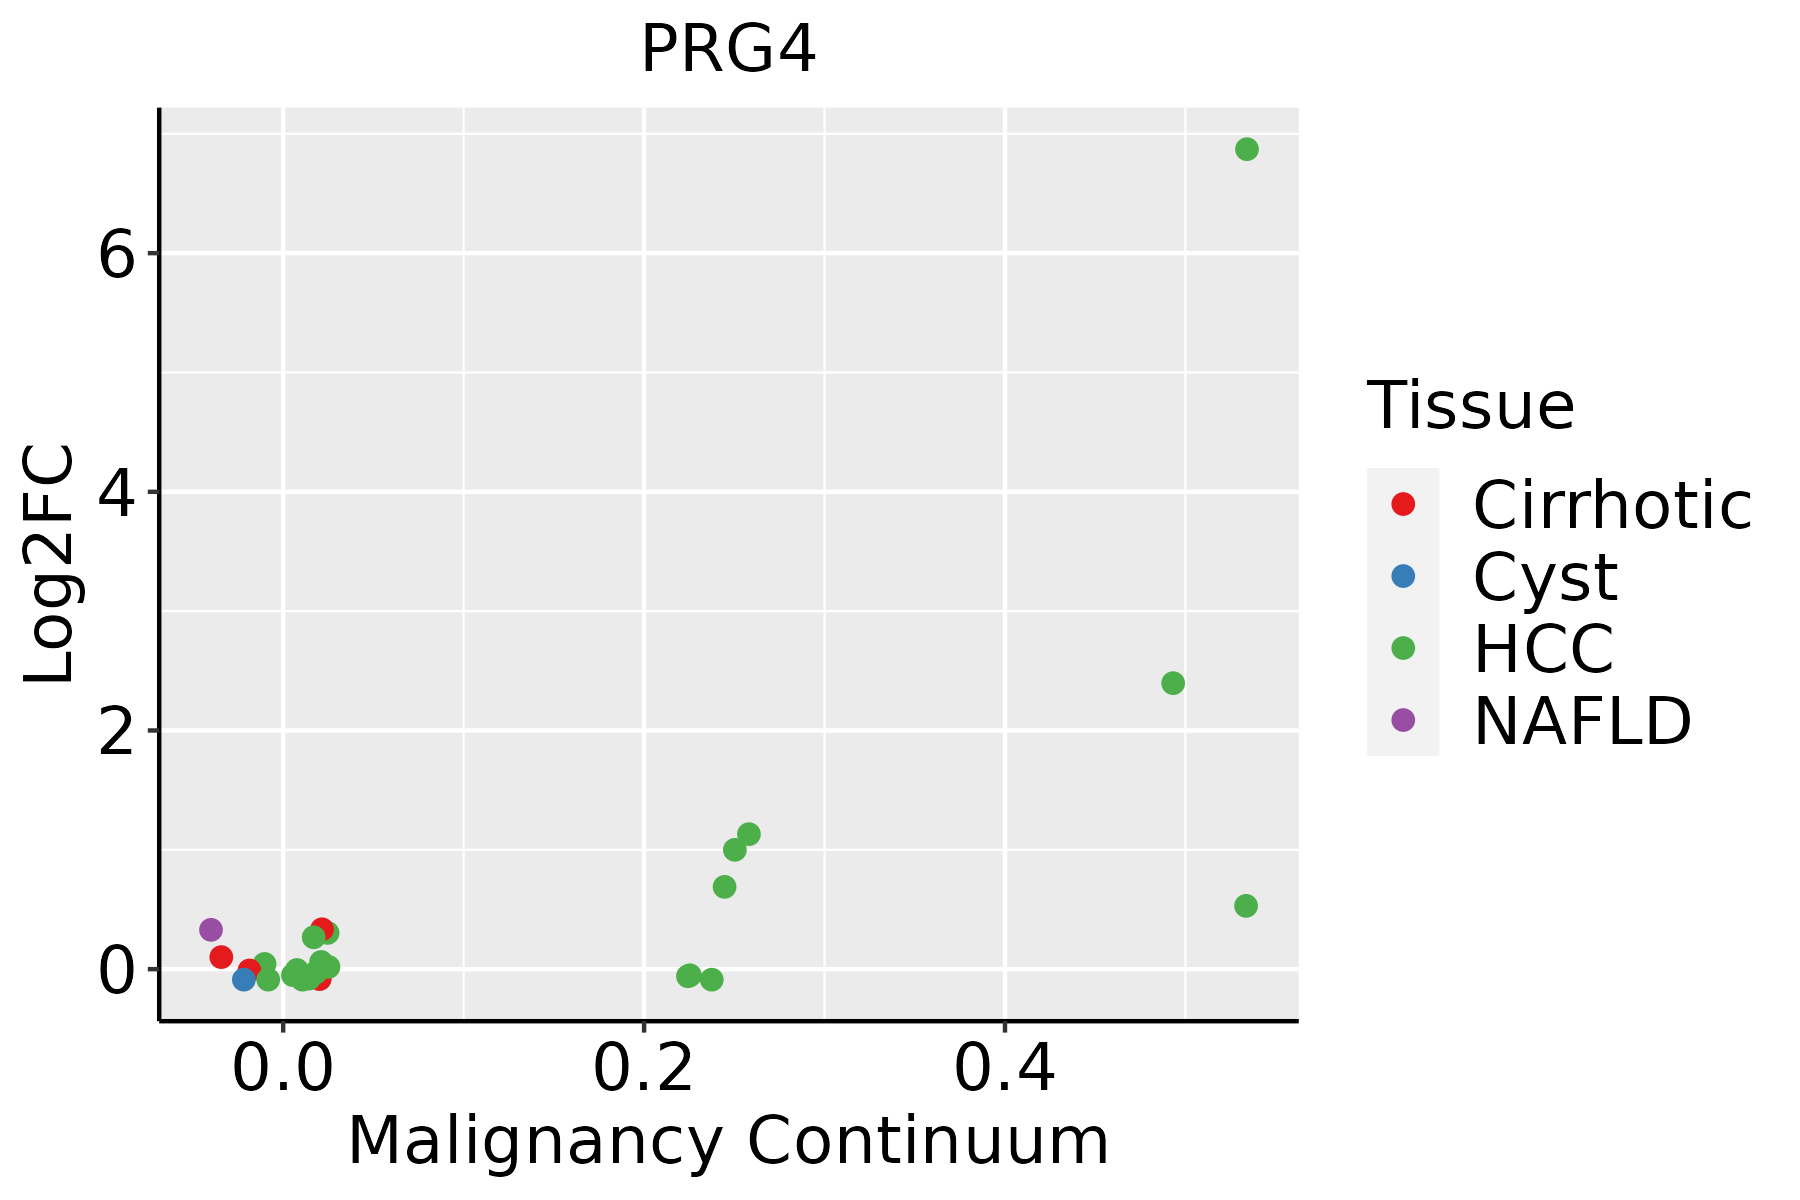 | HCC: Hepatocellular carcinoma |
| NAFLD: Non-alcoholic fatty liver disease |
| ∗log2FC in expression of this searched gene in stem-like cells from each diseased tissue sample relative to stem-like cells in normal samples in each tissue plotted against the malignancy continuum. Samples are colored based on if they are from different disease stage. |
Top |
Malignant transformation related pathway analysis |
| Find out the enriched GO biological processes and KEGG pathways involved in transition from healthy to precancer to cancer |
| Tissue | Disease Stage | Enriched GO biological Processes |
| Colorectum | AD |  |
| Colorectum | SER |  |
| Colorectum | MSS |  |
| Colorectum | MSI-H |  |
| Colorectum | FAP |  |
| ∗Top 15 enriched GO BP terms are showed in the bar plot of each disease state in each tissue. Each row represents a significant GO biological process which is colored according to the -log10(p.adjust). |
| Page: 1 2 3 4 5 6 7 8 9 |
| GO ID | Tissue | Disease Stage | Description | Gene Ratio | Bg Ratio | pvalue | p.adjust | Count |
| Page: 1 |
| Pathway ID | Tissue | Disease Stage | Description | Gene Ratio | Bg Ratio | pvalue | p.adjust | qvalue | Count |
| Page: 1 |
Top |
Cell-cell communication analysis |
| Identification of potential cell-cell interactions between two cell types and their ligand-receptor pairs for different disease states |
| Ligand | Receptor | LRpair | Pathway | Tissue | Disease Stage |
| Page: 1 |
Top |
Single-cell gene regulatory network inference analysis |
| Find out the significant the regulons (TFs) and the target genes of each regulon across cell types for different disease states |
| TF | Cell Type | Tissue | Disease Stage | Target Gene | RSS | Regulon Activity |
| ∗The dot plots of a searched regulon are shown for all cell subpopulations in each disease state of each tissue based on the regulon specific score inferred using pySCENIC and by calculating the average expression. |
| Page: 1 |
Top |
Somatic mutation of malignant transformation related genes |
| Annotation of somatic variants for genes involved in malignant transformation |
| Hugo Symbol | Variant Class | Variant Classification | dbSNP RS | HGVSc | HGVSp | HGVSp Short | SWISSPROT | BIOTYPE | SIFT | PolyPhen | Tumor Sample Barcode | Tissue | Histology | Sex | Age | Stage | Therapy Types | Drugs | Outcome |
| PRG4 | SNV | Missense_Mutation | novel | c.3982N>G | p.Gln1328Glu | p.Q1328E | Q92954 | protein_coding | tolerated(0.07) | probably_damaging(0.98) | TCGA-3C-AALI-01 | Breast | breast invasive carcinoma | Female | <65 | I/II | Unspecific | Poly E | Complete Response |
| PRG4 | SNV | Missense_Mutation | rs780320498 | c.3047N>T | p.Ala1016Val | p.A1016V | Q92954 | protein_coding | tolerated(1) | benign(0.001) | TCGA-A2-A3XV-01 | Breast | breast invasive carcinoma | Female | <65 | I/II | Chemotherapy | carboplatin | CR |
| PRG4 | SNV | Missense_Mutation | rs201070519 | c.1543N>G | p.Ser515Ala | p.S515A | Q92954 | protein_coding | tolerated(1) | benign(0) | TCGA-C8-A12X-01 | Breast | breast invasive carcinoma | Female | <65 | I/II | Unknown | Unknown | SD |
| PRG4 | SNV | Missense_Mutation | c.26N>C | p.Tyr9Ser | p.Y9S | Q92954 | protein_coding | tolerated(0.53) | benign(0.234) | TCGA-C8-A27B-01 | Breast | breast invasive carcinoma | Female | <65 | I/II | Chemotherapy | 5-fluorouracil | CR | |
| PRG4 | SNV | Missense_Mutation | novel | c.1079N>T | p.Ser360Phe | p.S360F | Q92954 | protein_coding | deleterious(0) | benign(0.169) | TCGA-E2-A2P6-01 | Breast | breast invasive carcinoma | Female | >=65 | I/II | Hormone Therapy | anastrozole | SD |
| PRG4 | insertion | Nonsense_Mutation | novel | c.687_688insCACCCTTGGGCTTTGTAGTCCACATGTGGGGCAGCTGCTATGGGAAA | p.Asp230HisfsTer6 | p.D230Hfs*6 | Q92954 | protein_coding | TCGA-A2-A0CP-01 | Breast | breast invasive carcinoma | Female | <65 | I/II | Chemotherapy | cytoxan | SD | ||
| PRG4 | insertion | Frame_Shift_Ins | novel | c.1414_1415insCC | p.Lys472ThrfsTer441 | p.K472Tfs*441 | Q92954 | protein_coding | TCGA-A2-A0ST-01 | Breast | breast invasive carcinoma | Female | <65 | I/II | Chemotherapy | adriamycin | SD | ||
| PRG4 | deletion | Frame_Shift_Del | novel | c.1416_1417delNN | p.Glu473AlafsTer165 | p.E473Afs*165 | Q92954 | protein_coding | TCGA-A2-A0ST-01 | Breast | breast invasive carcinoma | Female | <65 | I/II | Chemotherapy | adriamycin | SD | ||
| PRG4 | deletion | In_Frame_Del | rs750254259 | c.1032_1055delNNNNNNNNNNNNNNNNNNNNNNNN | p.Thr351_Pro358del | p.T351_P358del | Q92954 | protein_coding | TCGA-AC-A2BK-01 | Breast | breast invasive carcinoma | Female | >=65 | III/IV | Chemotherapy | cytoxan | CR | ||
| PRG4 | insertion | Frame_Shift_Ins | novel | c.1143_1144insTTCCATGTTTTCTCTTCTAGACTGA | p.Ala382PhefsTer265 | p.A382Ffs*265 | Q92954 | protein_coding | TCGA-AO-A03R-01 | Breast | breast invasive carcinoma | Female | <65 | I/II | Chemotherapy | doxorubicin | SD |
| Page: 1 2 3 4 5 6 7 8 9 10 11 12 13 14 15 16 17 |
Top |
Related drugs of malignant transformation related genes |
| Identification of chemicals and drugs interact with genes involved in malignant transfromation |
| (DGIdb 4.0) |
| Entrez ID | Symbol | Category | Interaction Types | Drug Claim Name | Drug Name | PMIDs |
| Page: 1 |

Copyright 2023-Present -The University of Texas Health Science Center at Houston |