| Tissue | Expression Dynamics | Abbreviation |
| Colorectum (GSE201348) | 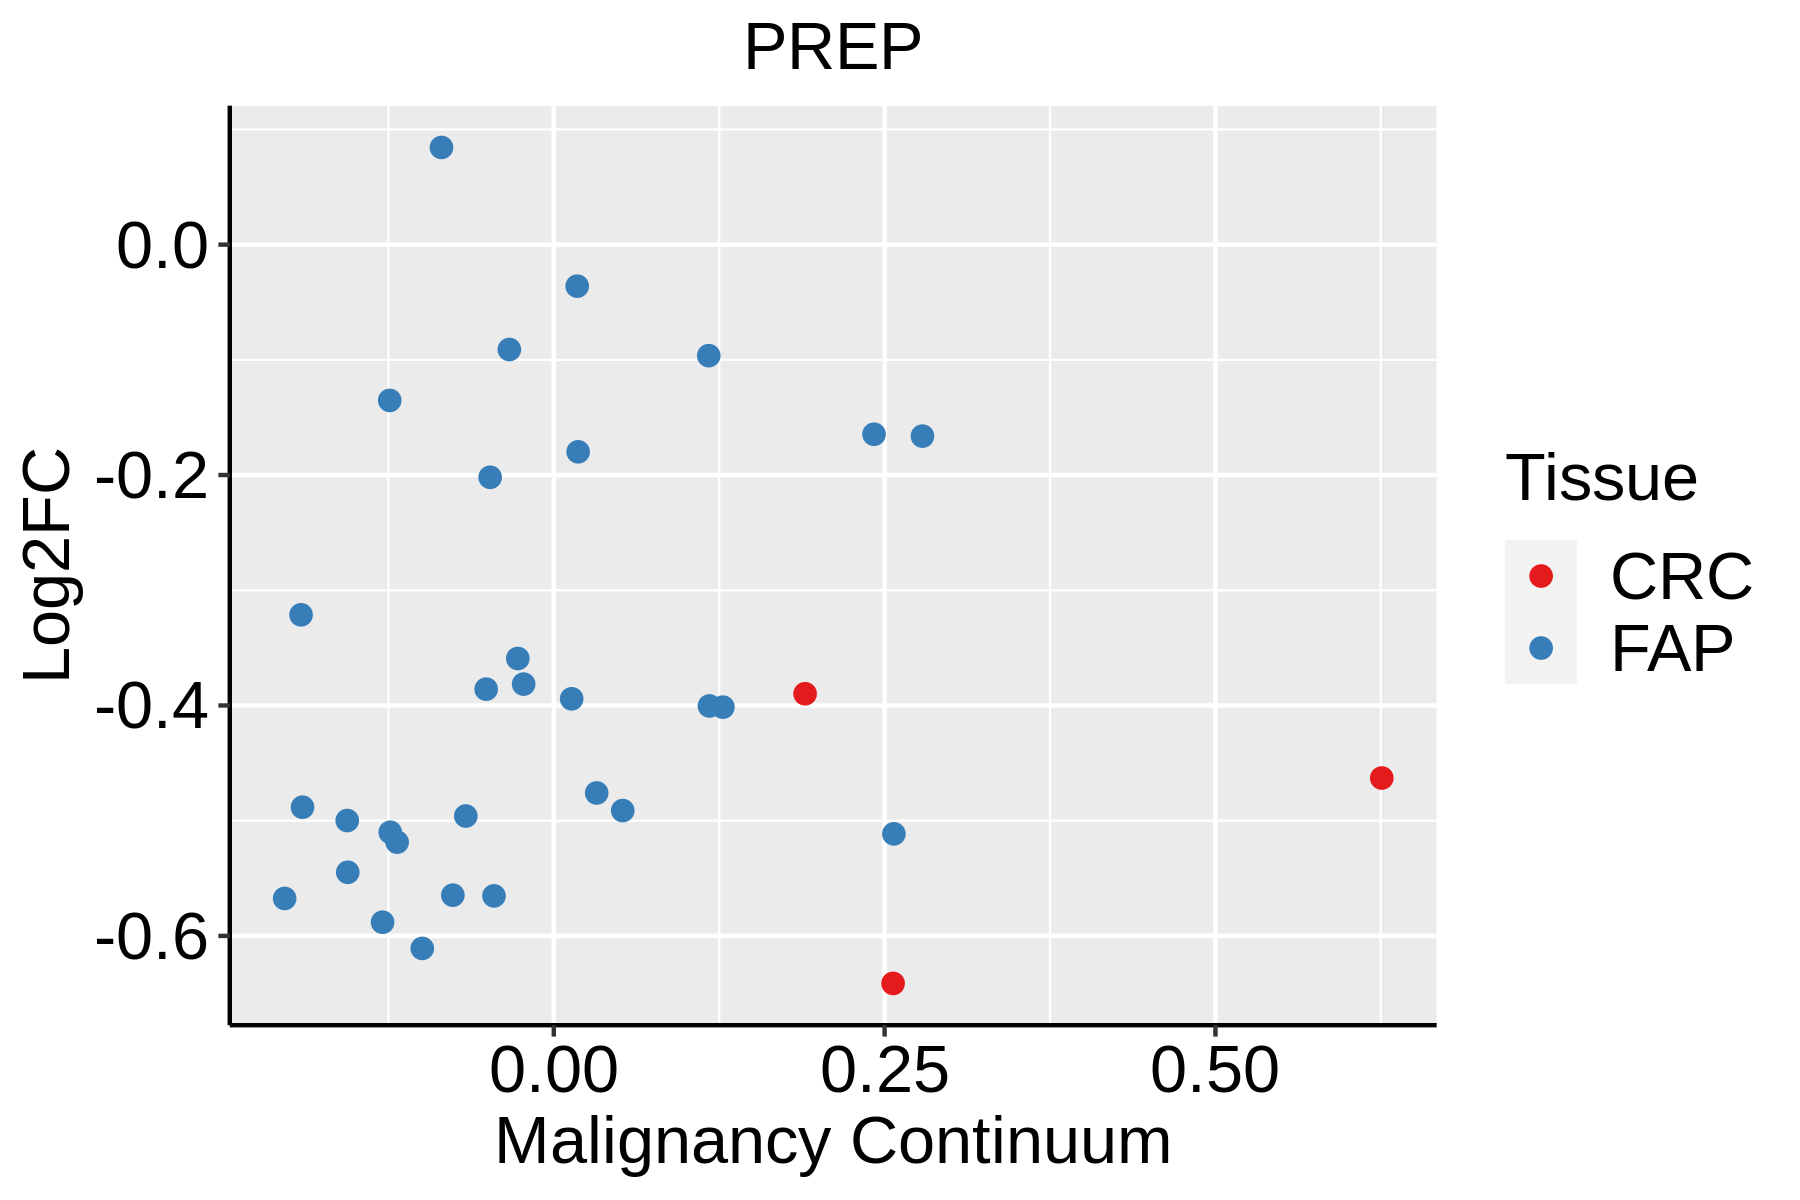 | FAP: Familial adenomatous polyposis |
| CRC: Colorectal cancer |
| Colorectum (HTA11) |  | AD: Adenomas |
| SER: Sessile serrated lesions |
| MSI-H: Microsatellite-high colorectal cancer |
| MSS: Microsatellite stable colorectal cancer |
| Esophagus | 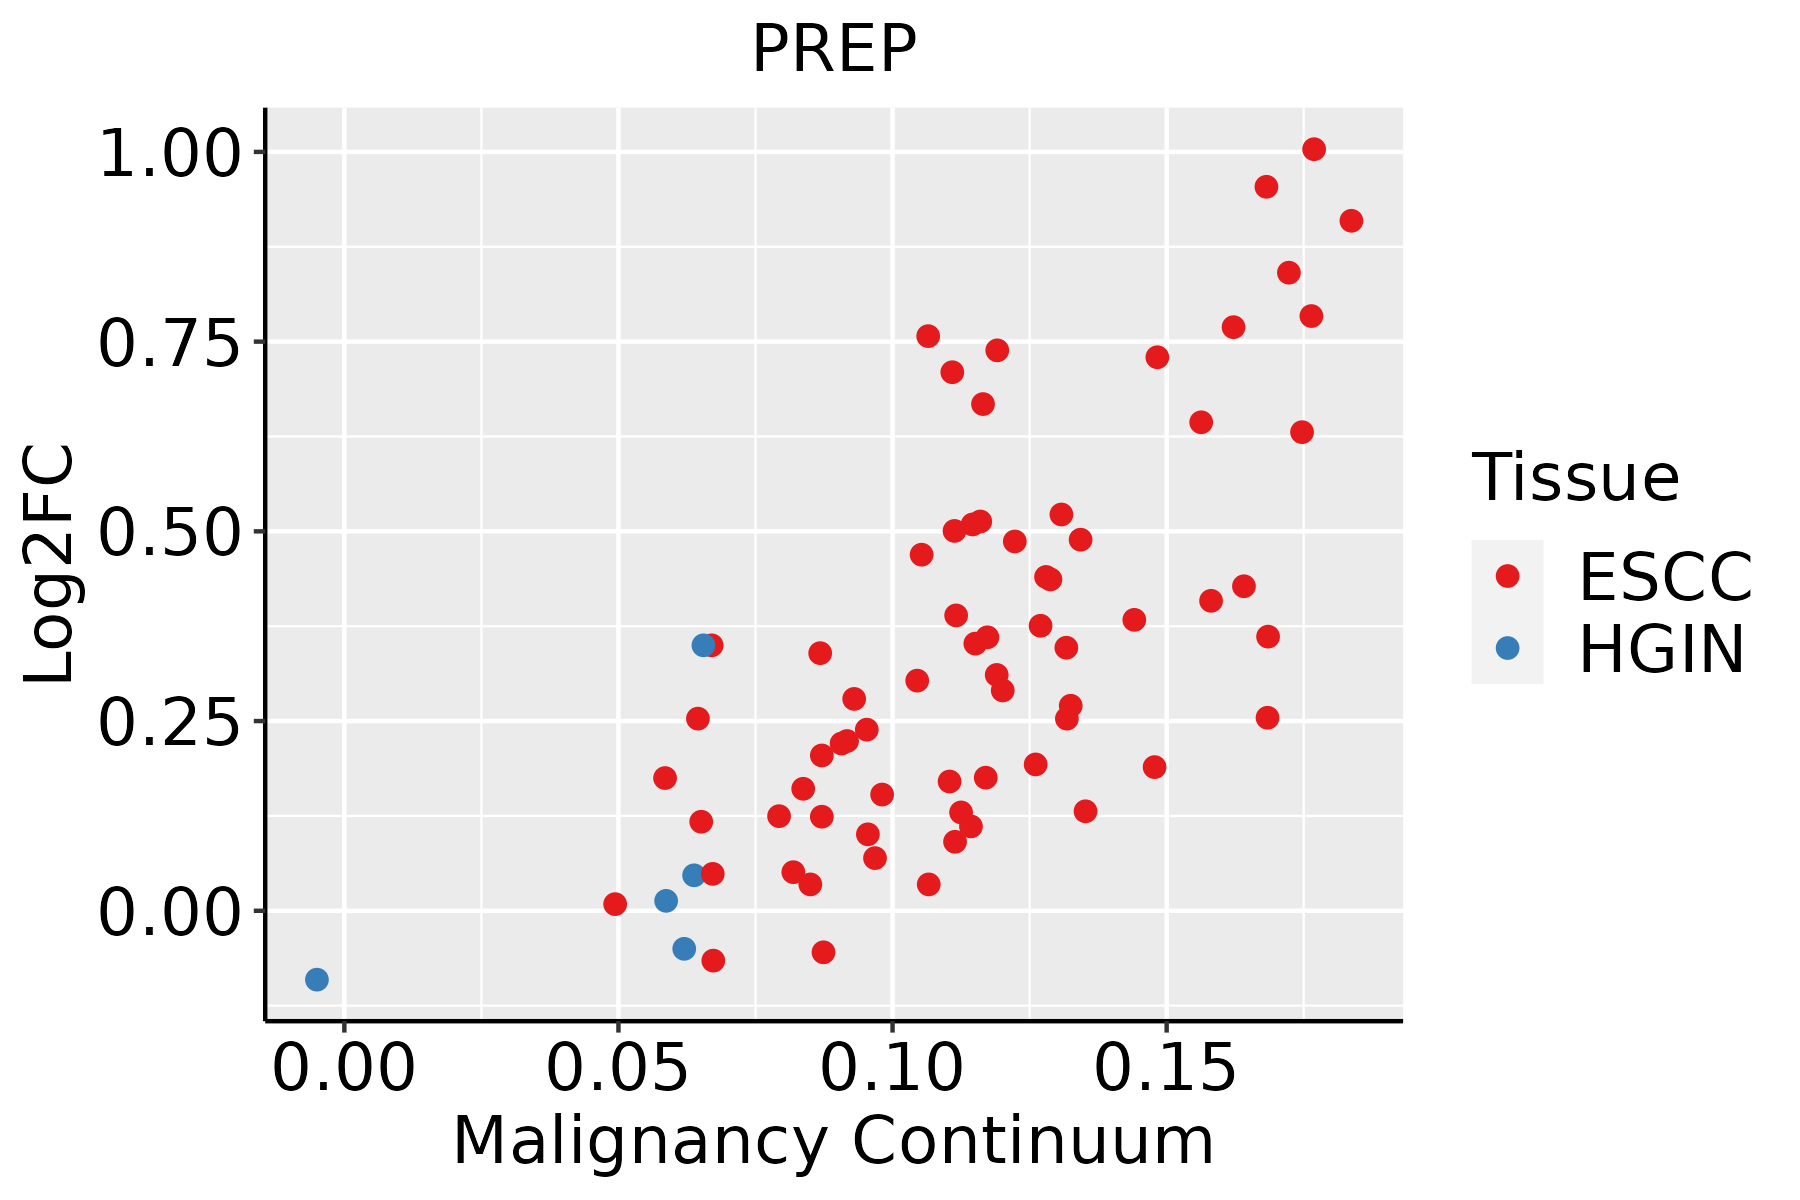 | ESCC: Esophageal squamous cell carcinoma |
| HGIN: High-grade intraepithelial neoplasias |
| LGIN: Low-grade intraepithelial neoplasias |
| Liver | 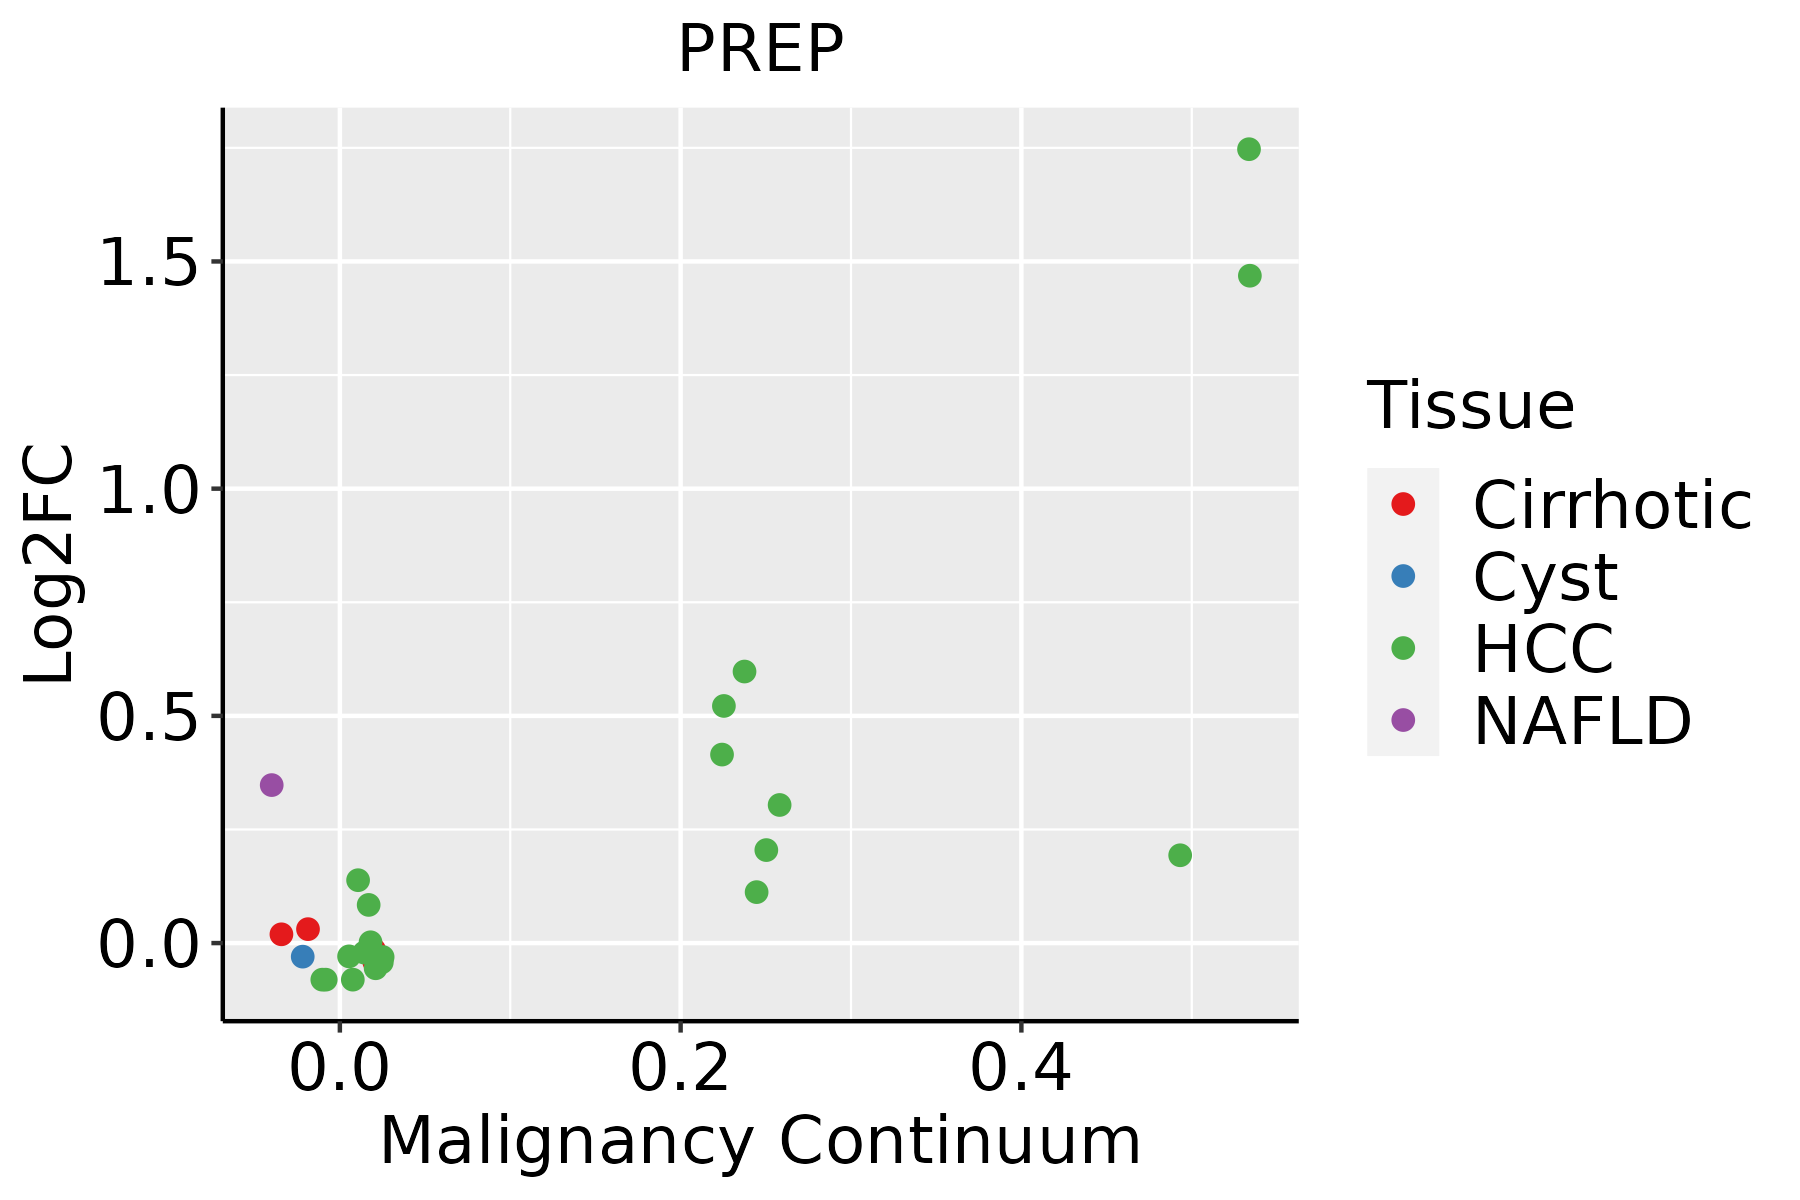 | HCC: Hepatocellular carcinoma |
| NAFLD: Non-alcoholic fatty liver disease |
| Oral Cavity |  | EOLP: Erosive Oral lichen planus |
| LP: leukoplakia |
| NEOLP: Non-erosive oral lichen planus |
| OSCC: Oral squamous cell carcinoma |
| Skin | 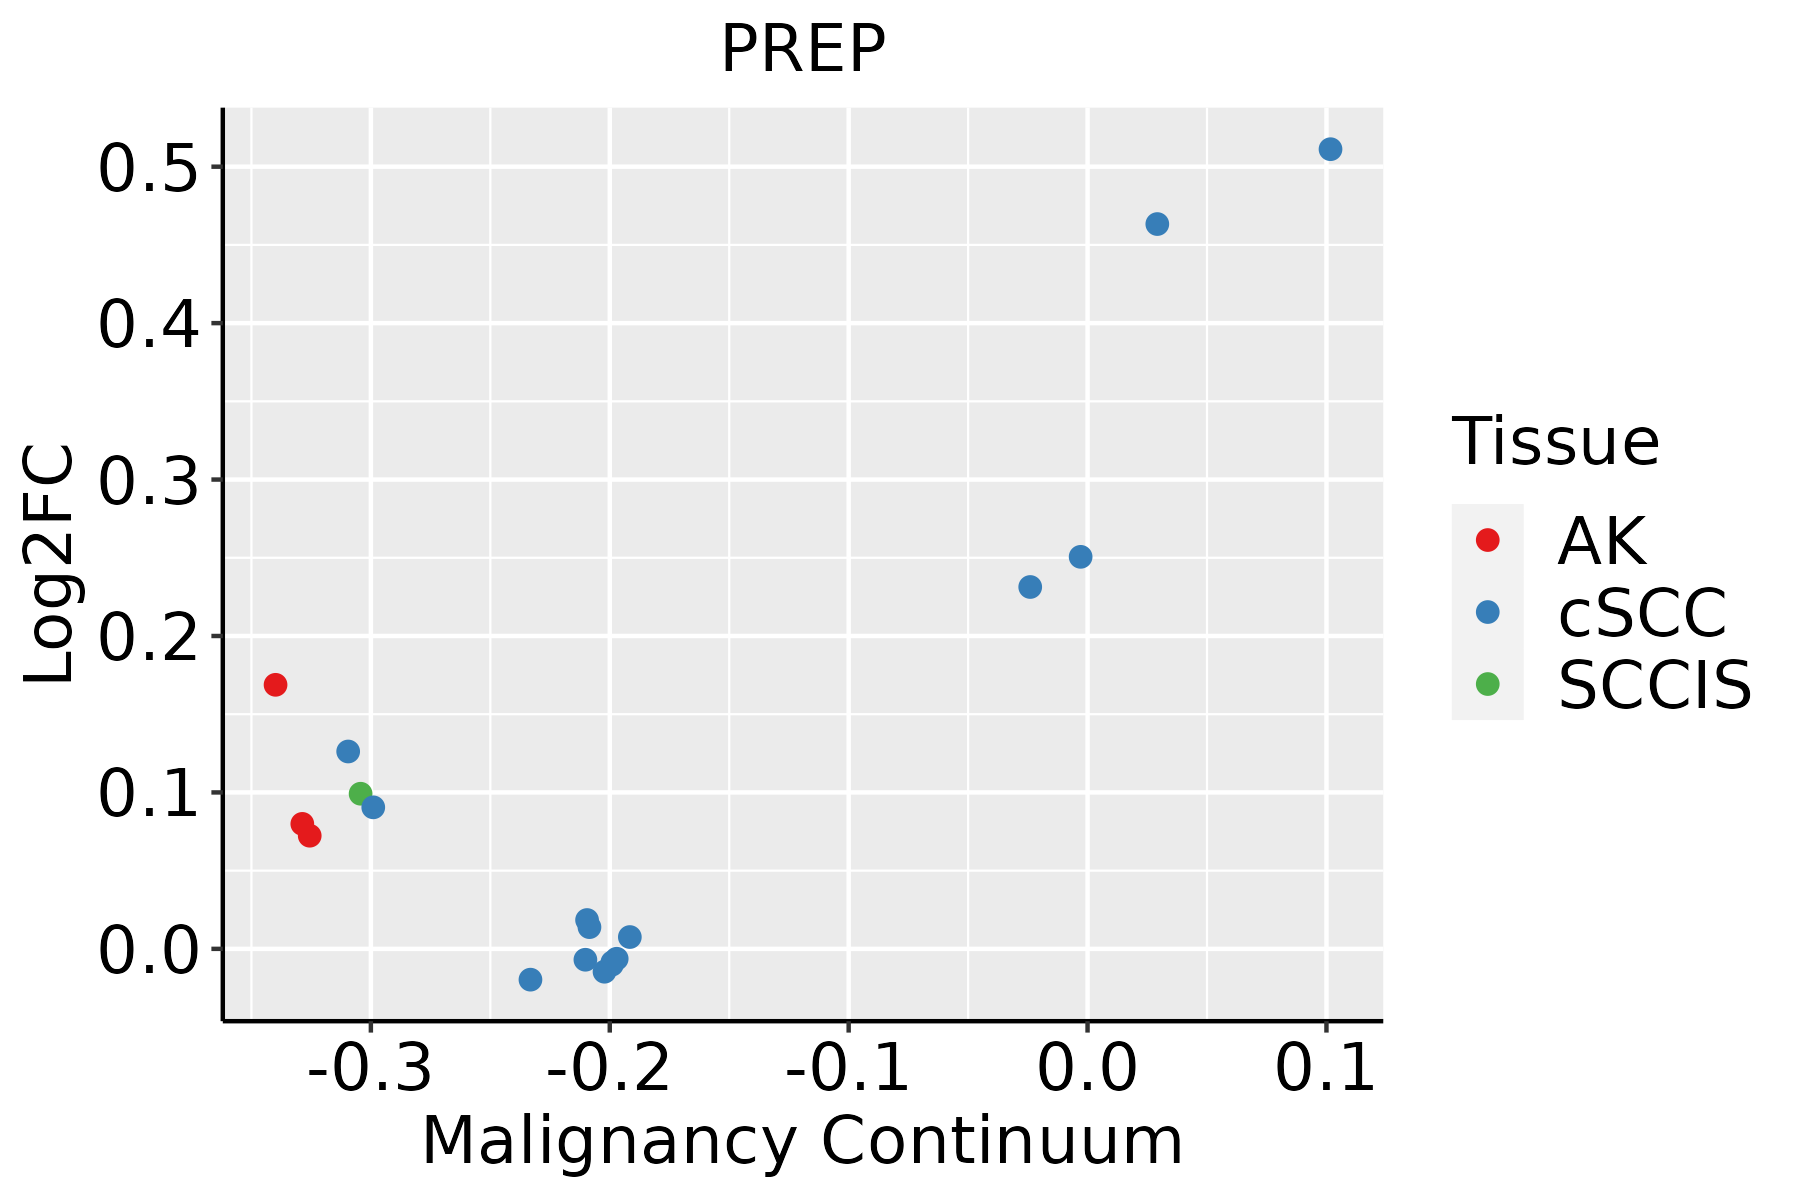 | AK: Actinic keratosis |
| cSCC: Cutaneous squamous cell carcinoma |
| SCCIS:squamous cell carcinoma in situ |
| GO ID | Tissue | Disease Stage | Description | Gene Ratio | Bg Ratio | pvalue | p.adjust | Count |
| GO:004819318 | Esophagus | ESCC | Golgi vesicle transport | 231/8552 | 296/18723 | 1.82e-30 | 9.63e-28 | 231 |
| GO:001619715 | Esophagus | ESCC | endosomal transport | 168/8552 | 230/18723 | 2.28e-17 | 1.93e-15 | 168 |
| GO:0090150110 | Esophagus | ESCC | establishment of protein localization to membrane | 182/8552 | 260/18723 | 1.27e-15 | 8.19e-14 | 182 |
| GO:0072659110 | Esophagus | ESCC | protein localization to plasma membrane | 193/8552 | 284/18723 | 1.95e-14 | 1.03e-12 | 193 |
| GO:001648210 | Esophagus | ESCC | cytosolic transport | 124/8552 | 168/18723 | 9.69e-14 | 4.69e-12 | 124 |
| GO:199077819 | Esophagus | ESCC | protein localization to cell periphery | 217/8552 | 333/18723 | 4.08e-13 | 1.88e-11 | 217 |
| GO:000689215 | Esophagus | ESCC | post-Golgi vesicle-mediated transport | 82/8552 | 104/18723 | 4.00e-12 | 1.55e-10 | 82 |
| GO:009887615 | Esophagus | ESCC | vesicle-mediated transport to the plasma membrane | 99/8552 | 136/18723 | 1.13e-10 | 3.39e-09 | 99 |
| GO:000689315 | Esophagus | ESCC | Golgi to plasma membrane transport | 48/8552 | 60/18723 | 5.11e-08 | 9.16e-07 | 48 |
| GO:004300114 | Esophagus | ESCC | Golgi to plasma membrane protein transport | 34/8552 | 40/18723 | 3.00e-07 | 4.27e-06 | 34 |
| GO:00421477 | Esophagus | ESCC | retrograde transport, endosome to Golgi | 63/8552 | 91/18723 | 4.58e-06 | 4.87e-05 | 63 |
| GO:006195114 | Esophagus | ESCC | establishment of protein localization to plasma membrane | 44/8552 | 60/18723 | 1.25e-05 | 1.15e-04 | 44 |
| GO:004819311 | Liver | Cirrhotic | Golgi vesicle transport | 153/4634 | 296/18723 | 1.02e-23 | 6.43e-21 | 153 |
| GO:00901507 | Liver | Cirrhotic | establishment of protein localization to membrane | 123/4634 | 260/18723 | 1.85e-15 | 2.15e-13 | 123 |
| GO:199077811 | Liver | Cirrhotic | protein localization to cell periphery | 135/4634 | 333/18723 | 1.18e-10 | 6.21e-09 | 135 |
| GO:007265911 | Liver | Cirrhotic | protein localization to plasma membrane | 119/4634 | 284/18723 | 1.30e-10 | 6.80e-09 | 119 |
| GO:004300111 | Liver | Cirrhotic | Golgi to plasma membrane protein transport | 27/4634 | 40/18723 | 1.43e-08 | 5.36e-07 | 27 |
| GO:001648211 | Liver | Cirrhotic | cytosolic transport | 74/4634 | 168/18723 | 3.34e-08 | 1.12e-06 | 74 |
| GO:000689211 | Liver | Cirrhotic | post-Golgi vesicle-mediated transport | 51/4634 | 104/18723 | 7.12e-08 | 2.15e-06 | 51 |
| GO:001619711 | Liver | Cirrhotic | endosomal transport | 93/4634 | 230/18723 | 1.01e-07 | 2.93e-06 | 93 |
| Hugo Symbol | Variant Class | Variant Classification | dbSNP RS | HGVSc | HGVSp | HGVSp Short | SWISSPROT | BIOTYPE | SIFT | PolyPhen | Tumor Sample Barcode | Tissue | Histology | Sex | Age | Stage | Therapy Types | Drugs | Outcome |
| PREP | SNV | Missense_Mutation | novel | c.1915N>A | p.Asp639Asn | p.D639N | P48147 | protein_coding | deleterious(0) | probably_damaging(0.976) | TCGA-5L-AAT1-01 | Breast | breast invasive carcinoma | Female | <65 | III/IV | Hormone Therapy | letrozol | SD |
| PREP | SNV | Missense_Mutation | novel | c.130N>A | p.Glu44Lys | p.E44K | P48147 | protein_coding | tolerated(0.21) | benign(0.021) | TCGA-5L-AAT1-01 | Breast | breast invasive carcinoma | Female | <65 | III/IV | Hormone Therapy | letrozol | SD |
| PREP | SNV | Missense_Mutation | | c.1956N>G | p.Phe652Leu | p.F652L | P48147 | protein_coding | tolerated(0.87) | benign(0.02) | TCGA-A8-A06Q-01 | Breast | breast invasive carcinoma | Female | <65 | III/IV | Unknown | Unknown | SD |
| PREP | SNV | Missense_Mutation | | c.1582G>A | p.Asp528Asn | p.D528N | P48147 | protein_coding | tolerated(0.08) | benign(0.434) | TCGA-A8-A092-01 | Breast | breast invasive carcinoma | Female | <65 | III/IV | Chemotherapy | paclitaxel | CR |
| PREP | SNV | Missense_Mutation | | c.62N>T | p.Gly21Val | p.G21V | P48147 | protein_coding | deleterious(0) | probably_damaging(0.998) | TCGA-A8-A09C-01 | Breast | breast invasive carcinoma | Female | >=65 | I/II | Unknown | Unknown | SD |
| PREP | SNV | Missense_Mutation | novel | c.58N>T | p.His20Tyr | p.H20Y | P48147 | protein_coding | deleterious(0.02) | possibly_damaging(0.6) | TCGA-AN-A0XW-01 | Breast | breast invasive carcinoma | Female | <65 | III/IV | Unknown | Unknown | SD |
| PREP | SNV | Missense_Mutation | | c.1301N>G | p.Asp434Gly | p.D434G | P48147 | protein_coding | tolerated(0.29) | benign(0.013) | TCGA-BH-A18G-01 | Breast | breast invasive carcinoma | Female | >=65 | I/II | Unknown | Unknown | SD |
| PREP | SNV | Missense_Mutation | | c.715G>A | p.Glu239Lys | p.E239K | P48147 | protein_coding | tolerated(0.25) | benign(0.081) | TCGA-C8-A1HF-01 | Breast | breast invasive carcinoma | Female | <65 | I/II | Unknown | Unknown | SD |
| PREP | SNV | Missense_Mutation | | c.34G>C | p.Asp12His | p.D12H | P48147 | protein_coding | deleterious(0) | probably_damaging(0.937) | TCGA-D8-A1JA-01 | Breast | breast invasive carcinoma | Female | <65 | III/IV | Chemotherapy | adriamycin | PD |
| PREP | insertion | In_Frame_Ins | novel | c.285_286insCTTAGAATAATAAACATTTGTTTTTGCTATGAGCCT | p.Gln95_Asn96insLeuArgIleIleAsnIleCysPheCysTyrGluPro | p.Q95_N96insLRIINICFCYEP | P48147 | protein_coding | | | TCGA-A8-A097-01 | Breast | breast invasive carcinoma | Female | >=65 | I/II | Hormone Therapy | tamoxiphen | SD |
| Entrez ID | Symbol | Category | Interaction Types | Drug Claim Name | Drug Name | PMIDs |
| 5550 | PREP | PROTEASE, ENZYME, DRUGGABLE GENOME | inhibitor | 405560408 | | |
| 5550 | PREP | PROTEASE, ENZYME, DRUGGABLE GENOME | | ONO-1603 | CHEMBL1087333 | |
| 5550 | PREP | PROTEASE, ENZYME, DRUGGABLE GENOME | | STZ | STREPTOZOCIN | 8190911 |
| 5550 | PREP | PROTEASE, ENZYME, DRUGGABLE GENOME | | S-17092-1 | | |
| 5550 | PREP | PROTEASE, ENZYME, DRUGGABLE GENOME | inhibitor | 252166765 | | |
| 5550 | PREP | PROTEASE, ENZYME, DRUGGABLE GENOME | | ALV-003 | LATIGLUTENASE | |
| 5550 | PREP | PROTEASE, ENZYME, DRUGGABLE GENOME | inhibitor | 178103179 | | |


