
|
|||||
|
 | |
| |
| |
| |
| |
| |
|
Gene: PRELID3B |
Gene summary for PRELID3B |
| Gene information | Species | Human | Gene symbol | PRELID3B | Gene ID | 51012 |
| Gene name | PRELI domain containing 3B | |
| Gene Alias | C20orf45 | |
| Cytomap | 20q13.32 | |
| Gene Type | protein-coding | GO ID | GO:0006810 | UniProtAcc | Q9Y3B1 |
Top |
Malignant transformation analysis |
| Identification of the aberrant gene expression in precancerous and cancerous lesions by comparing the gene expression of stem-like cells in diseased tissues with normal stem cells |
| Entrez ID | Symbol | Replicates | Species | Organ | Tissue | Adj P-value | Log2FC | Malignancy |
| 51012 | PRELID3B | HTA11_3410_2000001011 | Human | Colorectum | AD | 4.31e-02 | 1.00e-01 | 0.0155 |
| 51012 | PRELID3B | HTA11_2487_2000001011 | Human | Colorectum | SER | 7.09e-04 | 3.67e-01 | -0.1808 |
| 51012 | PRELID3B | HTA11_1938_2000001011 | Human | Colorectum | AD | 1.43e-11 | 5.82e-01 | -0.0811 |
| 51012 | PRELID3B | HTA11_78_2000001011 | Human | Colorectum | AD | 8.78e-09 | 4.62e-01 | -0.1088 |
| 51012 | PRELID3B | HTA11_347_2000001011 | Human | Colorectum | AD | 4.95e-27 | 7.66e-01 | -0.1954 |
| 51012 | PRELID3B | HTA11_1391_2000001011 | Human | Colorectum | AD | 9.73e-08 | 4.26e-01 | -0.059 |
| 51012 | PRELID3B | HTA11_5212_2000001011 | Human | Colorectum | AD | 1.10e-03 | 2.85e-01 | -0.2061 |
| 51012 | PRELID3B | HTA11_7862_2000001011 | Human | Colorectum | AD | 5.19e-08 | 5.23e-01 | -0.0179 |
| 51012 | PRELID3B | HTA11_866_3004761011 | Human | Colorectum | AD | 3.70e-10 | 4.85e-01 | 0.096 |
| 51012 | PRELID3B | HTA11_10623_2000001011 | Human | Colorectum | AD | 1.48e-02 | 3.36e-01 | -0.0177 |
| 51012 | PRELID3B | HTA11_6801_2000001011 | Human | Colorectum | SER | 9.77e-09 | 9.37e-01 | 0.0171 |
| 51012 | PRELID3B | HTA11_7469_2000001011 | Human | Colorectum | AD | 5.12e-07 | 7.13e-01 | -0.0124 |
| 51012 | PRELID3B | HTA11_6818_2000001021 | Human | Colorectum | AD | 4.10e-03 | 1.48e-01 | 0.0588 |
| 51012 | PRELID3B | HTA11_99999970781_79442 | Human | Colorectum | MSS | 1.03e-13 | 6.16e-01 | 0.294 |
| 51012 | PRELID3B | HTA11_99999965062_69753 | Human | Colorectum | MSI-H | 2.01e-02 | 8.09e-01 | 0.3487 |
| 51012 | PRELID3B | HTA11_99999965104_69814 | Human | Colorectum | MSS | 2.93e-12 | 6.70e-01 | 0.281 |
| 51012 | PRELID3B | HTA11_99999971662_82457 | Human | Colorectum | MSS | 1.64e-40 | 1.23e+00 | 0.3859 |
| 51012 | PRELID3B | HTA11_99999973899_84307 | Human | Colorectum | MSS | 6.36e-07 | 4.46e-01 | 0.2585 |
| 51012 | PRELID3B | A015-C-104 | Human | Colorectum | FAP | 1.71e-02 | -1.17e-01 | -0.1899 |
| 51012 | PRELID3B | LZE2T | Human | Esophagus | ESCC | 1.70e-05 | 2.80e-01 | 0.082 |
| Page: 1 2 3 4 5 6 7 |
| Tissue | Expression Dynamics | Abbreviation |
| Colorectum (GSE201348) |  | FAP: Familial adenomatous polyposis |
| CRC: Colorectal cancer | ||
| Colorectum (HTA11) |  | AD: Adenomas |
| SER: Sessile serrated lesions | ||
| MSI-H: Microsatellite-high colorectal cancer | ||
| MSS: Microsatellite stable colorectal cancer | ||
| Esophagus | 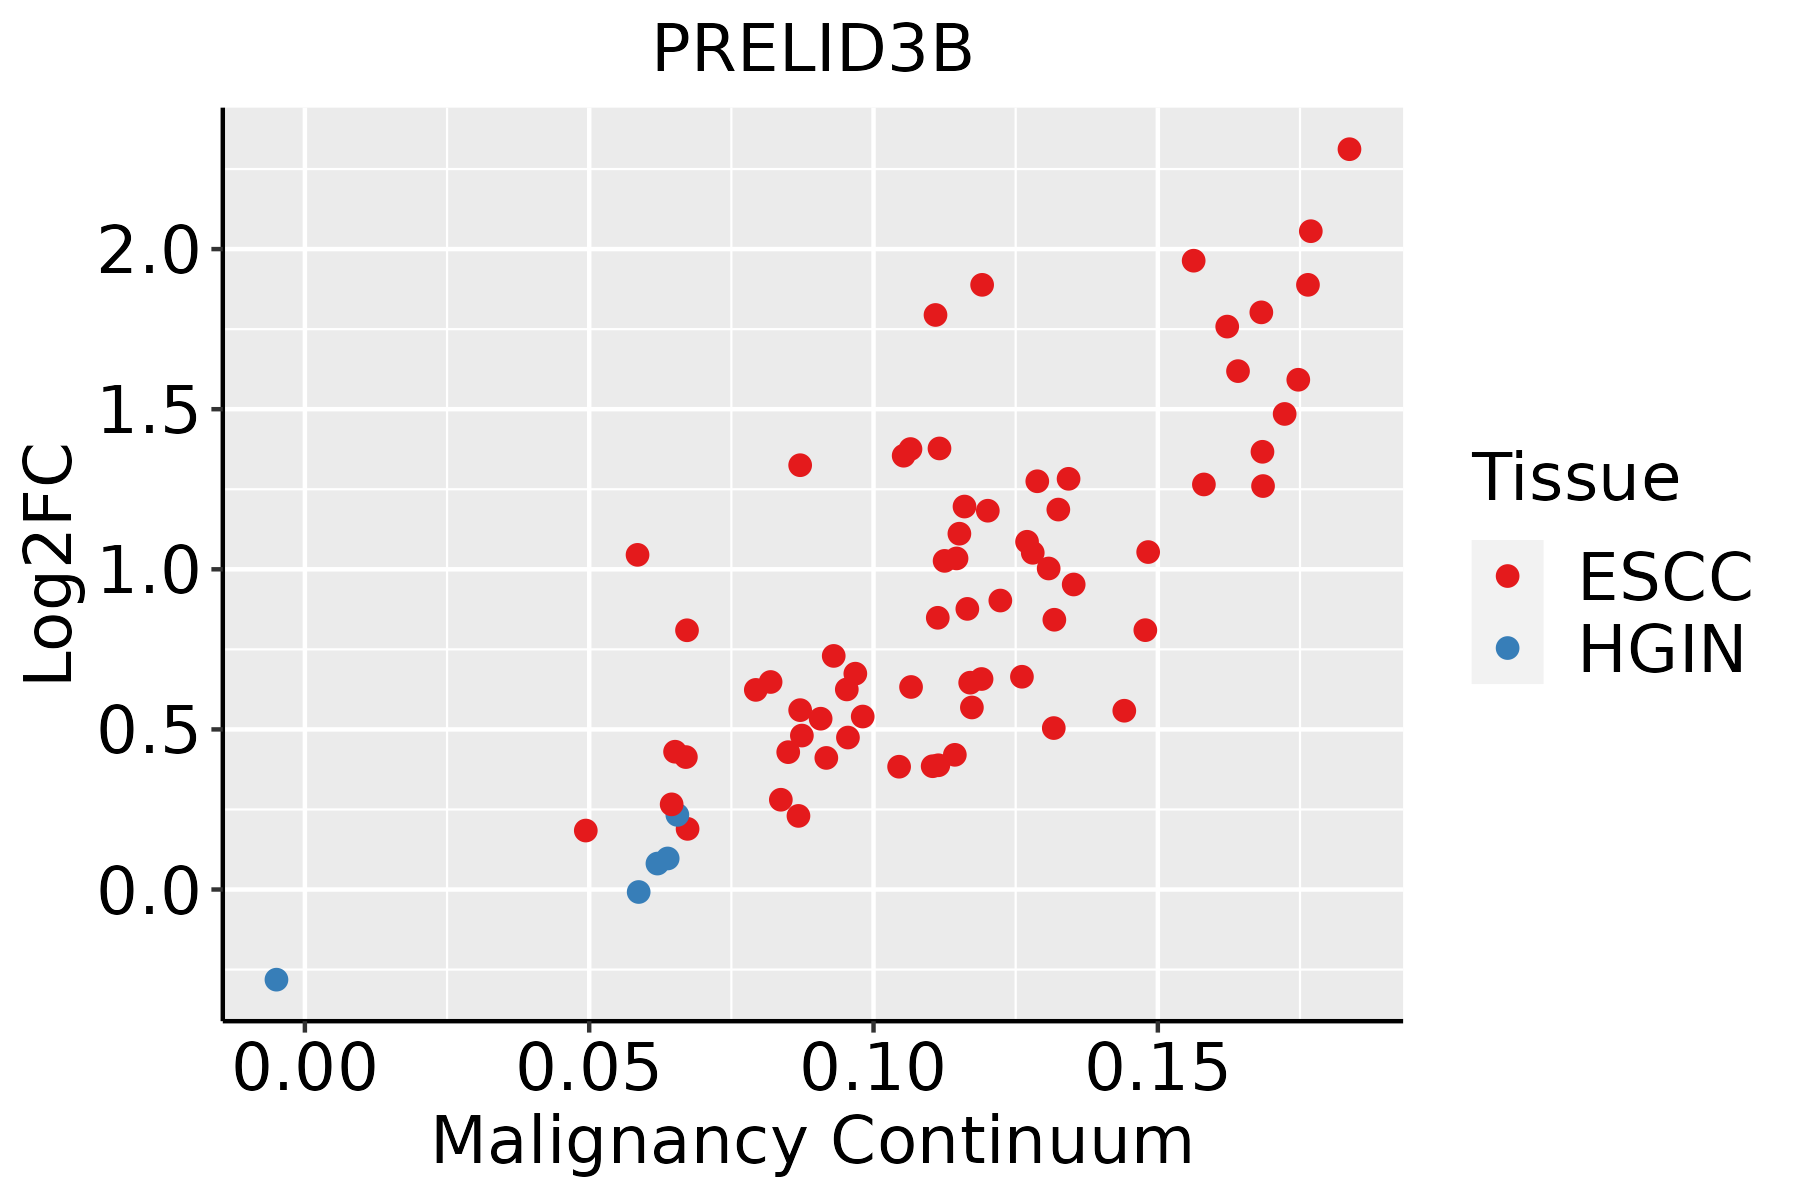 | ESCC: Esophageal squamous cell carcinoma |
| HGIN: High-grade intraepithelial neoplasias | ||
| LGIN: Low-grade intraepithelial neoplasias | ||
| Liver | 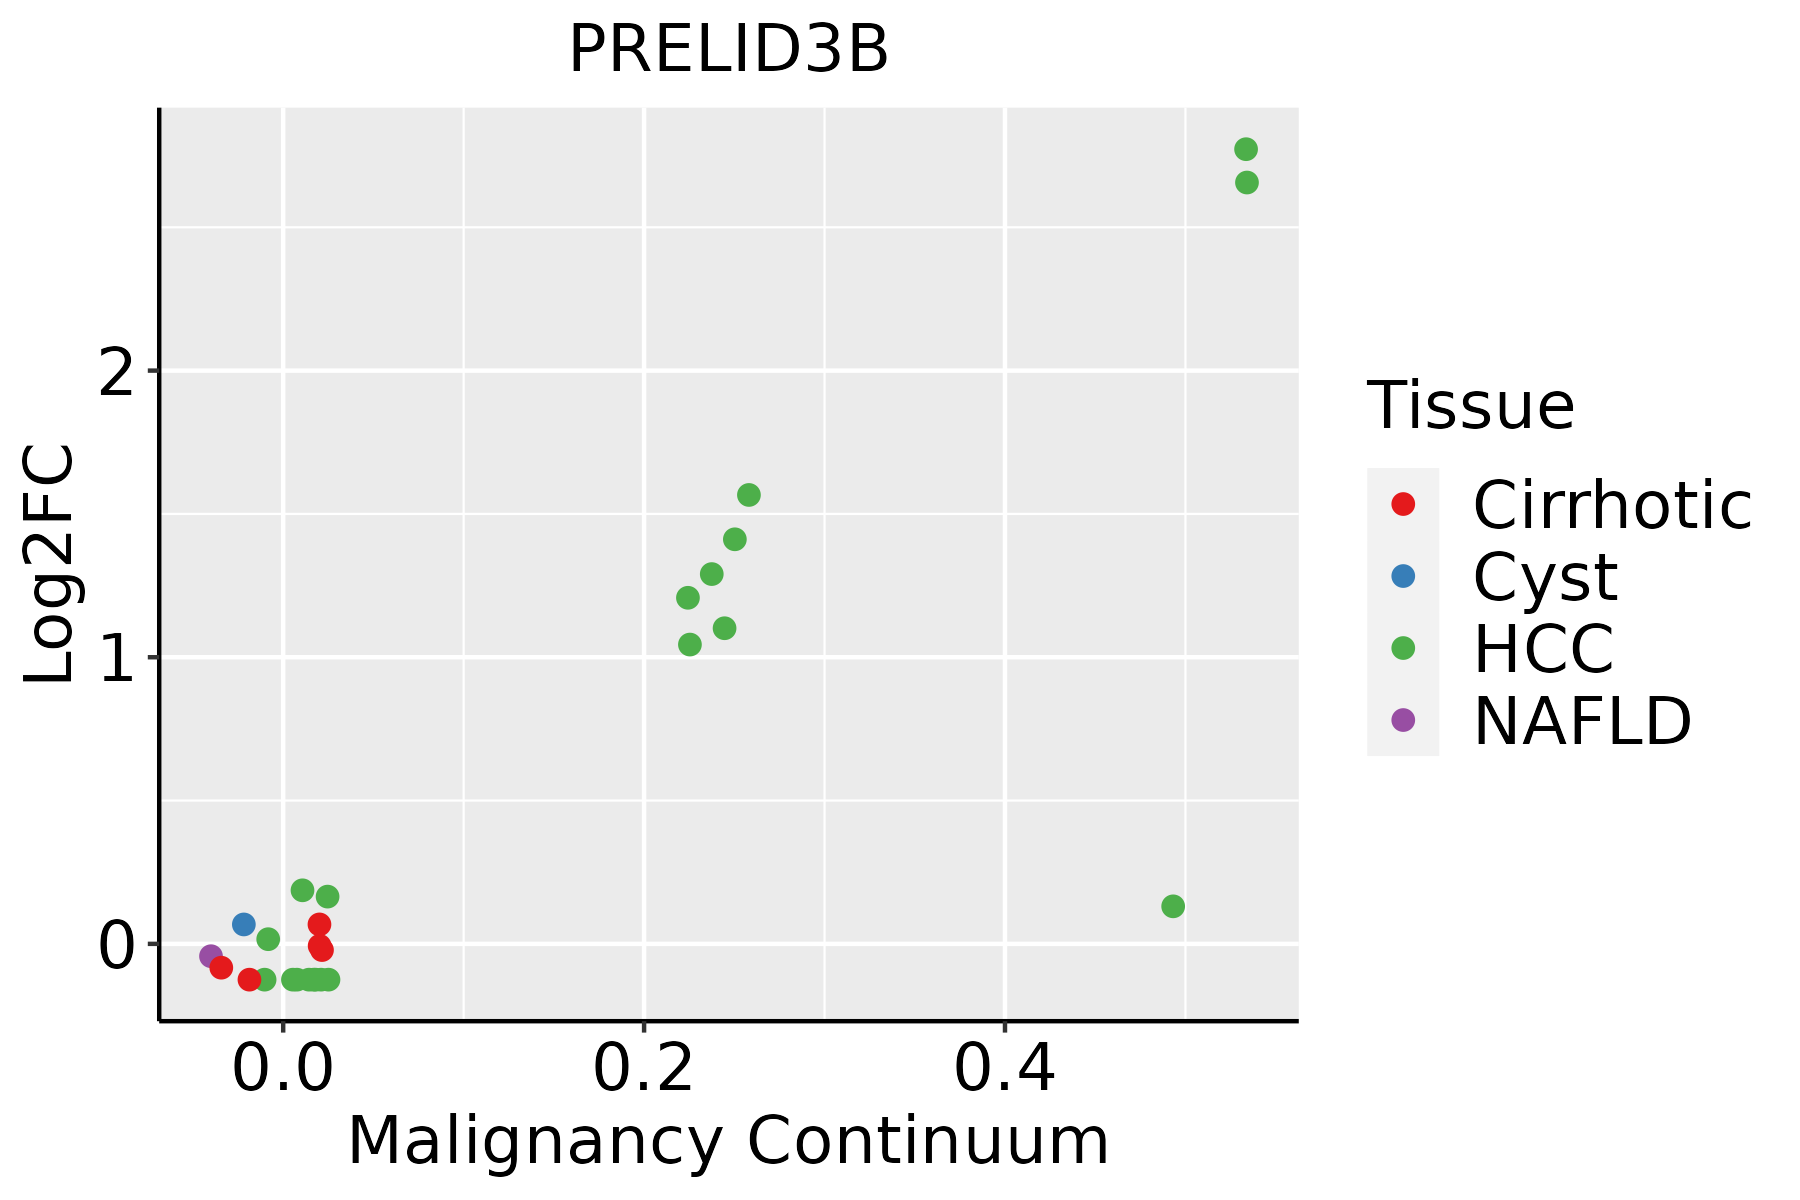 | HCC: Hepatocellular carcinoma |
| NAFLD: Non-alcoholic fatty liver disease | ||
| Oral Cavity | 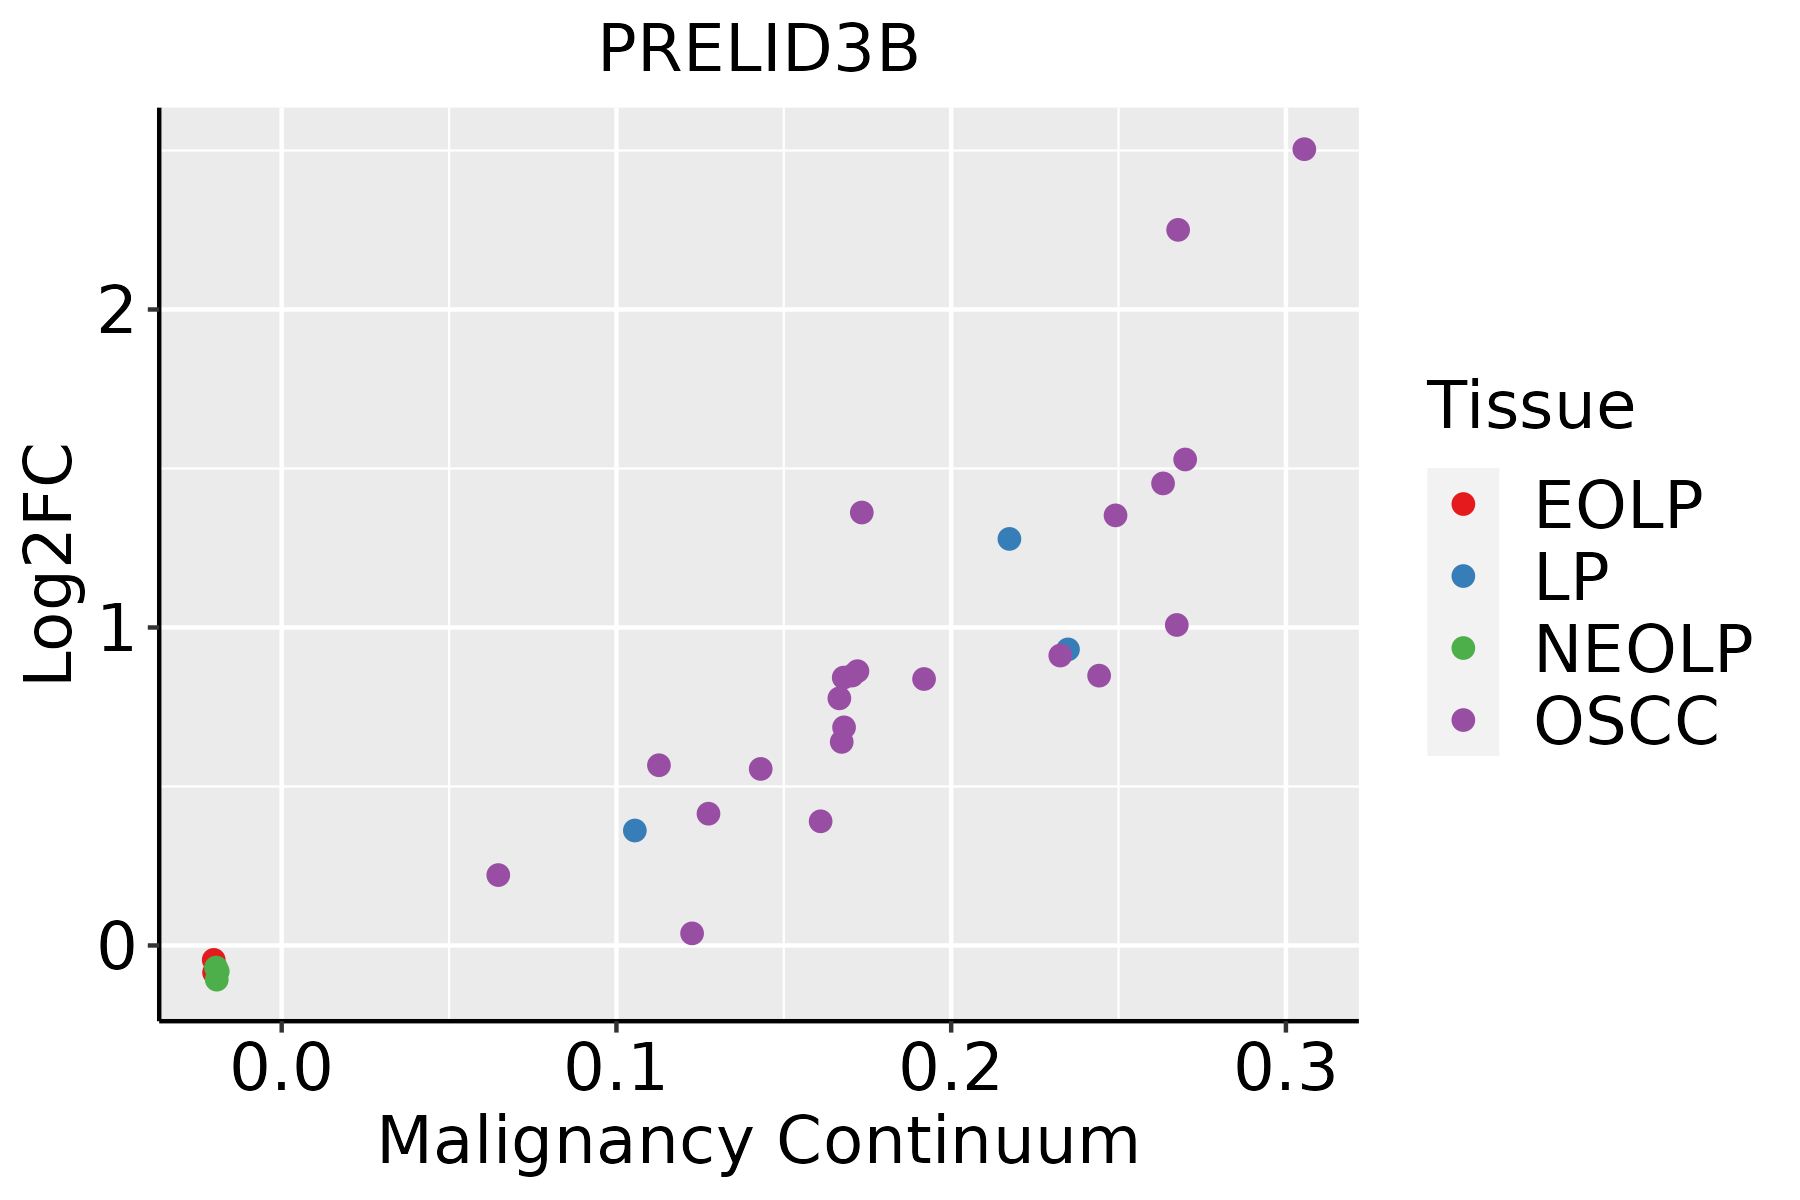 | EOLP: Erosive Oral lichen planus |
| LP: leukoplakia | ||
| NEOLP: Non-erosive oral lichen planus | ||
| OSCC: Oral squamous cell carcinoma | ||
| Thyroid |  | ATC: Anaplastic thyroid cancer |
| HT: Hashimoto's thyroiditis | ||
| PTC: Papillary thyroid cancer |
| ∗log2FC in expression of this searched gene in stem-like cells from each diseased tissue sample relative to stem-like cells in normal samples in each tissue plotted against the malignancy continuum. Samples are colored based on if they are from different disease stage. |
Top |
Malignant transformation related pathway analysis |
| Find out the enriched GO biological processes and KEGG pathways involved in transition from healthy to precancer to cancer |
| Tissue | Disease Stage | Enriched GO biological Processes |
| Colorectum | AD |  |
| Colorectum | SER |  |
| Colorectum | MSS |  |
| Colorectum | MSI-H |  |
| Colorectum | FAP |  |
| ∗Top 15 enriched GO BP terms are showed in the bar plot of each disease state in each tissue. Each row represents a significant GO biological process which is colored according to the -log10(p.adjust). |
| Page: 1 2 3 4 5 6 7 8 9 |
| GO ID | Tissue | Disease Stage | Description | Gene Ratio | Bg Ratio | pvalue | p.adjust | Count |
| GO:0010876 | Colorectum | AD | lipid localization | 120/3918 | 448/18723 | 1.59e-03 | 1.33e-02 | 120 |
| GO:0006869 | Colorectum | AD | lipid transport | 108/3918 | 398/18723 | 1.67e-03 | 1.39e-02 | 108 |
| GO:0015748 | Colorectum | AD | organophosphate ester transport | 42/3918 | 140/18723 | 7.04e-03 | 4.31e-02 | 42 |
| GO:00108761 | Colorectum | MSS | lipid localization | 104/3467 | 448/18723 | 6.76e-03 | 4.38e-02 | 104 |
| GO:00068691 | Colorectum | FAP | lipid transport | 81/2622 | 398/18723 | 2.84e-04 | 3.76e-03 | 81 |
| GO:00108762 | Colorectum | FAP | lipid localization | 85/2622 | 448/18723 | 1.92e-03 | 1.63e-02 | 85 |
| GO:0015914 | Colorectum | FAP | phospholipid transport | 23/2622 | 96/18723 | 6.09e-03 | 3.82e-02 | 23 |
| GO:001087611 | Liver | Cirrhotic | lipid localization | 147/4634 | 448/18723 | 6.24e-05 | 7.12e-04 | 147 |
| GO:000686911 | Liver | Cirrhotic | lipid transport | 128/4634 | 398/18723 | 4.54e-04 | 3.69e-03 | 128 |
| GO:01200091 | Liver | Cirrhotic | intermembrane lipid transfer | 21/4634 | 48/18723 | 3.06e-03 | 1.73e-02 | 21 |
| GO:001087621 | Liver | HCC | lipid localization | 228/7958 | 448/18723 | 1.80e-04 | 1.41e-03 | 228 |
| GO:01200092 | Liver | HCC | intermembrane lipid transfer | 33/7958 | 48/18723 | 2.12e-04 | 1.63e-03 | 33 |
| GO:000686921 | Liver | HCC | lipid transport | 198/7958 | 398/18723 | 1.92e-03 | 9.78e-03 | 198 |
| Page: 1 |
| Pathway ID | Tissue | Disease Stage | Description | Gene Ratio | Bg Ratio | pvalue | p.adjust | qvalue | Count |
| Page: 1 |
Top |
Cell-cell communication analysis |
| Identification of potential cell-cell interactions between two cell types and their ligand-receptor pairs for different disease states |
| Ligand | Receptor | LRpair | Pathway | Tissue | Disease Stage |
| Page: 1 |
Top |
Single-cell gene regulatory network inference analysis |
| Find out the significant the regulons (TFs) and the target genes of each regulon across cell types for different disease states |
| TF | Cell Type | Tissue | Disease Stage | Target Gene | RSS | Regulon Activity |
| ∗The dot plots of a searched regulon are shown for all cell subpopulations in each disease state of each tissue based on the regulon specific score inferred using pySCENIC and by calculating the average expression. |
| Page: 1 |
Top |
Somatic mutation of malignant transformation related genes |
| Annotation of somatic variants for genes involved in malignant transformation |
| Hugo Symbol | Variant Class | Variant Classification | dbSNP RS | HGVSc | HGVSp | HGVSp Short | SWISSPROT | BIOTYPE | SIFT | PolyPhen | Tumor Sample Barcode | Tissue | Histology | Sex | Age | Stage | Therapy Types | Drugs | Outcome |
| PRELID3B | SNV | Missense_Mutation | rs762528766 | c.35A>C | p.His12Pro | p.H12P | Q9Y3B1 | protein_coding | deleterious(0) | possibly_damaging(0.873) | TCGA-A8-A07W-01 | Breast | breast invasive carcinoma | Female | >=65 | III/IV | Hormone Therapy | exemestane | SD |
| PRELID3B | SNV | Missense_Mutation | novel | c.296C>T | p.Ser99Leu | p.S99L | Q9Y3B1 | protein_coding | tolerated(0.05) | benign(0.114) | TCGA-JX-A3Q0-01 | Cervix | cervical & endocervical cancer | Female | <65 | III/IV | Unknown | Unknown | SD |
| PRELID3B | SNV | Missense_Mutation | c.514N>A | p.Glu172Lys | p.E172K | Q9Y3B1 | protein_coding | tolerated(0.38) | benign(0.019) | TCGA-F4-6703-01 | Colorectum | colon adenocarcinoma | Male | <65 | I/II | Unknown | Unknown | SD | |
| PRELID3B | SNV | Missense_Mutation | novel | c.506C>T | p.Ala169Val | p.A169V | Q9Y3B1 | protein_coding | tolerated(0.1) | possibly_damaging(0.493) | TCGA-EI-6917-01 | Colorectum | rectum adenocarcinoma | Male | <65 | III/IV | Chemotherapy | 5fluorouracil+oxaciplatina+l-folinian | SD |
| PRELID3B | SNV | Missense_Mutation | novel | c.130N>T | p.Asp44Tyr | p.D44Y | Q9Y3B1 | protein_coding | tolerated(0.05) | possibly_damaging(0.634) | TCGA-A5-A1OF-01 | Endometrium | uterine corpus endometrioid carcinoma | Female | <65 | I/II | Unknown | Unknown | SD |
| PRELID3B | SNV | Missense_Mutation | rs776059070 | c.443N>T | p.Thr148Met | p.T148M | Q9Y3B1 | protein_coding | tolerated(0.07) | possibly_damaging(0.802) | TCGA-A5-A2K5-01 | Endometrium | uterine corpus endometrioid carcinoma | Female | >=65 | I/II | Unknown | Unknown | SD |
| PRELID3B | SNV | Missense_Mutation | c.200C>A | p.Ser67Tyr | p.S67Y | Q9Y3B1 | protein_coding | deleterious(0) | possibly_damaging(0.482) | TCGA-AP-A059-01 | Endometrium | uterine corpus endometrioid carcinoma | Female | >=65 | I/II | Unknown | Unknown | SD | |
| PRELID3B | SNV | Missense_Mutation | novel | c.307N>G | p.Met103Val | p.M103V | Q9Y3B1 | protein_coding | tolerated(0.22) | benign(0) | TCGA-AP-A1DK-01 | Endometrium | uterine corpus endometrioid carcinoma | Female | <65 | I/II | Unknown | Unknown | SD |
| PRELID3B | SNV | Missense_Mutation | novel | c.230A>G | p.Tyr77Cys | p.Y77C | Q9Y3B1 | protein_coding | deleterious(0) | possibly_damaging(0.789) | TCGA-AX-A1CE-01 | Endometrium | uterine corpus endometrioid carcinoma | Female | <65 | I/II | Unspecific | Paclitaxel | SD |
| PRELID3B | SNV | Missense_Mutation | rs376167473 | c.269N>T | p.Thr90Ile | p.T90I | Q9Y3B1 | protein_coding | tolerated(0.11) | benign(0.114) | TCGA-B5-A1MX-01 | Endometrium | uterine corpus endometrioid carcinoma | Female | <65 | I/II | Hormone Therapy | megace | SD |
| Page: 1 2 |
Top |
Related drugs of malignant transformation related genes |
| Identification of chemicals and drugs interact with genes involved in malignant transfromation |
| (DGIdb 4.0) |
| Entrez ID | Symbol | Category | Interaction Types | Drug Claim Name | Drug Name | PMIDs |
| Page: 1 |

Copyright 2023-Present -The University of Texas Health Science Center at Houston |