
|
|||||
|
 | |
| |
| |
| |
| |
| |
|
Gene: PREB |
Gene summary for PREB |
| Gene information | Species | Human | Gene symbol | PREB | Gene ID | 10113 |
| Gene name | prolactin regulatory element binding | |
| Gene Alias | SEC12 | |
| Cytomap | 2p23.3 | |
| Gene Type | protein-coding | GO ID | GO:0003400 | UniProtAcc | Q05DB2 |
Top |
Malignant transformation analysis |
| Identification of the aberrant gene expression in precancerous and cancerous lesions by comparing the gene expression of stem-like cells in diseased tissues with normal stem cells |
| Entrez ID | Symbol | Replicates | Species | Organ | Tissue | Adj P-value | Log2FC | Malignancy |
| 10113 | PREB | LZE2T | Human | Esophagus | ESCC | 2.31e-02 | 4.69e-01 | 0.082 |
| 10113 | PREB | LZE4T | Human | Esophagus | ESCC | 9.56e-08 | 2.35e-01 | 0.0811 |
| 10113 | PREB | LZE22D1 | Human | Esophagus | HGIN | 1.76e-02 | 1.36e-01 | 0.0595 |
| 10113 | PREB | LZE22T | Human | Esophagus | ESCC | 4.79e-06 | 3.70e-01 | 0.068 |
| 10113 | PREB | LZE24T | Human | Esophagus | ESCC | 1.36e-21 | 6.68e-01 | 0.0596 |
| 10113 | PREB | LZE21T | Human | Esophagus | ESCC | 1.87e-04 | 3.20e-01 | 0.0655 |
| 10113 | PREB | P1T-E | Human | Esophagus | ESCC | 2.36e-09 | 5.83e-01 | 0.0875 |
| 10113 | PREB | P2T-E | Human | Esophagus | ESCC | 4.73e-42 | 6.96e-01 | 0.1177 |
| 10113 | PREB | P4T-E | Human | Esophagus | ESCC | 8.21e-27 | 6.50e-01 | 0.1323 |
| 10113 | PREB | P5T-E | Human | Esophagus | ESCC | 4.30e-14 | 3.74e-01 | 0.1327 |
| 10113 | PREB | P8T-E | Human | Esophagus | ESCC | 1.04e-11 | 2.56e-01 | 0.0889 |
| 10113 | PREB | P9T-E | Human | Esophagus | ESCC | 1.27e-12 | 4.12e-01 | 0.1131 |
| 10113 | PREB | P10T-E | Human | Esophagus | ESCC | 4.08e-22 | 4.87e-01 | 0.116 |
| 10113 | PREB | P11T-E | Human | Esophagus | ESCC | 2.53e-17 | 7.91e-01 | 0.1426 |
| 10113 | PREB | P12T-E | Human | Esophagus | ESCC | 4.82e-32 | 5.76e-01 | 0.1122 |
| 10113 | PREB | P15T-E | Human | Esophagus | ESCC | 2.25e-26 | 6.12e-01 | 0.1149 |
| 10113 | PREB | P16T-E | Human | Esophagus | ESCC | 1.47e-15 | 4.32e-01 | 0.1153 |
| 10113 | PREB | P17T-E | Human | Esophagus | ESCC | 4.99e-06 | 3.70e-01 | 0.1278 |
| 10113 | PREB | P19T-E | Human | Esophagus | ESCC | 4.46e-14 | 1.08e+00 | 0.1662 |
| 10113 | PREB | P20T-E | Human | Esophagus | ESCC | 1.24e-16 | 4.68e-01 | 0.1124 |
| Page: 1 2 3 4 5 |
| Tissue | Expression Dynamics | Abbreviation |
| Esophagus |  | ESCC: Esophageal squamous cell carcinoma |
| HGIN: High-grade intraepithelial neoplasias | ||
| LGIN: Low-grade intraepithelial neoplasias | ||
| Liver | 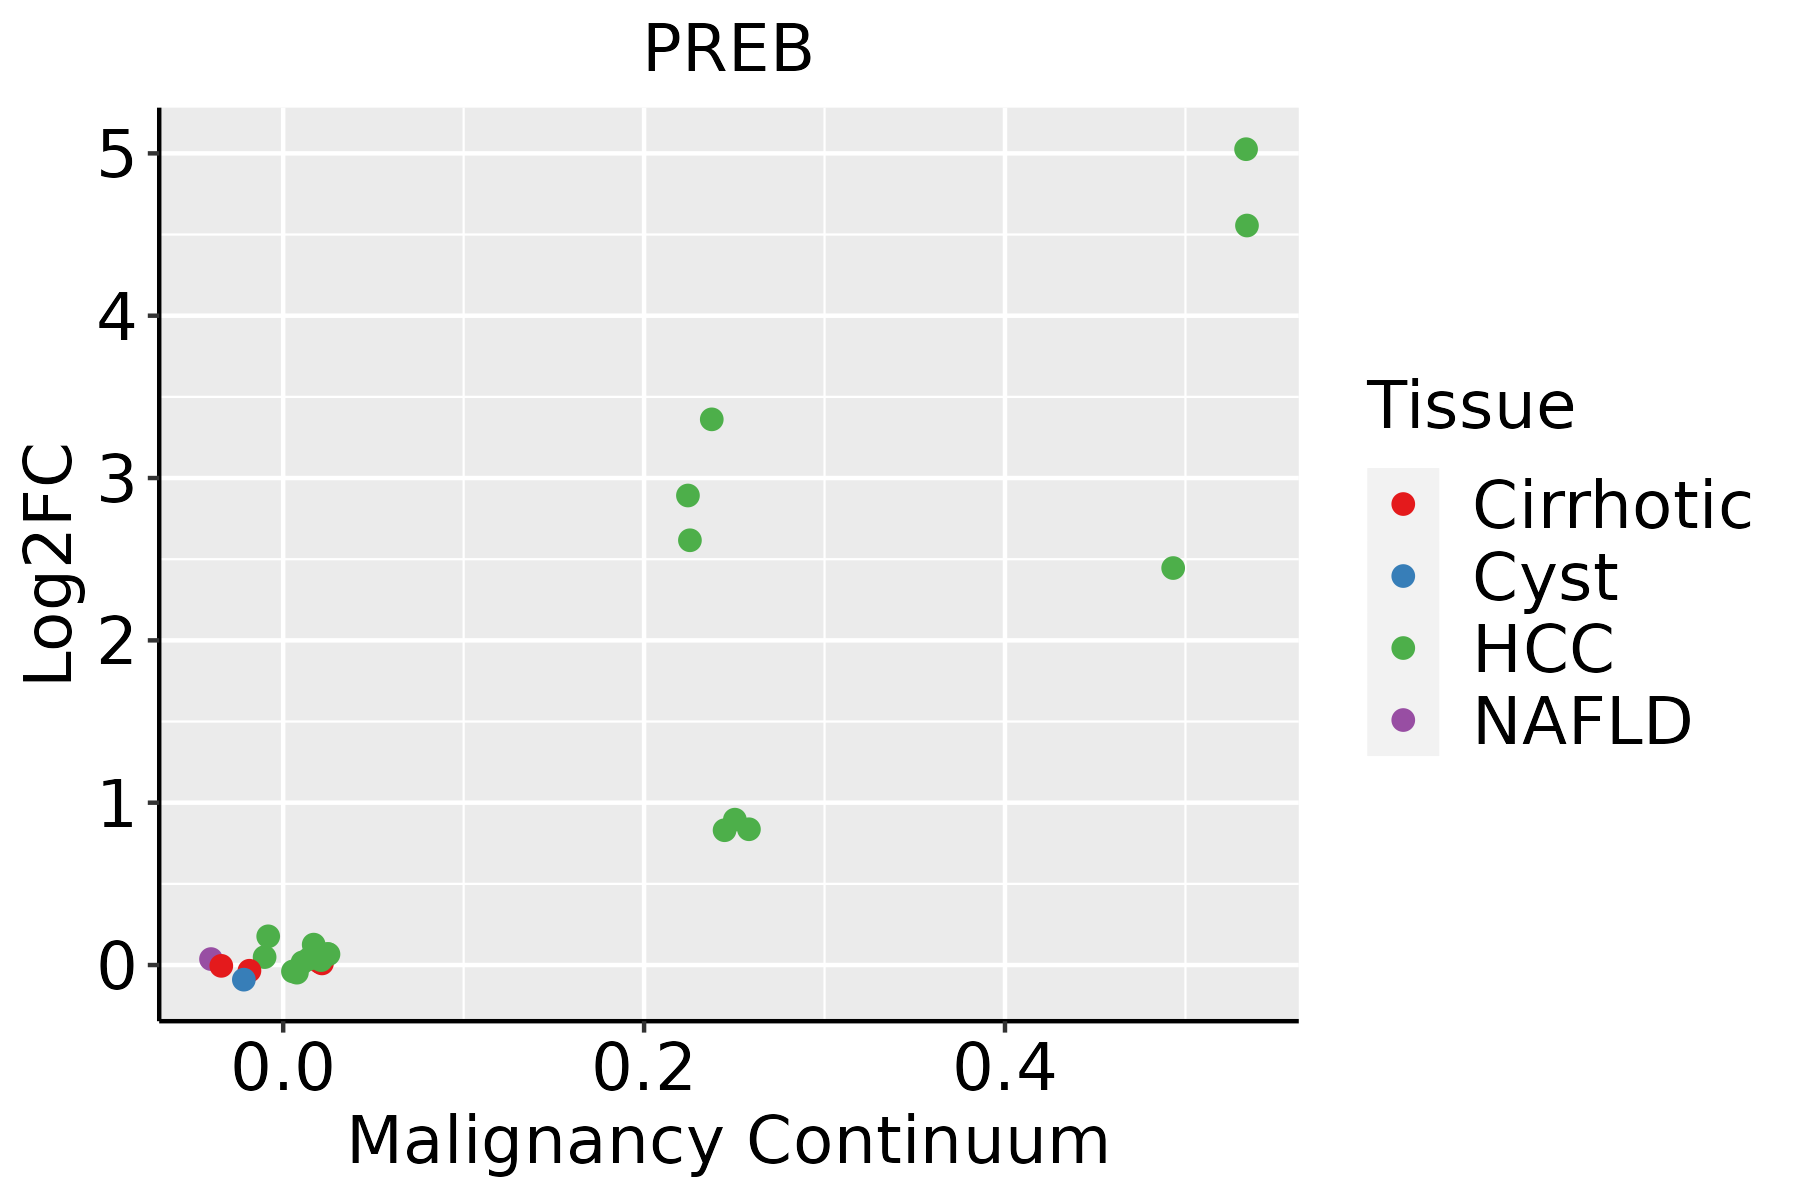 | HCC: Hepatocellular carcinoma |
| NAFLD: Non-alcoholic fatty liver disease | ||
| Oral Cavity |  | EOLP: Erosive Oral lichen planus |
| LP: leukoplakia | ||
| NEOLP: Non-erosive oral lichen planus | ||
| OSCC: Oral squamous cell carcinoma | ||
| Skin |  | AK: Actinic keratosis |
| cSCC: Cutaneous squamous cell carcinoma | ||
| SCCIS:squamous cell carcinoma in situ |
| ∗log2FC in expression of this searched gene in stem-like cells from each diseased tissue sample relative to stem-like cells in normal samples in each tissue plotted against the malignancy continuum. Samples are colored based on if they are from different disease stage. |
Top |
Malignant transformation related pathway analysis |
| Find out the enriched GO biological processes and KEGG pathways involved in transition from healthy to precancer to cancer |
| Tissue | Disease Stage | Enriched GO biological Processes |
| Colorectum | AD |  |
| Colorectum | SER |  |
| Colorectum | MSS |  |
| Colorectum | MSI-H |  |
| Colorectum | FAP |  |
| ∗Top 15 enriched GO BP terms are showed in the bar plot of each disease state in each tissue. Each row represents a significant GO biological process which is colored according to the -log10(p.adjust). |
| Page: 1 2 3 4 5 6 7 8 9 |
| GO ID | Tissue | Disease Stage | Description | Gene Ratio | Bg Ratio | pvalue | p.adjust | Count |
| GO:004819317 | Esophagus | HGIN | Golgi vesicle transport | 83/2587 | 296/18723 | 8.59e-11 | 8.89e-09 | 83 |
| GO:005165616 | Esophagus | HGIN | establishment of organelle localization | 90/2587 | 390/18723 | 4.27e-07 | 1.94e-05 | 90 |
| GO:00068889 | Esophagus | HGIN | endoplasmic reticulum to Golgi vesicle-mediated transport | 40/2587 | 130/18723 | 4.67e-07 | 2.07e-05 | 40 |
| GO:003238617 | Esophagus | HGIN | regulation of intracellular transport | 79/2587 | 337/18723 | 1.11e-06 | 4.36e-05 | 79 |
| GO:004325427 | Esophagus | HGIN | regulation of protein-containing complex assembly | 94/2587 | 428/18723 | 2.39e-06 | 8.55e-05 | 94 |
| GO:000690020 | Esophagus | HGIN | vesicle budding from membrane | 23/2587 | 61/18723 | 2.85e-06 | 9.93e-05 | 23 |
| GO:00160509 | Esophagus | HGIN | vesicle organization | 65/2587 | 300/18723 | 1.24e-04 | 2.54e-03 | 65 |
| GO:00901146 | Esophagus | HGIN | COPII-coated vesicle budding | 11/2587 | 29/18723 | 1.08e-03 | 1.32e-02 | 11 |
| GO:00325277 | Esophagus | HGIN | protein exit from endoplasmic reticulum | 15/2587 | 48/18723 | 1.49e-03 | 1.73e-02 | 15 |
| GO:005165010 | Esophagus | HGIN | establishment of vesicle localization | 35/2587 | 161/18723 | 3.89e-03 | 3.54e-02 | 35 |
| GO:00482075 | Esophagus | HGIN | vesicle targeting, rough ER to cis-Golgi | 6/2587 | 13/18723 | 4.97e-03 | 4.18e-02 | 6 |
| GO:00482085 | Esophagus | HGIN | COPII vesicle coating | 6/2587 | 13/18723 | 4.97e-03 | 4.18e-02 | 6 |
| GO:00481996 | Esophagus | HGIN | vesicle targeting, to, from or within Golgi | 8/2587 | 21/18723 | 5.00e-03 | 4.19e-02 | 8 |
| GO:00069017 | Esophagus | HGIN | vesicle coating | 7/2587 | 17/18723 | 5.21e-03 | 4.30e-02 | 7 |
| GO:005164810 | Esophagus | HGIN | vesicle localization | 37/2587 | 177/18723 | 6.03e-03 | 4.87e-02 | 37 |
| GO:004819318 | Esophagus | ESCC | Golgi vesicle transport | 231/8552 | 296/18723 | 1.82e-30 | 9.63e-28 | 231 |
| GO:003238618 | Esophagus | ESCC | regulation of intracellular transport | 243/8552 | 337/18723 | 3.20e-23 | 7.25e-21 | 243 |
| GO:005165617 | Esophagus | ESCC | establishment of organelle localization | 273/8552 | 390/18723 | 9.13e-23 | 1.81e-20 | 273 |
| GO:001605014 | Esophagus | ESCC | vesicle organization | 211/8552 | 300/18723 | 2.85e-18 | 2.87e-16 | 211 |
| GO:0043254111 | Esophagus | ESCC | regulation of protein-containing complex assembly | 278/8552 | 428/18723 | 3.81e-16 | 2.77e-14 | 278 |
| Page: 1 2 3 4 5 6 |
| Pathway ID | Tissue | Disease Stage | Description | Gene Ratio | Bg Ratio | pvalue | p.adjust | qvalue | Count |
| hsa0414139 | Esophagus | HGIN | Protein processing in endoplasmic reticulum | 67/1383 | 174/8465 | 1.06e-12 | 2.16e-11 | 1.72e-11 | 67 |
| hsa04141114 | Esophagus | HGIN | Protein processing in endoplasmic reticulum | 67/1383 | 174/8465 | 1.06e-12 | 2.16e-11 | 1.72e-11 | 67 |
| hsa04141211 | Esophagus | ESCC | Protein processing in endoplasmic reticulum | 147/4205 | 174/8465 | 3.29e-22 | 1.10e-19 | 5.64e-20 | 147 |
| hsa04141310 | Esophagus | ESCC | Protein processing in endoplasmic reticulum | 147/4205 | 174/8465 | 3.29e-22 | 1.10e-19 | 5.64e-20 | 147 |
| hsa0414122 | Liver | HCC | Protein processing in endoplasmic reticulum | 146/4020 | 174/8465 | 7.34e-24 | 2.46e-21 | 1.37e-21 | 146 |
| hsa0414132 | Liver | HCC | Protein processing in endoplasmic reticulum | 146/4020 | 174/8465 | 7.34e-24 | 2.46e-21 | 1.37e-21 | 146 |
| hsa0414130 | Oral cavity | OSCC | Protein processing in endoplasmic reticulum | 143/3704 | 174/8465 | 6.82e-26 | 2.28e-23 | 1.16e-23 | 143 |
| hsa04141113 | Oral cavity | OSCC | Protein processing in endoplasmic reticulum | 143/3704 | 174/8465 | 6.82e-26 | 2.28e-23 | 1.16e-23 | 143 |
| hsa04141210 | Oral cavity | LP | Protein processing in endoplasmic reticulum | 113/2418 | 174/8465 | 8.74e-24 | 5.82e-22 | 3.76e-22 | 113 |
| hsa0414138 | Oral cavity | LP | Protein processing in endoplasmic reticulum | 113/2418 | 174/8465 | 8.74e-24 | 5.82e-22 | 3.76e-22 | 113 |
| Page: 1 |
Top |
Cell-cell communication analysis |
| Identification of potential cell-cell interactions between two cell types and their ligand-receptor pairs for different disease states |
| Ligand | Receptor | LRpair | Pathway | Tissue | Disease Stage |
| Page: 1 |
Top |
Single-cell gene regulatory network inference analysis |
| Find out the significant the regulons (TFs) and the target genes of each regulon across cell types for different disease states |
| TF | Cell Type | Tissue | Disease Stage | Target Gene | RSS | Regulon Activity |
| ∗The dot plots of a searched regulon are shown for all cell subpopulations in each disease state of each tissue based on the regulon specific score inferred using pySCENIC and by calculating the average expression. |
| Page: 1 |
Top |
Somatic mutation of malignant transformation related genes |
| Annotation of somatic variants for genes involved in malignant transformation |
| Hugo Symbol | Variant Class | Variant Classification | dbSNP RS | HGVSc | HGVSp | HGVSp Short | SWISSPROT | BIOTYPE | SIFT | PolyPhen | Tumor Sample Barcode | Tissue | Histology | Sex | Age | Stage | Therapy Types | Drugs | Outcome |
| PREB | SNV | Missense_Mutation | c.463N>G | p.Pro155Ala | p.P155A | Q9HCU5 | protein_coding | tolerated(0.46) | benign(0.129) | TCGA-AC-A23H-01 | Breast | breast invasive carcinoma | Female | >=65 | I/II | Unknown | Unknown | PD | |
| PREB | SNV | Missense_Mutation | rs143024109 | c.367N>T | p.Pro123Ser | p.P123S | Q9HCU5 | protein_coding | tolerated(0.48) | benign(0.01) | TCGA-BH-A0HF-01 | Breast | breast invasive carcinoma | Female | >=65 | I/II | Hormone Therapy | arimidex | SD |
| PREB | SNV | Missense_Mutation | rs201697354 | c.881G>A | p.Arg294Gln | p.R294Q | Q9HCU5 | protein_coding | tolerated(0.34) | benign(0.001) | TCGA-2W-A8YY-01 | Cervix | cervical & endocervical cancer | Female | <65 | I/II | Chemotherapy | cisplatin | CR |
| PREB | SNV | Missense_Mutation | rs781265603 | c.990N>G | p.Phe330Leu | p.F330L | Q9HCU5 | protein_coding | deleterious(0) | probably_damaging(0.985) | TCGA-FU-A23L-01 | Cervix | cervical & endocervical cancer | Female | <65 | I/II | Chemotherapy | cisplatin | CR |
| PREB | SNV | Missense_Mutation | rs747057181 | c.532N>A | p.Val178Ile | p.V178I | Q9HCU5 | protein_coding | tolerated(0.65) | benign(0.02) | TCGA-FU-A3HZ-01 | Cervix | cervical & endocervical cancer | Female | <65 | I/II | Chemotherapy | cisplatin | CR |
| PREB | deletion | In_Frame_Del | novel | c.1136_1156delNNNNNNNNNNNNNNNNNNNNN | p.Gln379_Ser385del | p.Q379_S385del | Q9HCU5 | protein_coding | TCGA-FU-A3HZ-01 | Cervix | cervical & endocervical cancer | Female | <65 | I/II | Chemotherapy | cisplatin | CR | ||
| PREB | SNV | Missense_Mutation | c.505N>A | p.Leu169Ile | p.L169I | Q9HCU5 | protein_coding | tolerated(0.06) | benign(0.088) | TCGA-3L-AA1B-01 | Colorectum | colon adenocarcinoma | Female | <65 | I/II | Unknown | Unknown | SD | |
| PREB | SNV | Missense_Mutation | c.820N>A | p.Leu274Met | p.L274M | Q9HCU5 | protein_coding | deleterious(0.03) | benign(0.172) | TCGA-AA-3715-01 | Colorectum | colon adenocarcinoma | Male | >=65 | I/II | Unknown | Unknown | PD | |
| PREB | SNV | Missense_Mutation | rs771756534 | c.934N>A | p.Gly312Ser | p.G312S | Q9HCU5 | protein_coding | deleterious(0) | probably_damaging(0.999) | TCGA-CK-4951-01 | Colorectum | colon adenocarcinoma | Female | >=65 | I/II | Unknown | Unknown | PD |
| PREB | SNV | Missense_Mutation | c.119N>A | p.Gly40Asp | p.G40D | Q9HCU5 | protein_coding | deleterious(0) | probably_damaging(0.999) | TCGA-G4-6588-01 | Colorectum | colon adenocarcinoma | Female | <65 | I/II | Unknown | Unknown | SD |
| Page: 1 2 3 4 |
Top |
Related drugs of malignant transformation related genes |
| Identification of chemicals and drugs interact with genes involved in malignant transfromation |
| (DGIdb 4.0) |
| Entrez ID | Symbol | Category | Interaction Types | Drug Claim Name | Drug Name | PMIDs |
| Page: 1 |

Copyright 2023-Present -The University of Texas Health Science Center at Houston |