
|
|||||
|
 | |
| |
| |
| |
| |
| |
|
Gene: PRDX6 |
Gene summary for PRDX6 |
| Gene information | Species | Human | Gene symbol | PRDX6 | Gene ID | 9588 |
| Gene name | peroxiredoxin 6 | |
| Gene Alias | 1-Cys | |
| Cytomap | 1q25.1 | |
| Gene Type | protein-coding | GO ID | GO:0000375 | UniProtAcc | P30041 |
Top |
Malignant transformation analysis |
| Identification of the aberrant gene expression in precancerous and cancerous lesions by comparing the gene expression of stem-like cells in diseased tissues with normal stem cells |
| Entrez ID | Symbol | Replicates | Species | Organ | Tissue | Adj P-value | Log2FC | Malignancy |
| 9588 | PRDX6 | GSM4909281 | Human | Breast | IDC | 1.66e-06 | 4.25e-01 | 0.21 |
| 9588 | PRDX6 | GSM4909285 | Human | Breast | IDC | 8.86e-06 | 4.01e-01 | 0.21 |
| 9588 | PRDX6 | GSM4909286 | Human | Breast | IDC | 2.07e-04 | -3.21e-02 | 0.1081 |
| 9588 | PRDX6 | GSM4909287 | Human | Breast | IDC | 2.41e-12 | 4.38e-01 | 0.2057 |
| 9588 | PRDX6 | GSM4909288 | Human | Breast | IDC | 1.11e-05 | 5.51e-02 | 0.0988 |
| 9588 | PRDX6 | GSM4909291 | Human | Breast | IDC | 4.57e-04 | 3.84e-01 | 0.1753 |
| 9588 | PRDX6 | GSM4909294 | Human | Breast | IDC | 1.17e-08 | 1.08e-01 | 0.2022 |
| 9588 | PRDX6 | GSM4909296 | Human | Breast | IDC | 2.18e-14 | -2.55e-01 | 0.1524 |
| 9588 | PRDX6 | GSM4909297 | Human | Breast | IDC | 2.58e-23 | -2.04e-01 | 0.1517 |
| 9588 | PRDX6 | GSM4909301 | Human | Breast | IDC | 1.40e-26 | 5.44e-01 | 0.1577 |
| 9588 | PRDX6 | GSM4909308 | Human | Breast | IDC | 8.08e-11 | 4.57e-01 | 0.158 |
| 9588 | PRDX6 | GSM4909309 | Human | Breast | IDC | 6.86e-06 | -1.06e-02 | 0.0483 |
| 9588 | PRDX6 | GSM4909311 | Human | Breast | IDC | 7.68e-46 | -1.87e-01 | 0.1534 |
| 9588 | PRDX6 | GSM4909312 | Human | Breast | IDC | 3.48e-20 | 1.95e-01 | 0.1552 |
| 9588 | PRDX6 | GSM4909313 | Human | Breast | IDC | 1.96e-02 | 7.71e-02 | 0.0391 |
| 9588 | PRDX6 | GSM4909315 | Human | Breast | IDC | 8.67e-07 | 3.23e-01 | 0.21 |
| 9588 | PRDX6 | GSM4909316 | Human | Breast | IDC | 1.79e-08 | 2.59e-01 | 0.21 |
| 9588 | PRDX6 | GSM4909318 | Human | Breast | IDC | 2.69e-06 | 4.57e-01 | 0.2031 |
| 9588 | PRDX6 | GSM4909319 | Human | Breast | IDC | 4.14e-59 | -3.07e-01 | 0.1563 |
| 9588 | PRDX6 | GSM4909320 | Human | Breast | IDC | 5.91e-04 | -3.07e-01 | 0.1575 |
| Page: 1 2 3 4 5 6 7 8 9 10 11 12 13 |
| Tissue | Expression Dynamics | Abbreviation |
| Breast | 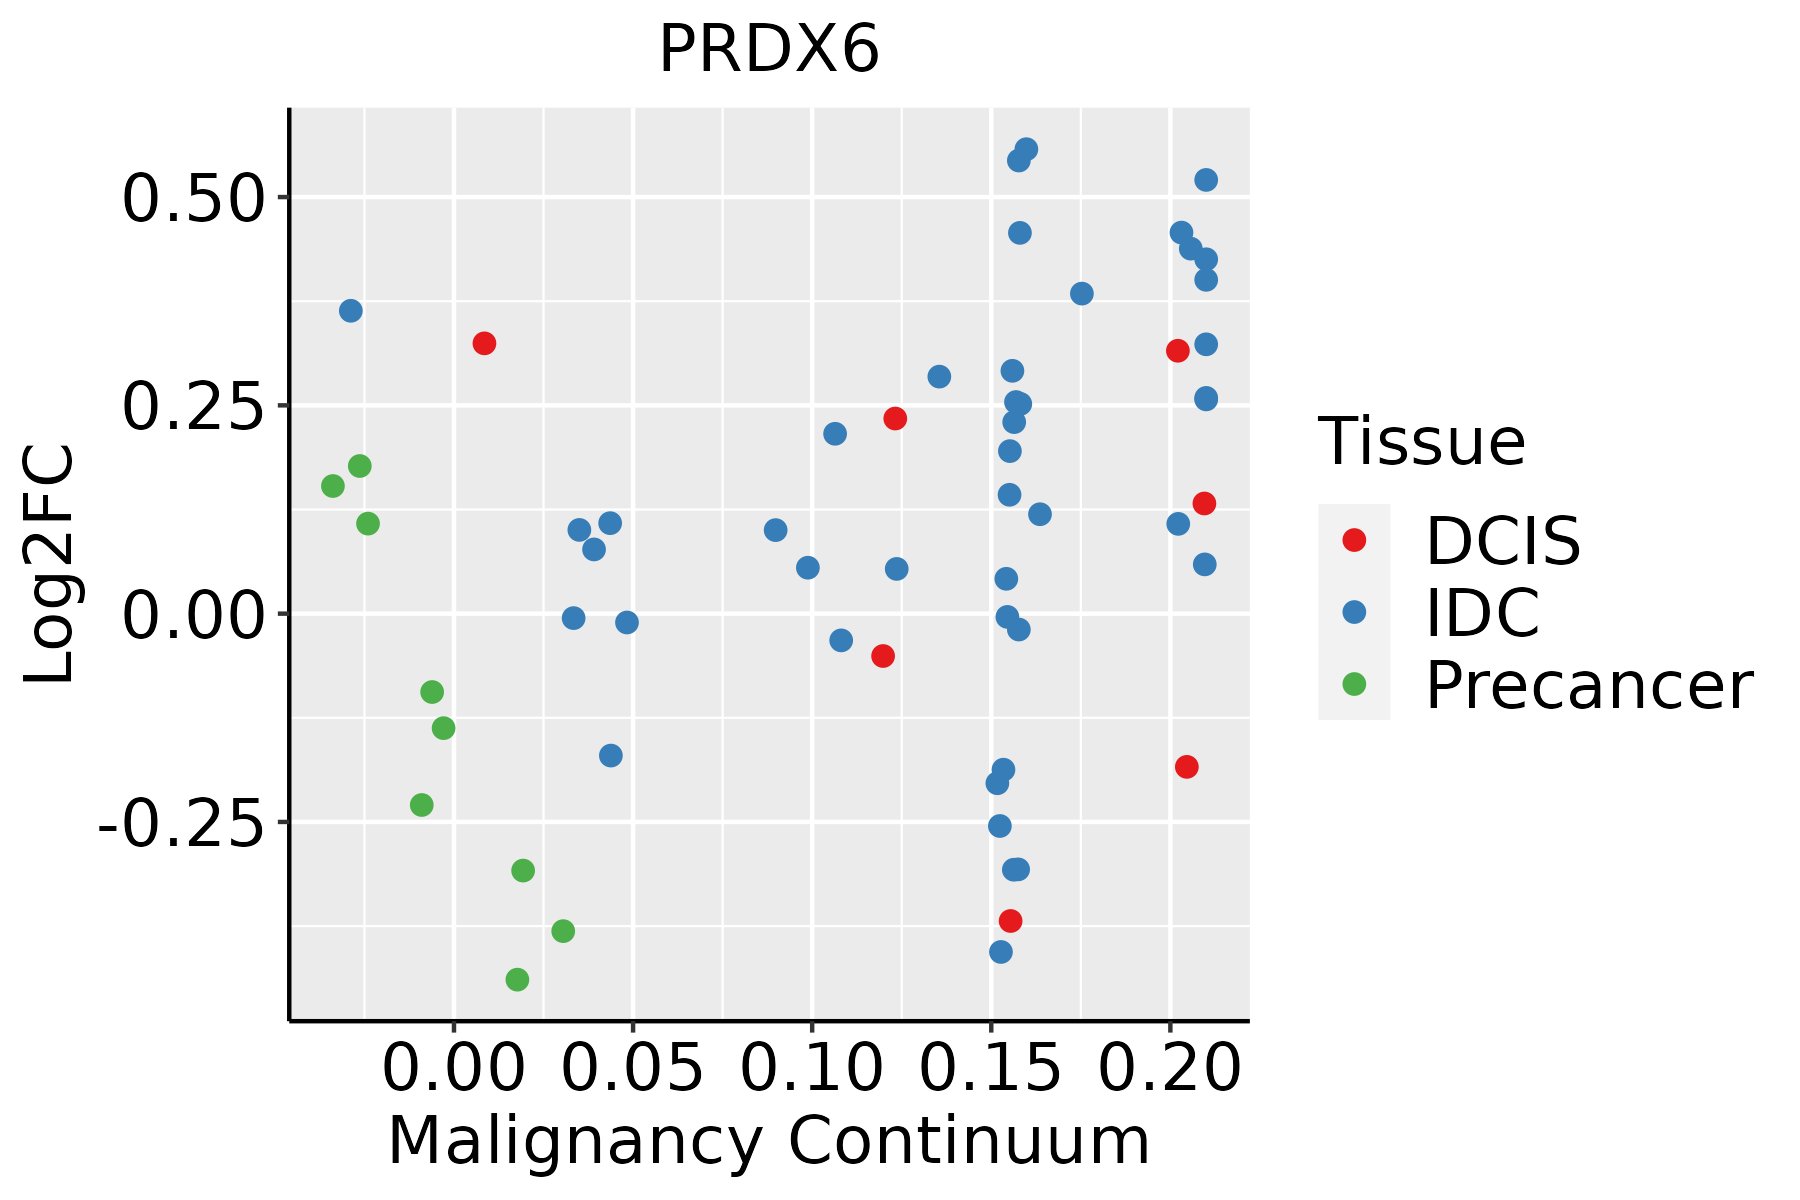 | IDC: Invasive ductal carcinoma |
| DCIS: Ductal carcinoma in situ | ||
| Precancer(BRCA1-mut): Precancerous lesion from BRCA1 mutation carriers | ||
| Cervix | 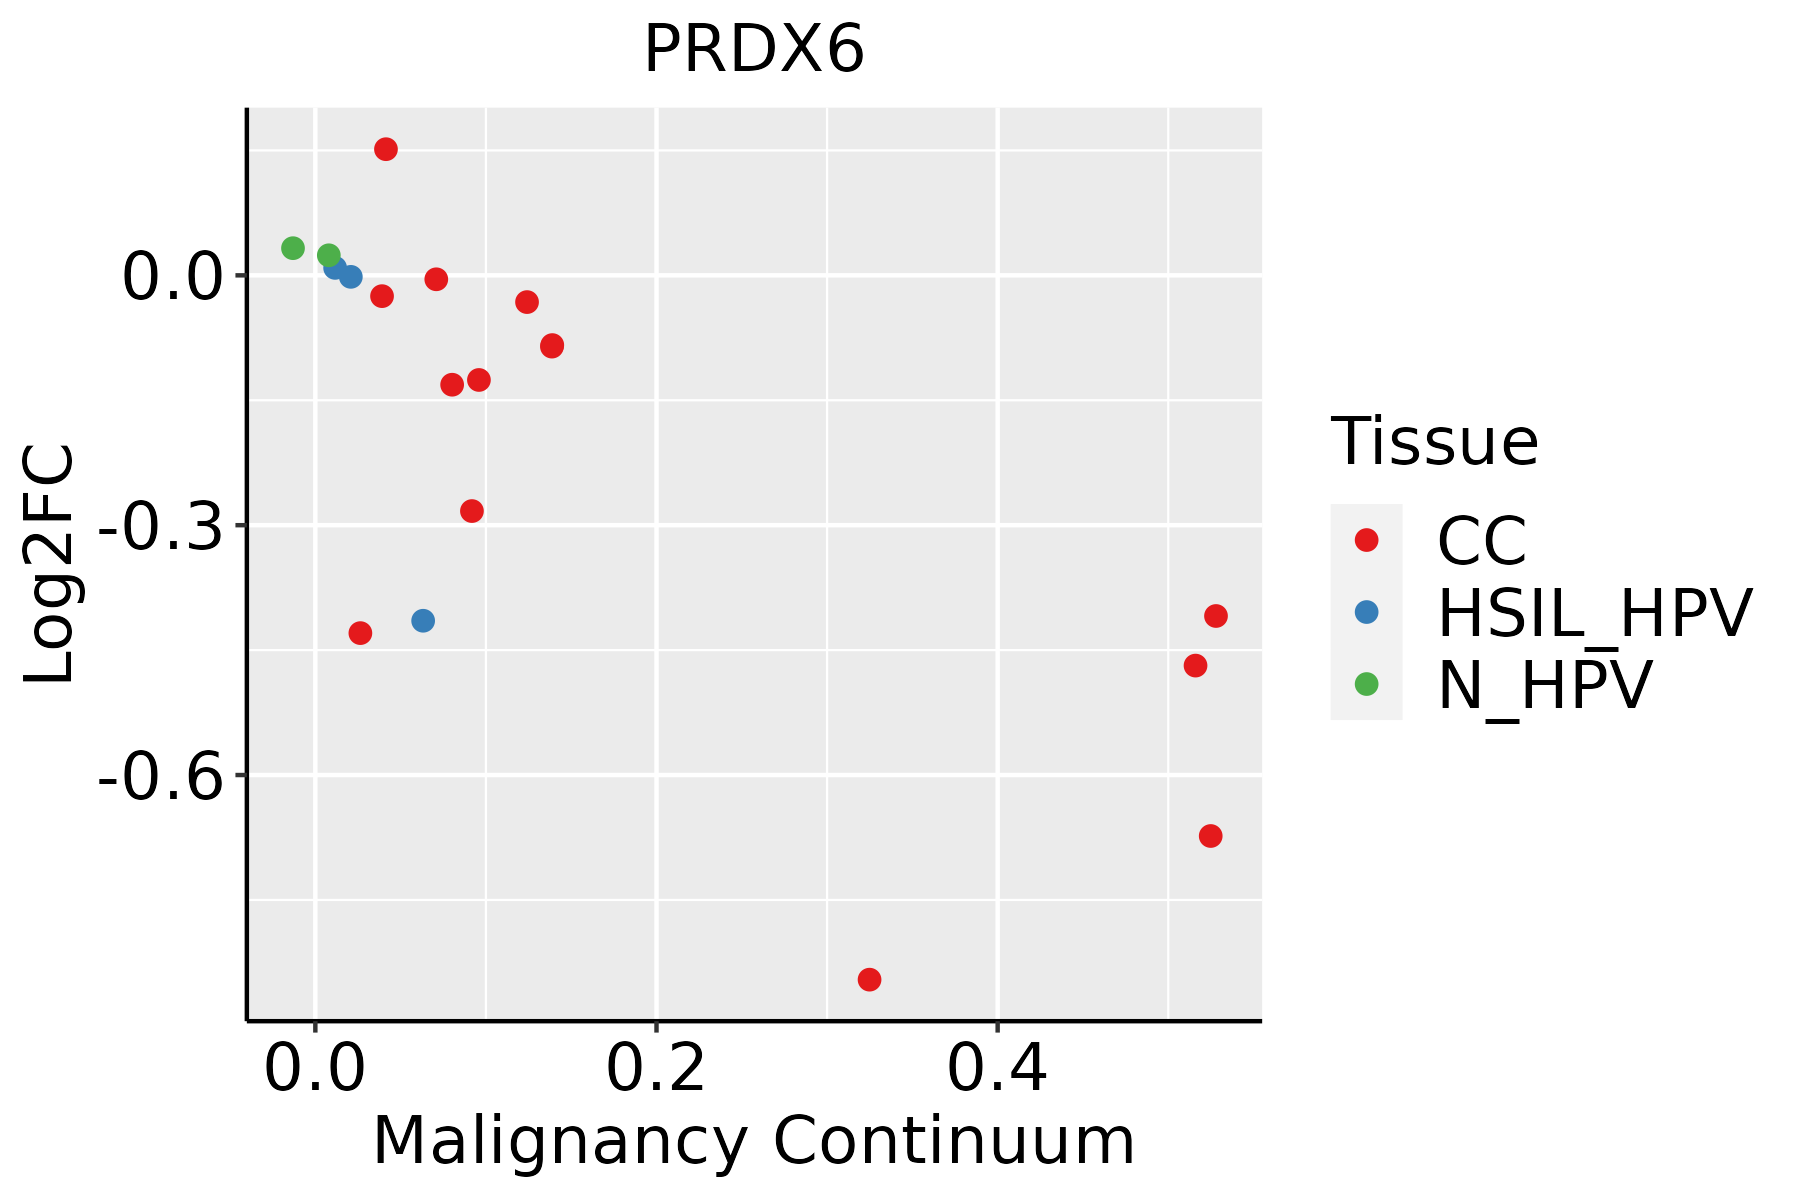 | CC: Cervix cancer |
| HSIL_HPV: HPV-infected high-grade squamous intraepithelial lesions | ||
| N_HPV: HPV-infected normal cervix | ||
| Colorectum (GSE201348) |  | FAP: Familial adenomatous polyposis |
| CRC: Colorectal cancer | ||
| Colorectum (HTA11) |  | AD: Adenomas |
| SER: Sessile serrated lesions | ||
| MSI-H: Microsatellite-high colorectal cancer | ||
| MSS: Microsatellite stable colorectal cancer | ||
| Endometrium |  | AEH: Atypical endometrial hyperplasia |
| EEC: Endometrioid Cancer | ||
| Esophagus | 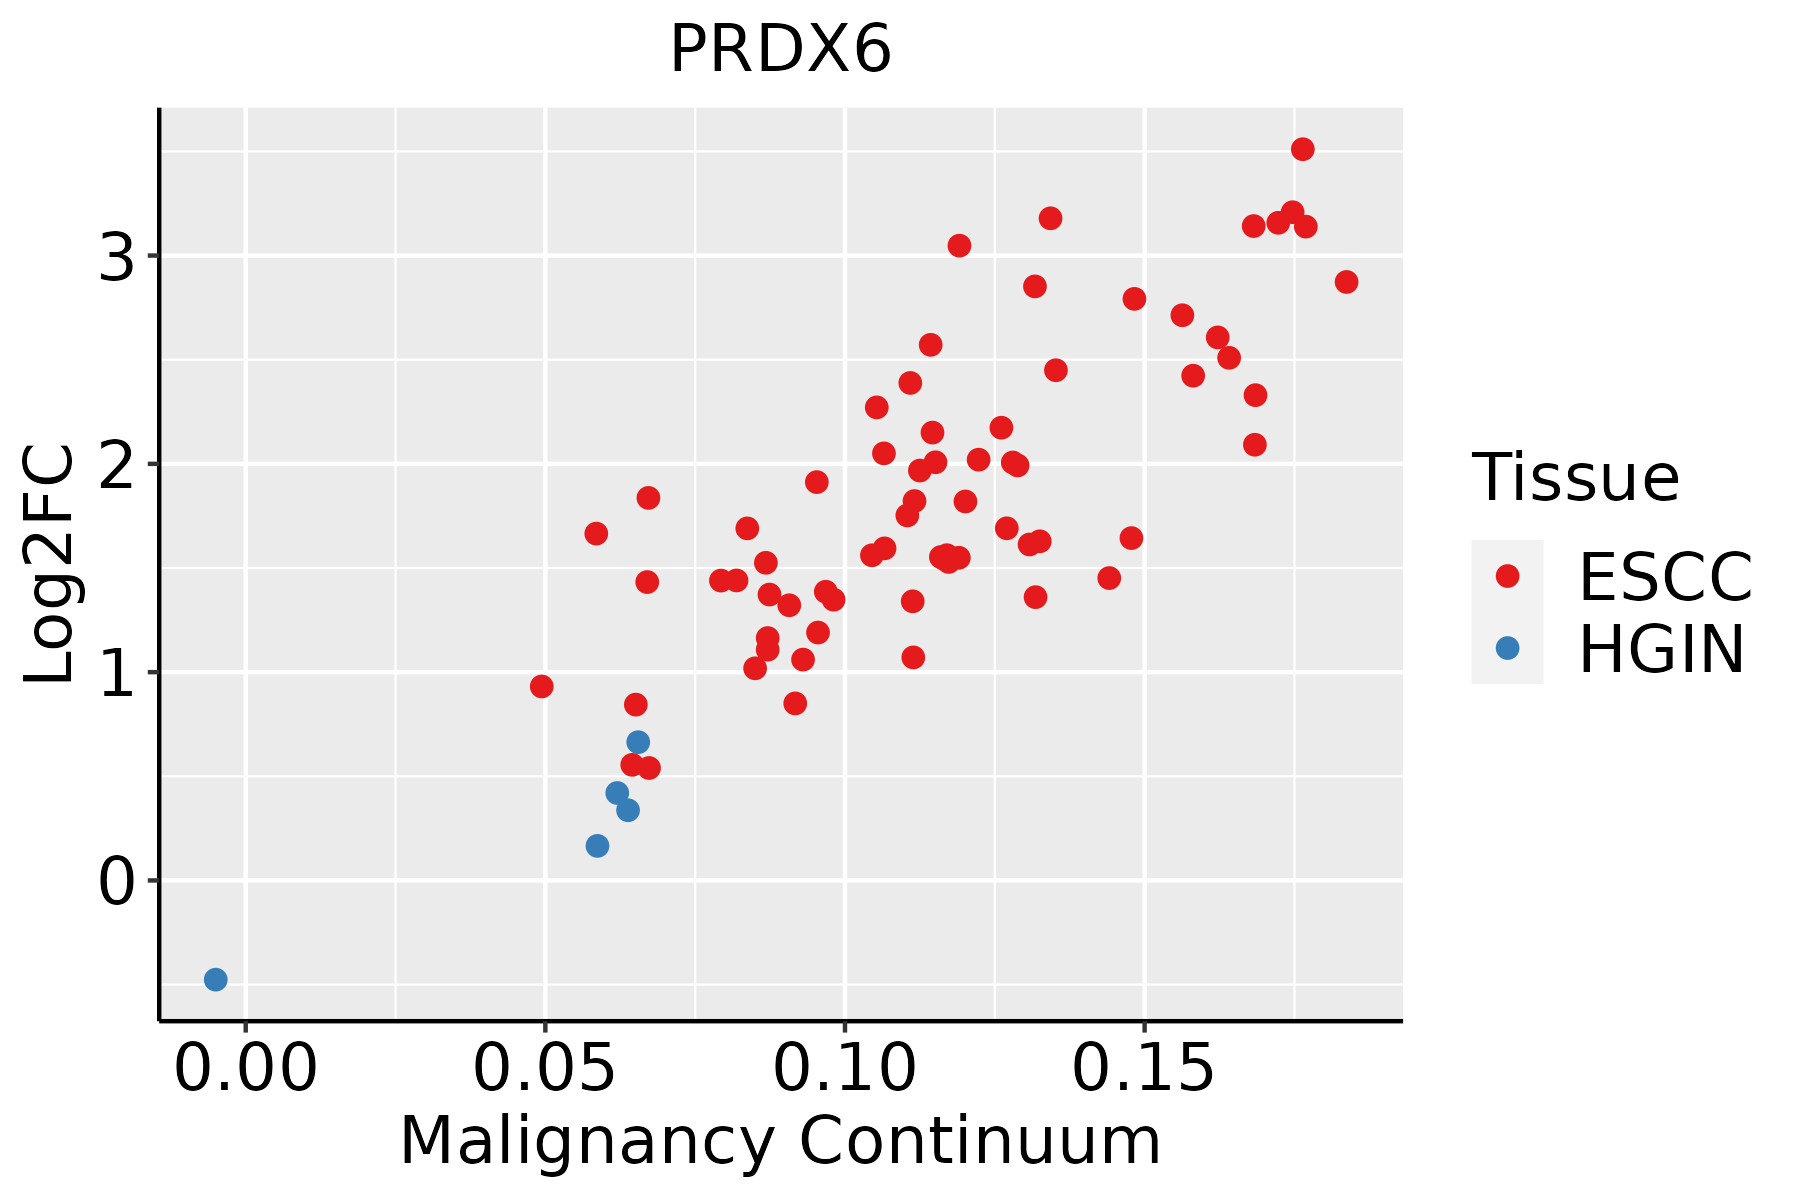 | ESCC: Esophageal squamous cell carcinoma |
| HGIN: High-grade intraepithelial neoplasias | ||
| LGIN: Low-grade intraepithelial neoplasias | ||
| Liver | 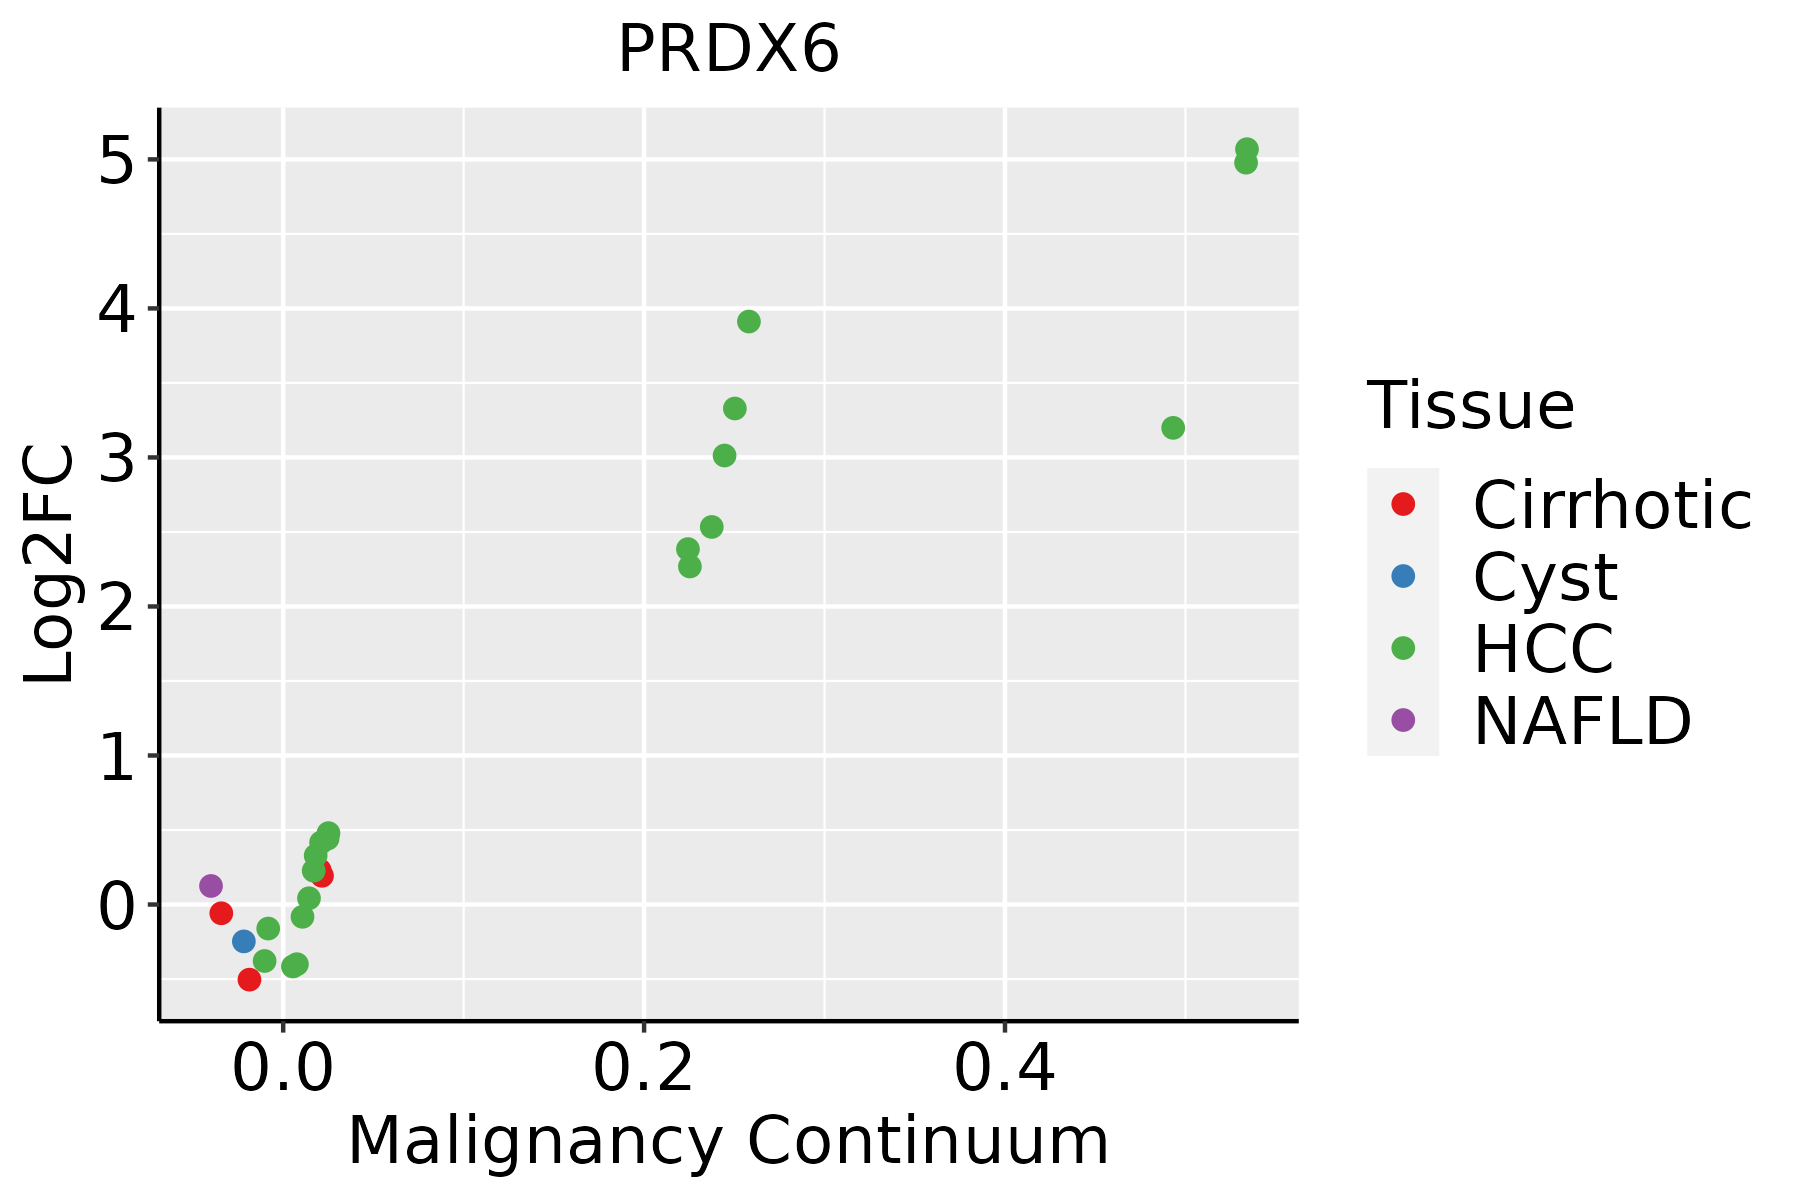 | HCC: Hepatocellular carcinoma |
| NAFLD: Non-alcoholic fatty liver disease | ||
| Oral Cavity |  | EOLP: Erosive Oral lichen planus |
| LP: leukoplakia | ||
| NEOLP: Non-erosive oral lichen planus | ||
| OSCC: Oral squamous cell carcinoma | ||
| Prostate | 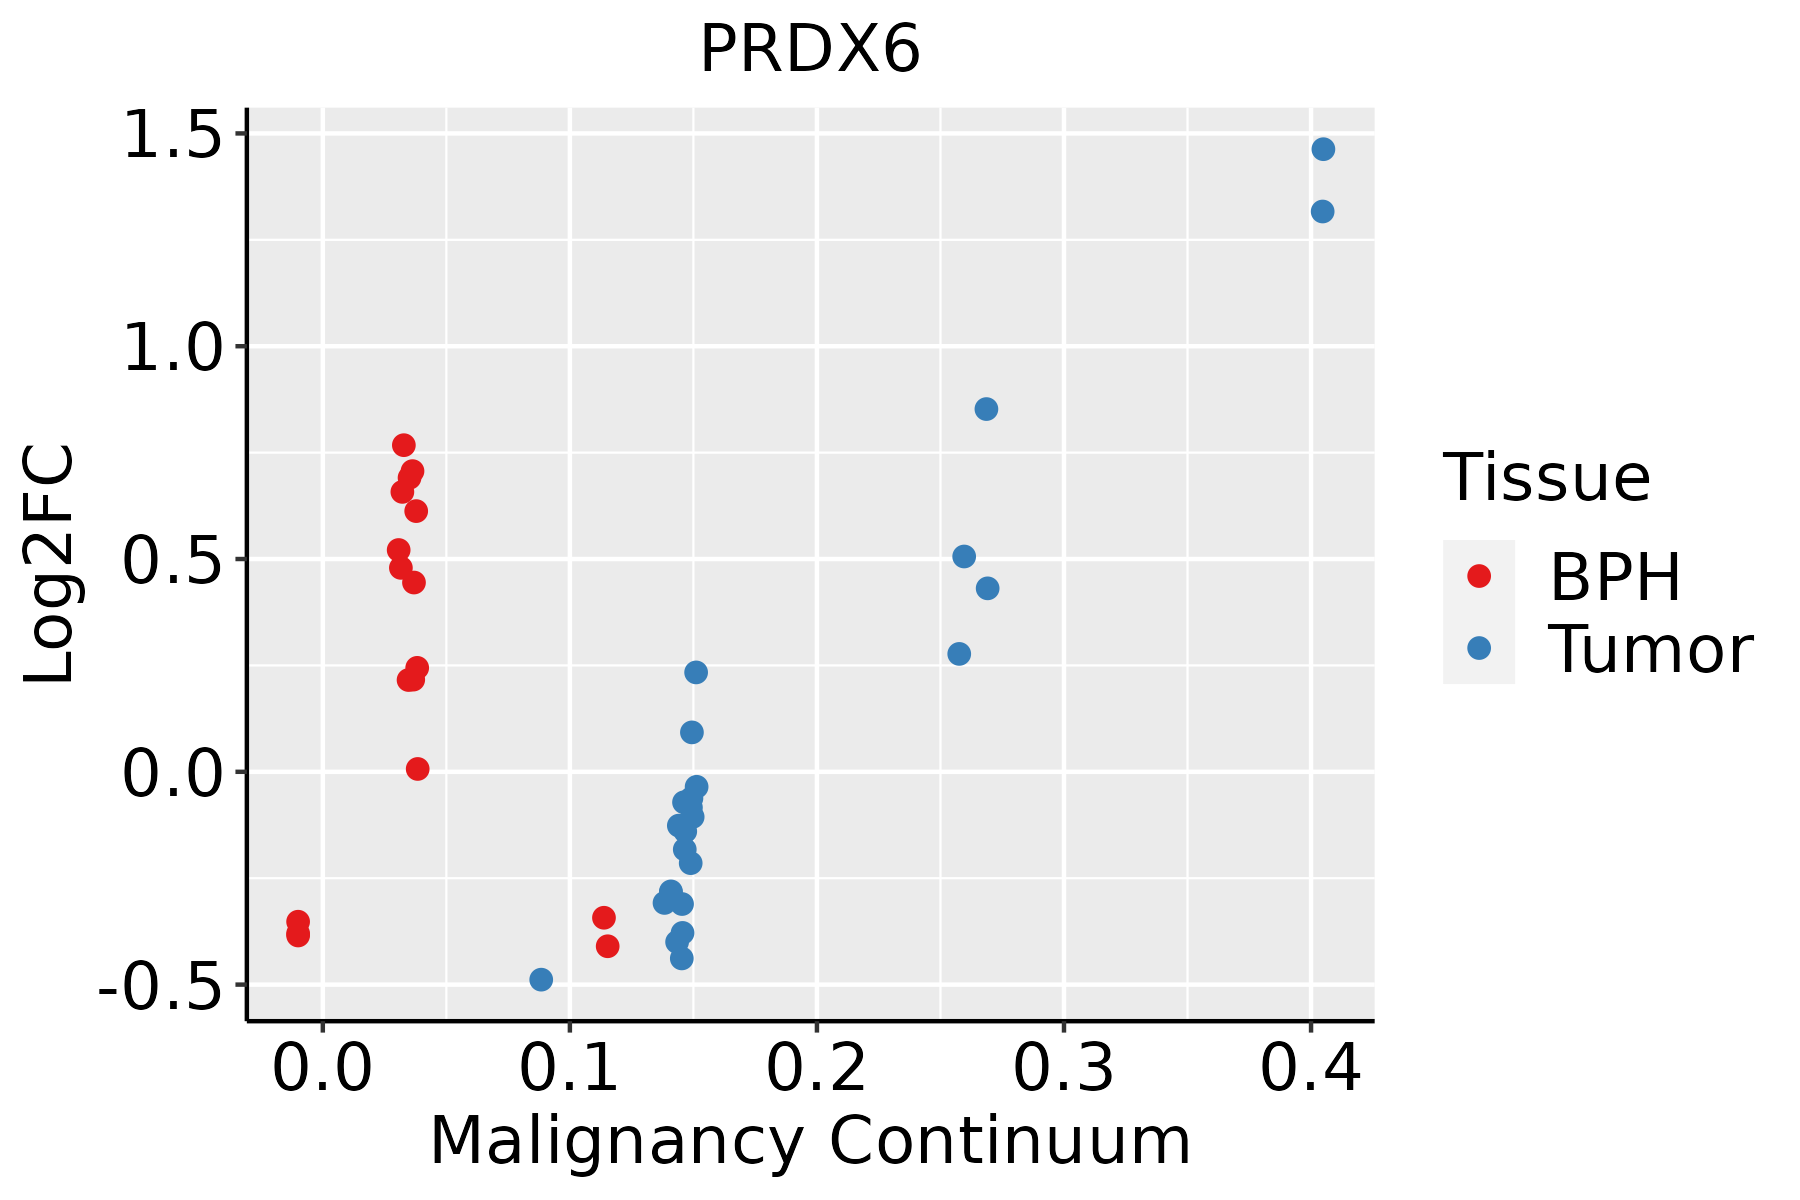 | BPH: Benign Prostatic Hyperplasia |
| Skin | 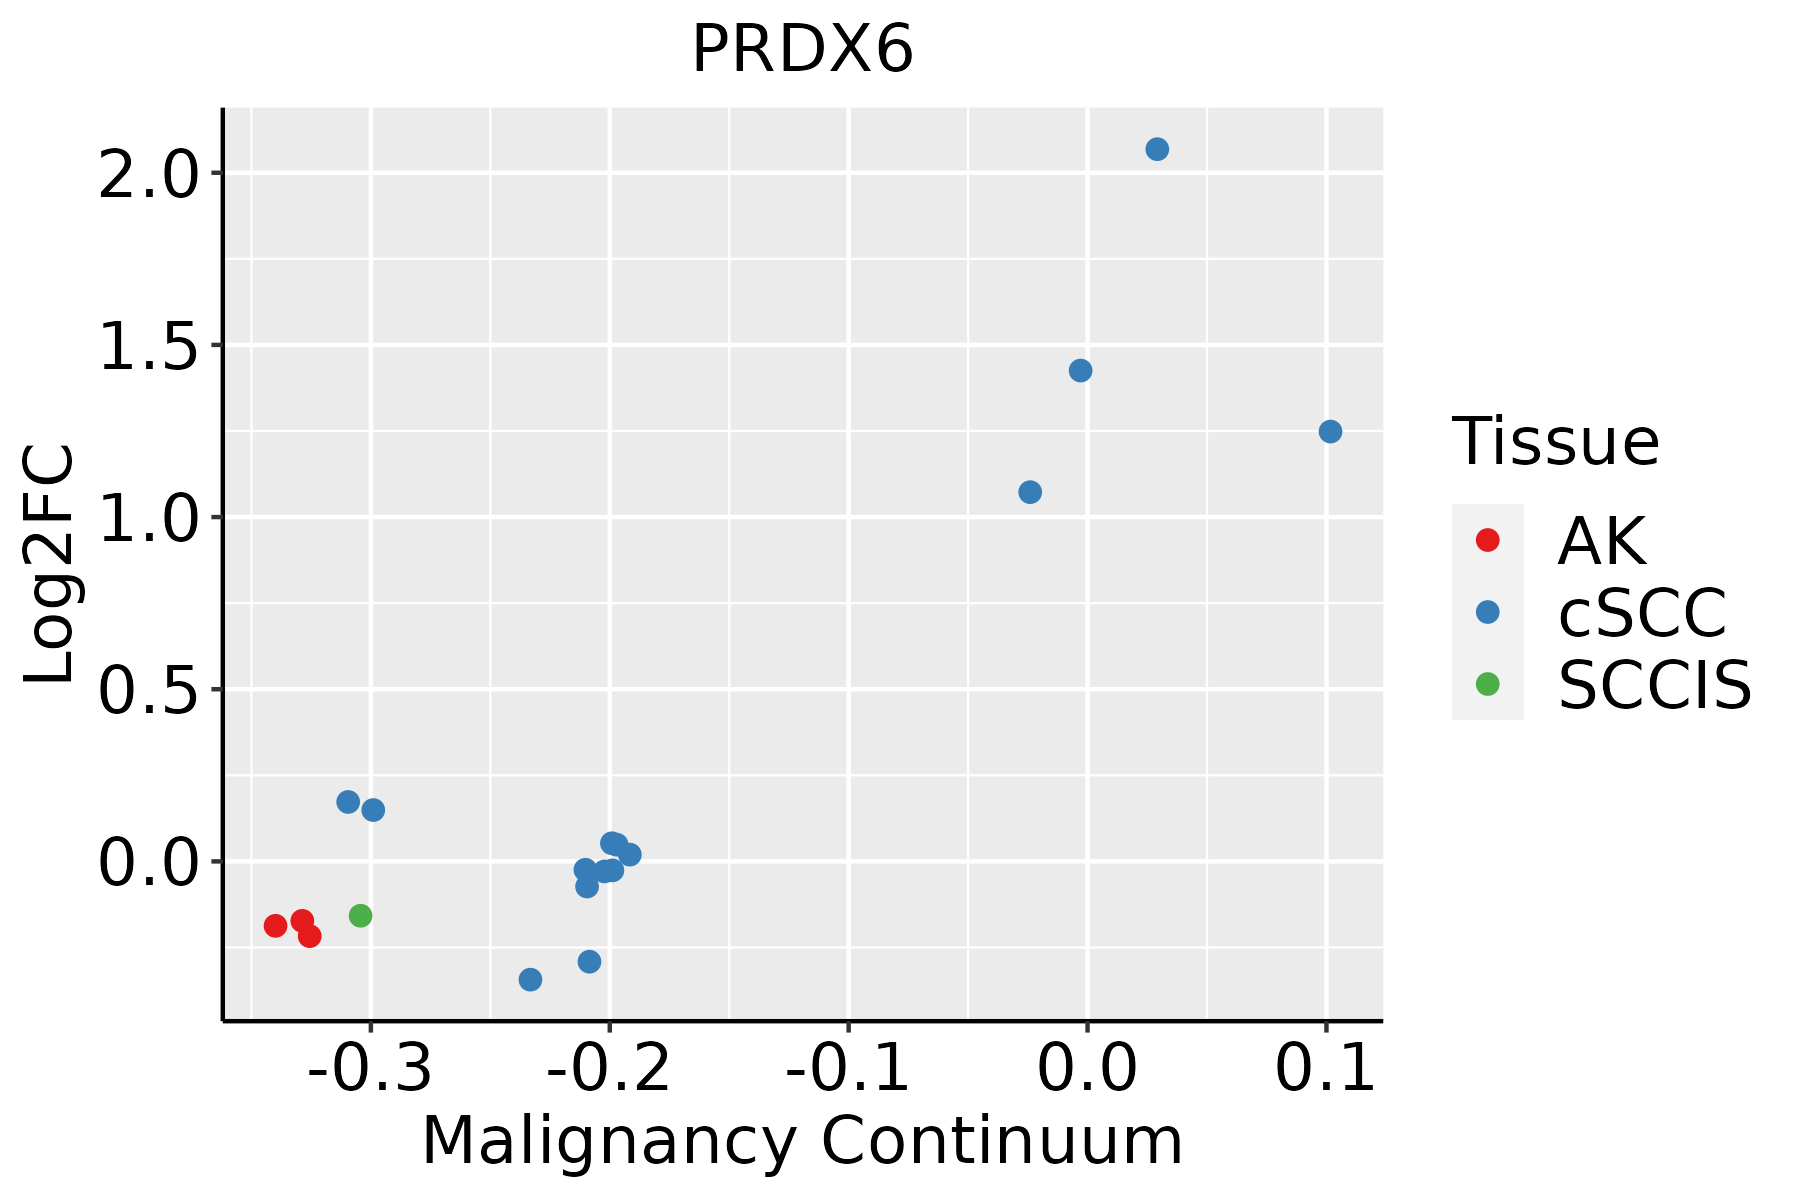 | AK: Actinic keratosis |
| cSCC: Cutaneous squamous cell carcinoma | ||
| SCCIS:squamous cell carcinoma in situ | ||
| Thyroid | 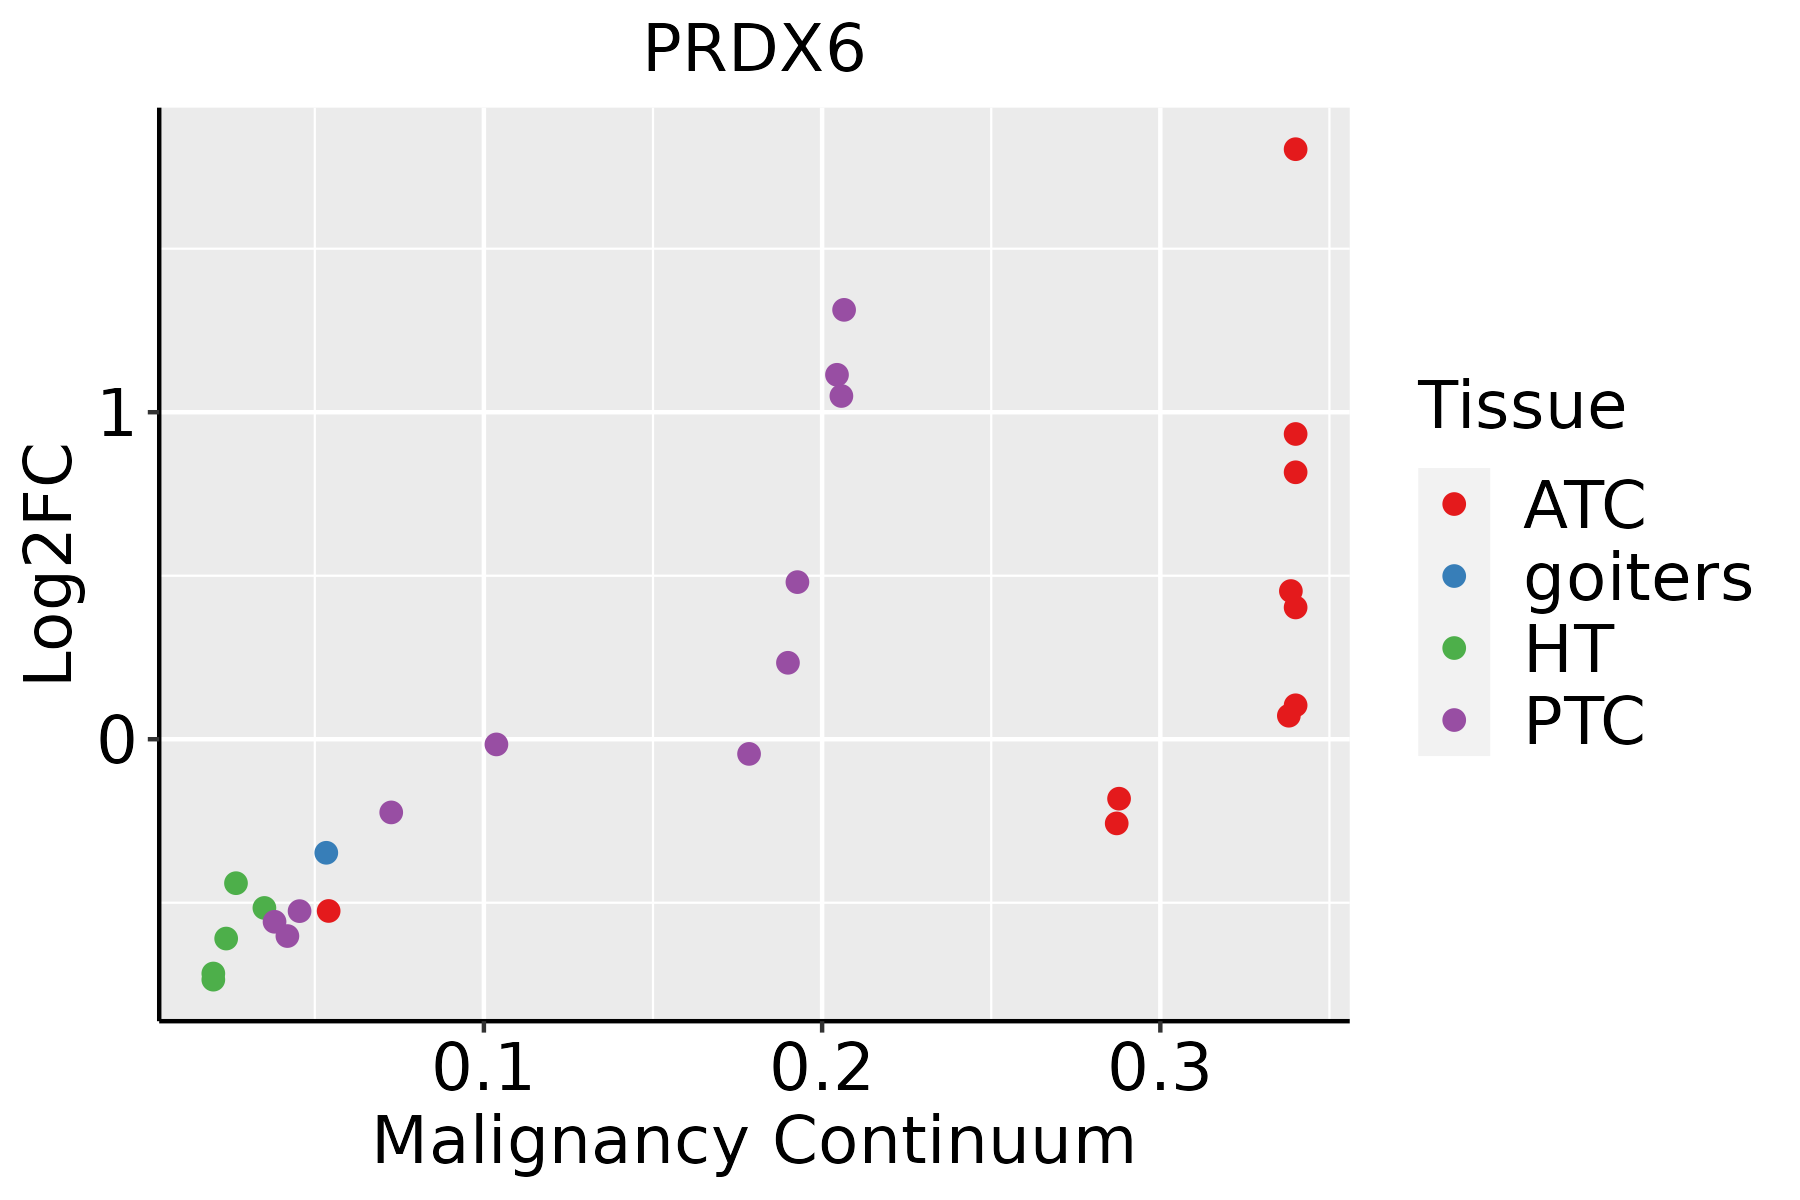 | ATC: Anaplastic thyroid cancer |
| HT: Hashimoto's thyroiditis | ||
| PTC: Papillary thyroid cancer |
| ∗log2FC in expression of this searched gene in stem-like cells from each diseased tissue sample relative to stem-like cells in normal samples in each tissue plotted against the malignancy continuum. Samples are colored based on if they are from different disease stage. |
Top |
Malignant transformation related pathway analysis |
| Find out the enriched GO biological processes and KEGG pathways involved in transition from healthy to precancer to cancer |
| Tissue | Disease Stage | Enriched GO biological Processes |
| Colorectum | AD |  |
| Colorectum | SER |  |
| Colorectum | MSS |  |
| Colorectum | MSI-H |  |
| Colorectum | FAP |  |
| ∗Top 15 enriched GO BP terms are showed in the bar plot of each disease state in each tissue. Each row represents a significant GO biological process which is colored according to the -log10(p.adjust). |
| Page: 1 2 3 4 5 6 7 8 9 |
| GO ID | Tissue | Disease Stage | Description | Gene Ratio | Bg Ratio | pvalue | p.adjust | Count |
| GO:000697914 | Breast | IDC | response to oxidative stress | 83/1434 | 446/18723 | 2.36e-14 | 7.06e-12 | 83 |
| GO:000838014 | Breast | IDC | RNA splicing | 73/1434 | 434/18723 | 1.27e-10 | 1.57e-08 | 73 |
| GO:004348414 | Breast | IDC | regulation of RNA splicing | 36/1434 | 148/18723 | 3.32e-10 | 3.77e-08 | 36 |
| GO:000037514 | Breast | IDC | RNA splicing, via transesterification reactions | 58/1434 | 324/18723 | 9.44e-10 | 9.58e-08 | 58 |
| GO:000037714 | Breast | IDC | RNA splicing, via transesterification reactions with bulged adenosine as nucleophile | 57/1434 | 320/18723 | 1.60e-09 | 1.49e-07 | 57 |
| GO:000039814 | Breast | IDC | mRNA splicing, via spliceosome | 57/1434 | 320/18723 | 1.60e-09 | 1.49e-07 | 57 |
| GO:000963613 | Breast | IDC | response to toxic substance | 44/1434 | 262/18723 | 6.33e-07 | 3.00e-05 | 44 |
| GO:004802414 | Breast | IDC | regulation of mRNA splicing, via spliceosome | 23/1434 | 101/18723 | 1.74e-06 | 7.28e-05 | 23 |
| GO:009875413 | Breast | IDC | detoxification | 29/1434 | 152/18723 | 3.97e-06 | 1.43e-04 | 29 |
| GO:004545413 | Breast | IDC | cell redox homeostasis | 12/1434 | 35/18723 | 6.17e-06 | 1.97e-04 | 12 |
| GO:009886913 | Breast | IDC | cellular oxidant detoxification | 22/1434 | 101/18723 | 6.31e-06 | 1.98e-04 | 22 |
| GO:199074813 | Breast | IDC | cellular detoxification | 23/1434 | 116/18723 | 2.02e-05 | 4.92e-04 | 23 |
| GO:009723713 | Breast | IDC | cellular response to toxic substance | 24/1434 | 124/18723 | 2.05e-05 | 4.97e-04 | 24 |
| GO:007259313 | Breast | IDC | reactive oxygen species metabolic process | 36/1434 | 239/18723 | 7.16e-05 | 1.43e-03 | 36 |
| GO:005068413 | Breast | IDC | regulation of mRNA processing | 24/1434 | 137/18723 | 1.09e-04 | 2.04e-03 | 24 |
| GO:190331113 | Breast | IDC | regulation of mRNA metabolic process | 40/1434 | 288/18723 | 1.79e-04 | 3.01e-03 | 40 |
| GO:003312014 | Breast | IDC | positive regulation of RNA splicing | 10/1434 | 37/18723 | 3.45e-04 | 5.07e-03 | 10 |
| GO:004274311 | Breast | IDC | hydrogen peroxide metabolic process | 12/1434 | 58/18723 | 1.27e-03 | 1.35e-02 | 12 |
| GO:004802613 | Breast | IDC | positive regulation of mRNA splicing, via spliceosome | 6/1434 | 22/18723 | 5.12e-03 | 3.82e-02 | 6 |
| GO:000697924 | Breast | DCIS | response to oxidative stress | 82/1390 | 446/18723 | 1.22e-14 | 3.85e-12 | 82 |
| Page: 1 2 3 4 5 6 7 8 9 10 11 12 13 14 15 16 17 18 19 20 21 22 23 24 |
| Pathway ID | Tissue | Disease Stage | Description | Gene Ratio | Bg Ratio | pvalue | p.adjust | qvalue | Count |
| hsa0048023 | Breast | IDC | Glutathione metabolism | 13/867 | 57/8465 | 4.25e-03 | 2.56e-02 | 1.91e-02 | 13 |
| hsa0048033 | Breast | IDC | Glutathione metabolism | 13/867 | 57/8465 | 4.25e-03 | 2.56e-02 | 1.91e-02 | 13 |
| hsa0048041 | Breast | DCIS | Glutathione metabolism | 13/846 | 57/8465 | 3.44e-03 | 1.98e-02 | 1.46e-02 | 13 |
| hsa0048051 | Breast | DCIS | Glutathione metabolism | 13/846 | 57/8465 | 3.44e-03 | 1.98e-02 | 1.46e-02 | 13 |
| hsa00480 | Colorectum | AD | Glutathione metabolism | 23/2092 | 57/8465 | 6.52e-03 | 2.76e-02 | 1.76e-02 | 23 |
| hsa004801 | Colorectum | AD | Glutathione metabolism | 23/2092 | 57/8465 | 6.52e-03 | 2.76e-02 | 1.76e-02 | 23 |
| hsa004802 | Colorectum | MSS | Glutathione metabolism | 22/1875 | 57/8465 | 3.58e-03 | 1.64e-02 | 1.01e-02 | 22 |
| hsa004803 | Colorectum | MSS | Glutathione metabolism | 22/1875 | 57/8465 | 3.58e-03 | 1.64e-02 | 1.01e-02 | 22 |
| hsa0048018 | Esophagus | ESCC | Glutathione metabolism | 44/4205 | 57/8465 | 1.81e-05 | 9.03e-05 | 4.63e-05 | 44 |
| hsa0048019 | Esophagus | ESCC | Glutathione metabolism | 44/4205 | 57/8465 | 1.81e-05 | 9.03e-05 | 4.63e-05 | 44 |
| hsa004809 | Liver | Cirrhotic | Glutathione metabolism | 30/2530 | 57/8465 | 2.63e-04 | 1.72e-03 | 1.06e-03 | 30 |
| hsa0048012 | Liver | Cirrhotic | Glutathione metabolism | 30/2530 | 57/8465 | 2.63e-04 | 1.72e-03 | 1.06e-03 | 30 |
| hsa0048022 | Liver | HCC | Glutathione metabolism | 42/4020 | 57/8465 | 5.00e-05 | 2.62e-04 | 1.46e-04 | 42 |
| hsa0048032 | Liver | HCC | Glutathione metabolism | 42/4020 | 57/8465 | 5.00e-05 | 2.62e-04 | 1.46e-04 | 42 |
| hsa0048016 | Oral cavity | OSCC | Glutathione metabolism | 36/3704 | 57/8465 | 2.41e-03 | 6.41e-03 | 3.26e-03 | 36 |
| hsa0048017 | Oral cavity | OSCC | Glutathione metabolism | 36/3704 | 57/8465 | 2.41e-03 | 6.41e-03 | 3.26e-03 | 36 |
| hsa0048024 | Oral cavity | LP | Glutathione metabolism | 25/2418 | 57/8465 | 9.58e-03 | 3.47e-02 | 2.24e-02 | 25 |
| hsa0048034 | Oral cavity | LP | Glutathione metabolism | 25/2418 | 57/8465 | 9.58e-03 | 3.47e-02 | 2.24e-02 | 25 |
| hsa0048014 | Prostate | Tumor | Glutathione metabolism | 20/1791 | 57/8465 | 1.05e-02 | 3.33e-02 | 2.07e-02 | 20 |
| hsa0048015 | Prostate | Tumor | Glutathione metabolism | 20/1791 | 57/8465 | 1.05e-02 | 3.33e-02 | 2.07e-02 | 20 |
| Page: 1 |
Top |
Cell-cell communication analysis |
| Identification of potential cell-cell interactions between two cell types and their ligand-receptor pairs for different disease states |
| Ligand | Receptor | LRpair | Pathway | Tissue | Disease Stage |
| Page: 1 |
Top |
Single-cell gene regulatory network inference analysis |
| Find out the significant the regulons (TFs) and the target genes of each regulon across cell types for different disease states |
| TF | Cell Type | Tissue | Disease Stage | Target Gene | RSS | Regulon Activity |
| ∗The dot plots of a searched regulon are shown for all cell subpopulations in each disease state of each tissue based on the regulon specific score inferred using pySCENIC and by calculating the average expression. |
| Page: 1 |
Top |
Somatic mutation of malignant transformation related genes |
| Annotation of somatic variants for genes involved in malignant transformation |
| Hugo Symbol | Variant Class | Variant Classification | dbSNP RS | HGVSc | HGVSp | HGVSp Short | SWISSPROT | BIOTYPE | SIFT | PolyPhen | Tumor Sample Barcode | Tissue | Histology | Sex | Age | Stage | Therapy Types | Drugs | Outcome |
| PRDX6 | SNV | Missense_Mutation | novel | c.348N>T | p.Met116Ile | p.M116I | P30041 | protein_coding | deleterious(0.04) | possibly_damaging(0.62) | TCGA-BH-A6R8-01 | Breast | breast invasive carcinoma | Female | <65 | I/II | Unknown | Unknown | SD |
| PRDX6 | SNV | Missense_Mutation | novel | c.101N>A | p.Gly34Asp | p.G34D | P30041 | protein_coding | tolerated(0.07) | possibly_damaging(0.714) | TCGA-S3-AA17-01 | Breast | breast invasive carcinoma | Female | <65 | I/II | Hormone Therapy | anastrozole | SD |
| PRDX6 | deletion | Frame_Shift_Del | novel | c.293delT | p.Leu98TyrfsTer32 | p.L98Yfs*32 | P30041 | protein_coding | TCGA-EW-A2FV-01 | Breast | breast invasive carcinoma | Female | <65 | III/IV | Chemotherapy | docetaxel | SD | ||
| PRDX6 | SNV | Missense_Mutation | c.314A>G | p.Asp105Gly | p.D105G | P30041 | protein_coding | deleterious(0.04) | possibly_damaging(0.867) | TCGA-AA-A00N-01 | Colorectum | colon adenocarcinoma | Male | >=65 | I/II | Unknown | Unknown | PD | |
| PRDX6 | SNV | Missense_Mutation | c.394C>T | p.Arg132Cys | p.R132C | P30041 | protein_coding | deleterious(0.01) | probably_damaging(0.995) | TCGA-AZ-4315-01 | Colorectum | colon adenocarcinoma | Male | <65 | I/II | Unknown | Unknown | SD | |
| PRDX6 | SNV | Missense_Mutation | c.451G>A | p.Ala151Thr | p.A151T | P30041 | protein_coding | deleterious(0.01) | possibly_damaging(0.506) | TCGA-AF-6672-01 | Colorectum | rectum adenocarcinoma | Male | <65 | III/IV | Ancillary | leucovorin | PD | |
| PRDX6 | SNV | Missense_Mutation | novel | c.481N>A | p.Leu161Ile | p.L161I | P30041 | protein_coding | tolerated(0.11) | benign(0.313) | TCGA-EI-6917-01 | Colorectum | rectum adenocarcinoma | Male | <65 | III/IV | Chemotherapy | 5fluorouracil+oxaciplatina+l-folinian | SD |
| PRDX6 | SNV | Missense_Mutation | novel | c.173C>T | p.Ala58Val | p.A58V | P30041 | protein_coding | tolerated(0.16) | benign(0.031) | TCGA-AP-A051-01 | Endometrium | uterine corpus endometrioid carcinoma | Female | >=65 | I/II | Unknown | Unknown | SD |
| PRDX6 | SNV | Missense_Mutation | c.477G>T | p.Glu159Asp | p.E159D | P30041 | protein_coding | deleterious(0.03) | benign(0.099) | TCGA-AP-A051-01 | Endometrium | uterine corpus endometrioid carcinoma | Female | >=65 | I/II | Unknown | Unknown | SD | |
| PRDX6 | SNV | Missense_Mutation | c.656G>A | p.Arg219His | p.R219H | P30041 | protein_coding | tolerated(0.05) | benign(0.193) | TCGA-AP-A056-01 | Endometrium | uterine corpus endometrioid carcinoma | Female | <65 | I/II | Unknown | Unknown | SD |
| Page: 1 2 3 4 |
Top |
Related drugs of malignant transformation related genes |
| Identification of chemicals and drugs interact with genes involved in malignant transfromation |
| (DGIdb 4.0) |
| Entrez ID | Symbol | Category | Interaction Types | Drug Claim Name | Drug Name | PMIDs |
| Page: 1 |

Copyright 2023-Present -The University of Texas Health Science Center at Houston |