
|
|||||
|
 | |
| |
| |
| |
| |
| |
|
Gene: PRDX1 |
Gene summary for PRDX1 |
| Gene information | Species | Human | Gene symbol | PRDX1 | Gene ID | 5052 |
| Gene name | peroxiredoxin 1 | |
| Gene Alias | MSP23 | |
| Cytomap | 1p34.1 | |
| Gene Type | protein-coding | GO ID | GO:0000165 | UniProtAcc | Q06830 |
Top |
Malignant transformation analysis |
| Identification of the aberrant gene expression in precancerous and cancerous lesions by comparing the gene expression of stem-like cells in diseased tissues with normal stem cells |
| Entrez ID | Symbol | Replicates | Species | Organ | Tissue | Adj P-value | Log2FC | Malignancy |
| 5052 | PRDX1 | GSM4909281 | Human | Breast | IDC | 9.05e-09 | 3.12e-01 | 0.21 |
| 5052 | PRDX1 | GSM4909282 | Human | Breast | IDC | 1.60e-27 | 4.41e-01 | -0.0288 |
| 5052 | PRDX1 | GSM4909285 | Human | Breast | IDC | 1.75e-87 | 7.42e-01 | 0.21 |
| 5052 | PRDX1 | GSM4909286 | Human | Breast | IDC | 5.12e-03 | 3.07e-02 | 0.1081 |
| 5052 | PRDX1 | GSM4909287 | Human | Breast | IDC | 4.10e-12 | 3.40e-01 | 0.2057 |
| 5052 | PRDX1 | GSM4909288 | Human | Breast | IDC | 1.92e-06 | 3.46e-01 | 0.0988 |
| 5052 | PRDX1 | GSM4909290 | Human | Breast | IDC | 4.92e-05 | 3.47e-01 | 0.2096 |
| 5052 | PRDX1 | GSM4909293 | Human | Breast | IDC | 3.40e-06 | 2.59e-01 | 0.1581 |
| 5052 | PRDX1 | GSM4909294 | Human | Breast | IDC | 2.85e-29 | 3.27e-01 | 0.2022 |
| 5052 | PRDX1 | GSM4909296 | Human | Breast | IDC | 1.30e-23 | 3.76e-01 | 0.1524 |
| 5052 | PRDX1 | GSM4909297 | Human | Breast | IDC | 7.58e-21 | -1.05e-01 | 0.1517 |
| 5052 | PRDX1 | GSM4909304 | Human | Breast | IDC | 2.60e-90 | 7.57e-01 | 0.1636 |
| 5052 | PRDX1 | GSM4909306 | Human | Breast | IDC | 2.46e-07 | 2.80e-01 | 0.1564 |
| 5052 | PRDX1 | GSM4909308 | Human | Breast | IDC | 7.27e-10 | -1.11e-01 | 0.158 |
| 5052 | PRDX1 | GSM4909311 | Human | Breast | IDC | 4.87e-44 | -2.04e-01 | 0.1534 |
| 5052 | PRDX1 | GSM4909312 | Human | Breast | IDC | 3.65e-14 | 1.75e-01 | 0.1552 |
| 5052 | PRDX1 | GSM4909313 | Human | Breast | IDC | 5.96e-04 | -3.83e-01 | 0.0391 |
| 5052 | PRDX1 | GSM4909315 | Human | Breast | IDC | 4.70e-60 | 5.96e-01 | 0.21 |
| 5052 | PRDX1 | GSM4909316 | Human | Breast | IDC | 5.73e-26 | 7.08e-01 | 0.21 |
| 5052 | PRDX1 | GSM4909319 | Human | Breast | IDC | 6.31e-58 | -7.78e-02 | 0.1563 |
| Page: 1 2 3 4 5 6 7 8 9 10 11 12 13 14 15 |
| Tissue | Expression Dynamics | Abbreviation |
| Breast |  | IDC: Invasive ductal carcinoma |
| DCIS: Ductal carcinoma in situ | ||
| Precancer(BRCA1-mut): Precancerous lesion from BRCA1 mutation carriers | ||
| Cervix |  | CC: Cervix cancer |
| HSIL_HPV: HPV-infected high-grade squamous intraepithelial lesions | ||
| N_HPV: HPV-infected normal cervix | ||
| Endometrium |  | AEH: Atypical endometrial hyperplasia |
| EEC: Endometrioid Cancer | ||
| Esophagus |  | ESCC: Esophageal squamous cell carcinoma |
| HGIN: High-grade intraepithelial neoplasias | ||
| LGIN: Low-grade intraepithelial neoplasias | ||
| GC |  | CAG: Chronic atrophic gastritis |
| CAG with IM: Chronic atrophic gastritis with intestinal metaplasia | ||
| CSG: Chronic superficial gastritis | ||
| GC: Gastric cancer | ||
| SIM: Severe intestinal metaplasia | ||
| WIM: Wild intestinal metaplasia | ||
| Liver |  | HCC: Hepatocellular carcinoma |
| NAFLD: Non-alcoholic fatty liver disease | ||
| Oral Cavity | 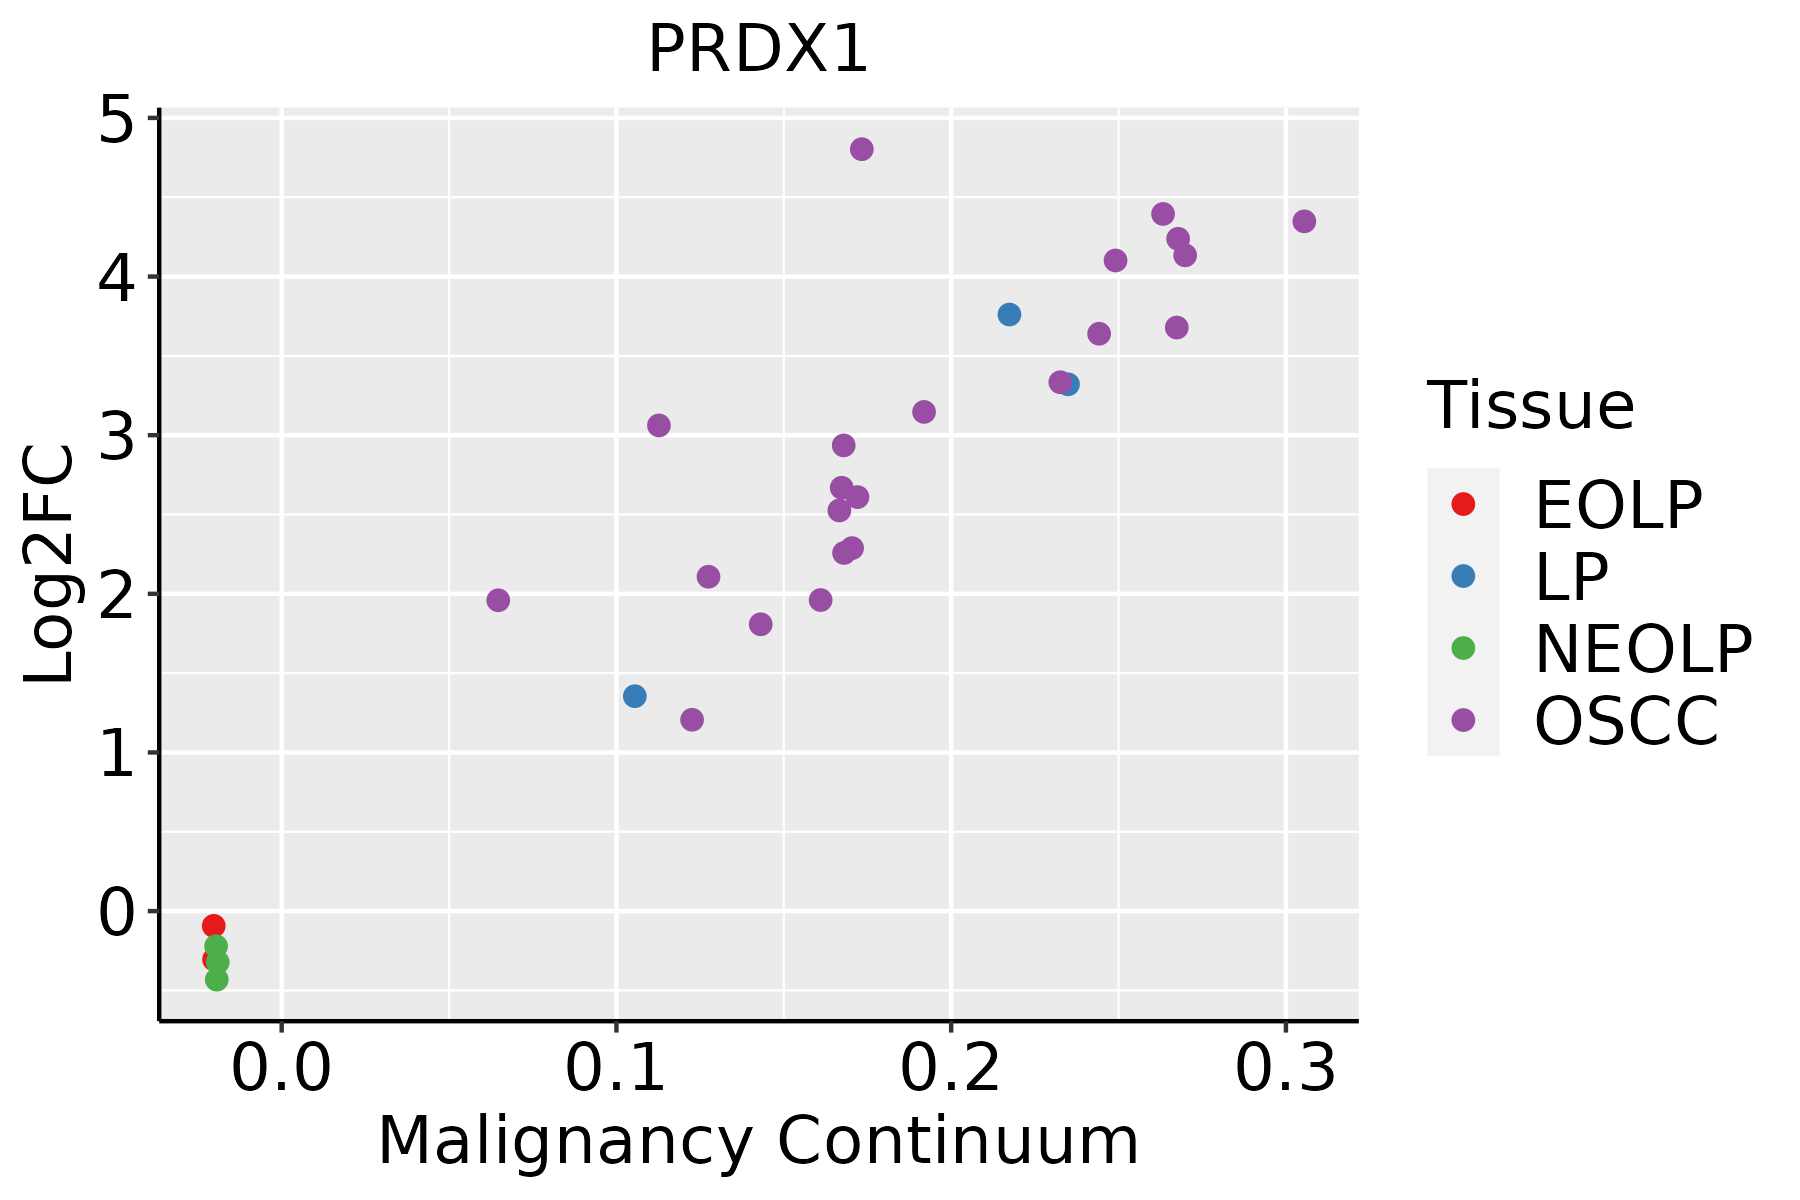 | EOLP: Erosive Oral lichen planus |
| LP: leukoplakia | ||
| NEOLP: Non-erosive oral lichen planus | ||
| OSCC: Oral squamous cell carcinoma | ||
| Prostate | 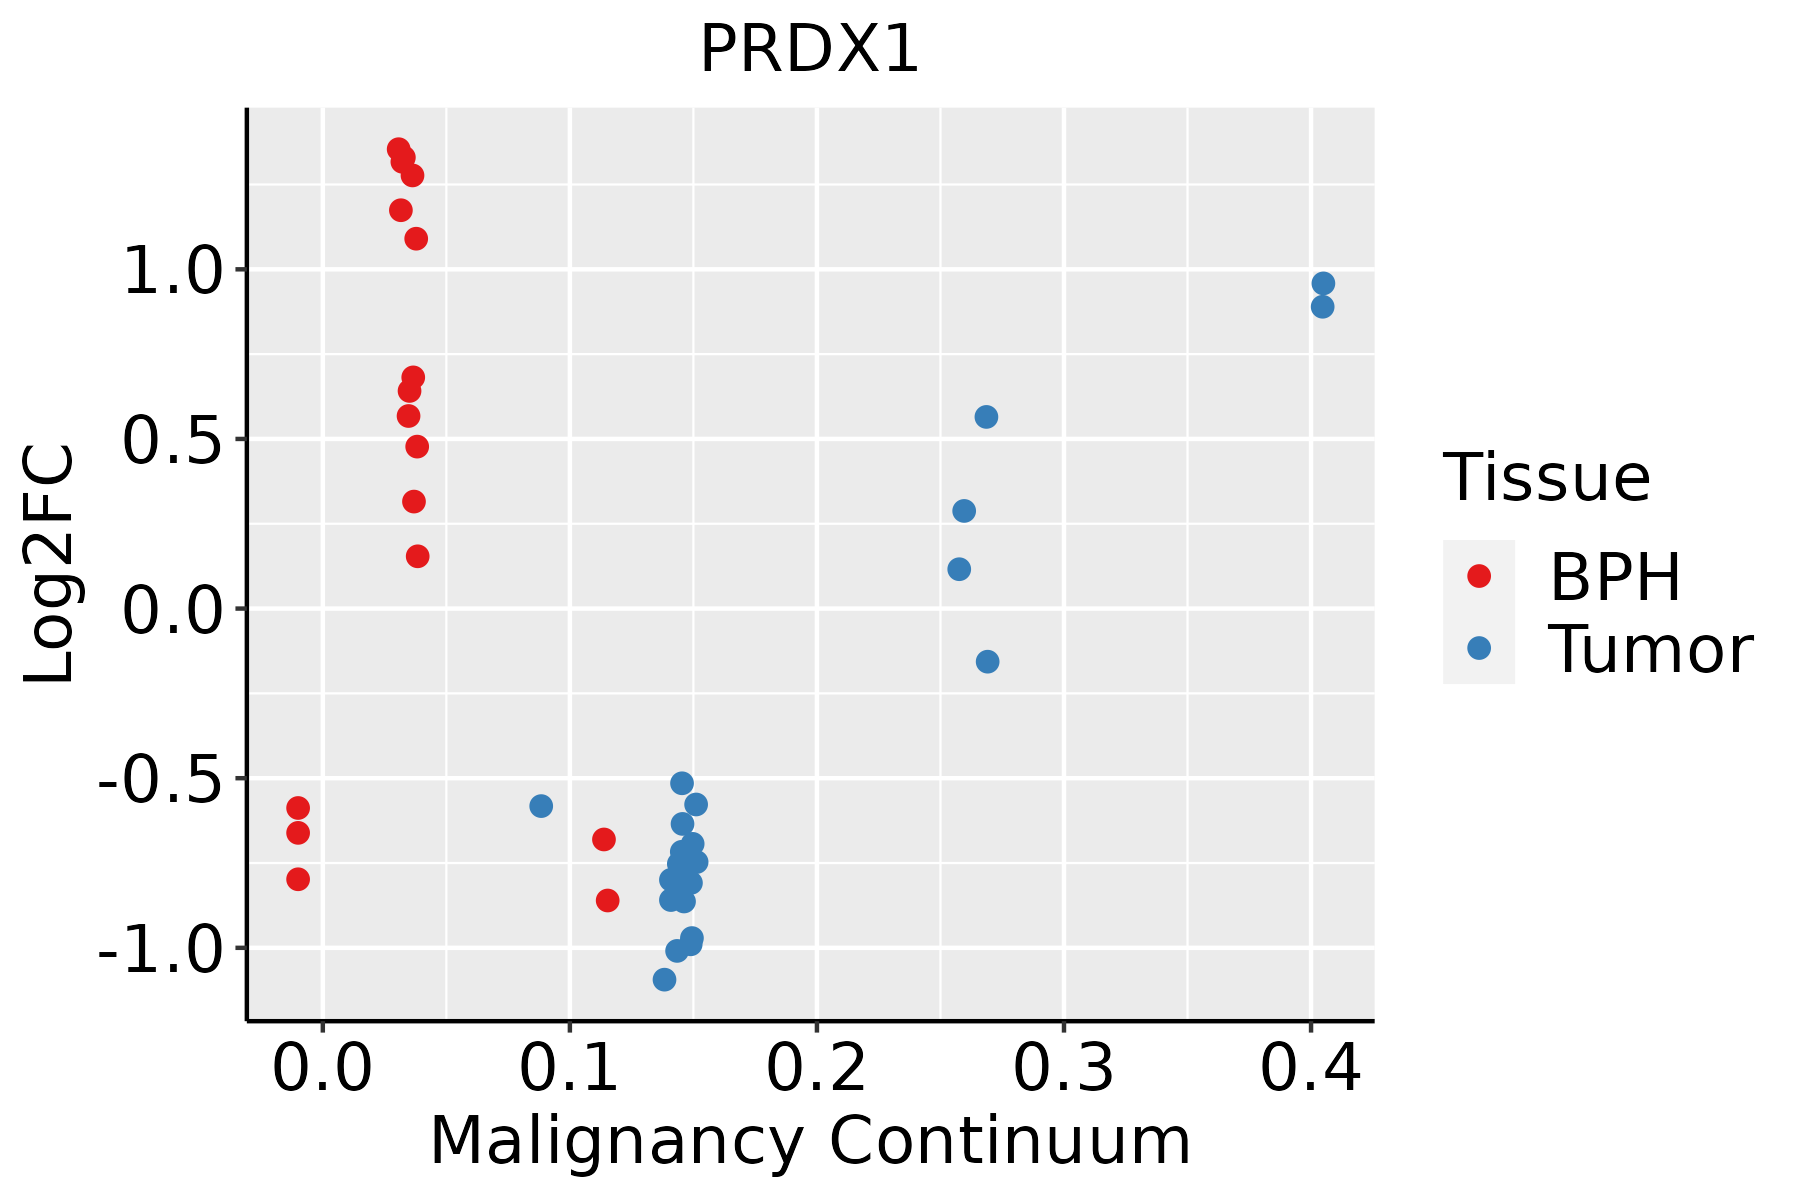 | BPH: Benign Prostatic Hyperplasia |
| Skin |  | AK: Actinic keratosis |
| cSCC: Cutaneous squamous cell carcinoma | ||
| SCCIS:squamous cell carcinoma in situ | ||
| Thyroid | 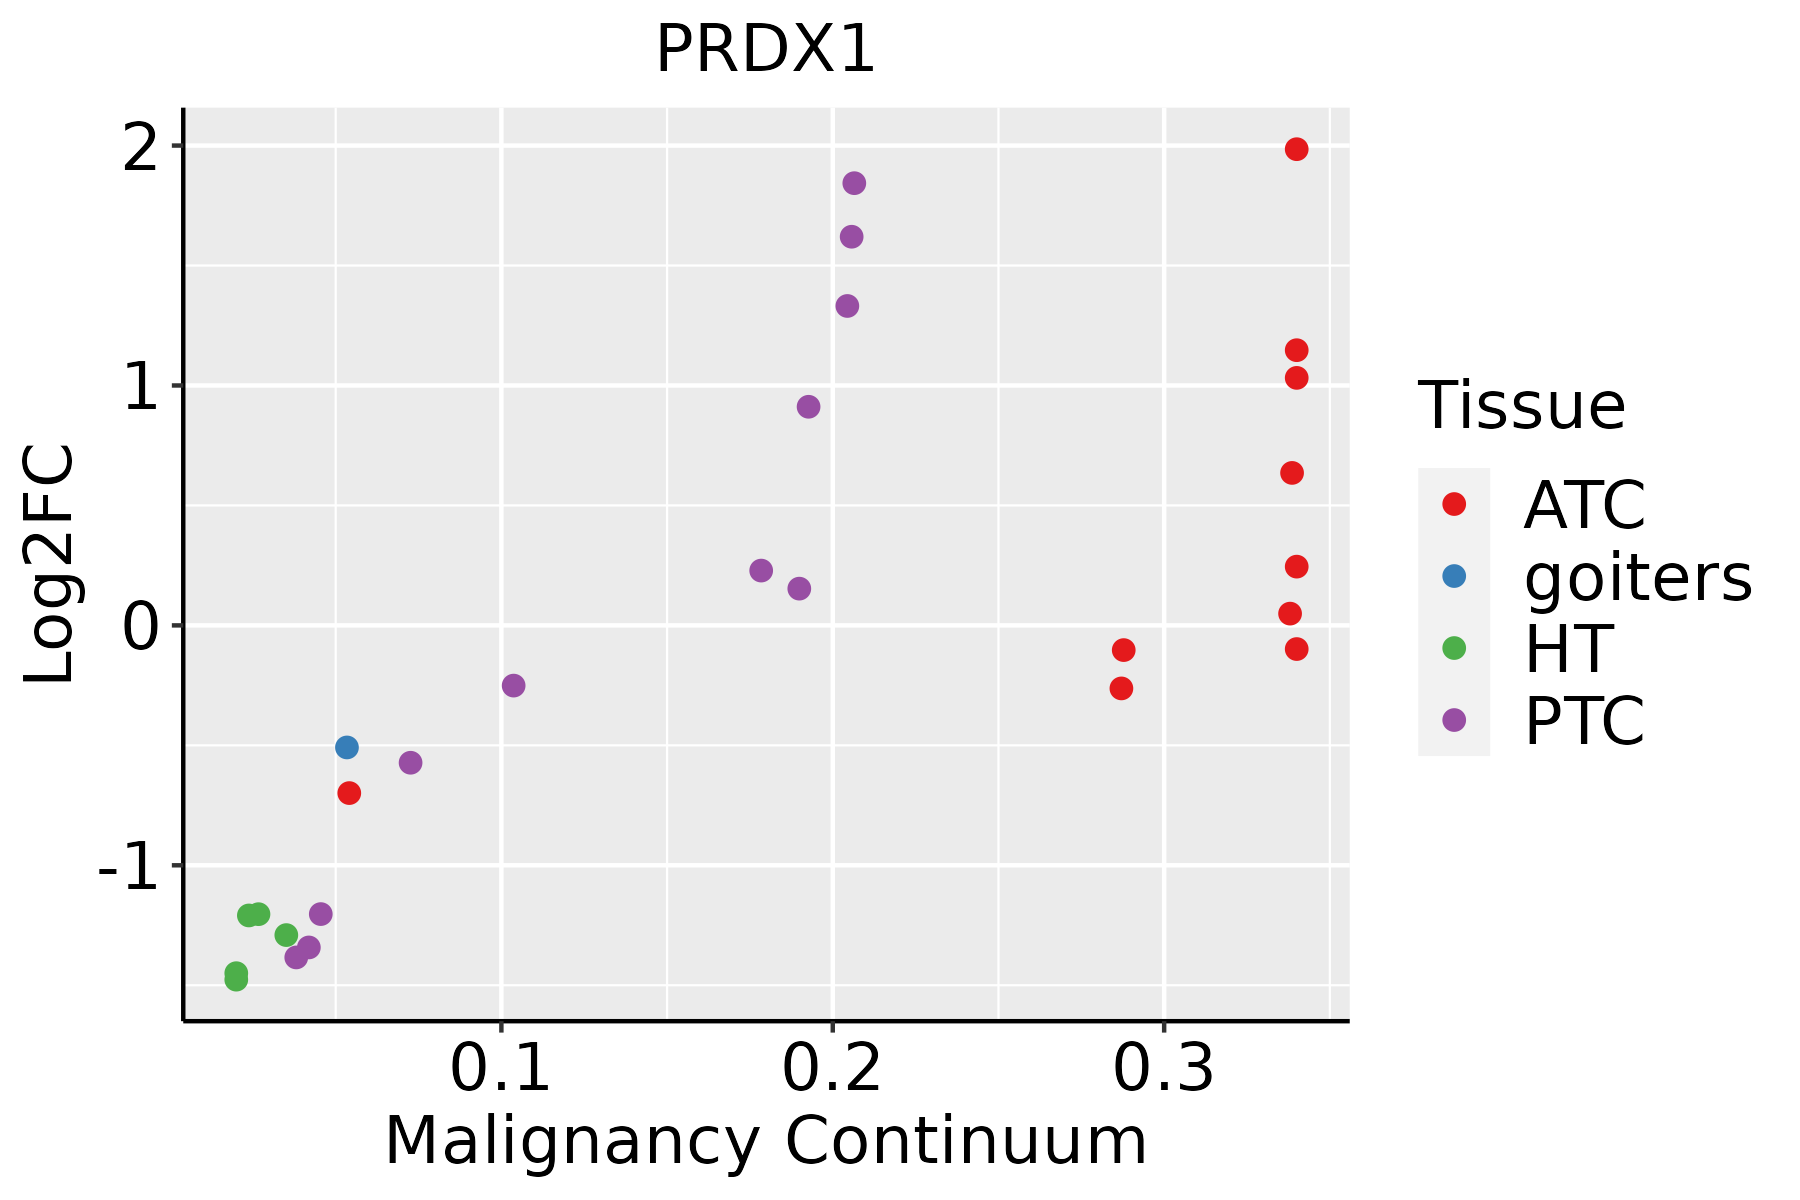 | ATC: Anaplastic thyroid cancer |
| HT: Hashimoto's thyroiditis | ||
| PTC: Papillary thyroid cancer |
| ∗log2FC in expression of this searched gene in stem-like cells from each diseased tissue sample relative to stem-like cells in normal samples in each tissue plotted against the malignancy continuum. Samples are colored based on if they are from different disease stage. |
Top |
Malignant transformation related pathway analysis |
| Find out the enriched GO biological processes and KEGG pathways involved in transition from healthy to precancer to cancer |
| Tissue | Disease Stage | Enriched GO biological Processes |
| Colorectum | AD |  |
| Colorectum | SER |  |
| Colorectum | MSS |  |
| Colorectum | MSI-H |  |
| Colorectum | FAP |  |
| ∗Top 15 enriched GO BP terms are showed in the bar plot of each disease state in each tissue. Each row represents a significant GO biological process which is colored according to the -log10(p.adjust). |
| Page: 1 2 3 4 5 6 7 8 9 |
| GO ID | Tissue | Disease Stage | Description | Gene Ratio | Bg Ratio | pvalue | p.adjust | Count |
| GO:00069799 | Breast | Precancer | response to oxidative stress | 70/1080 | 446/18723 | 1.59e-14 | 4.26e-12 | 70 |
| GO:00621979 | Breast | Precancer | cellular response to chemical stress | 51/1080 | 337/18723 | 2.40e-10 | 2.34e-08 | 51 |
| GO:00003029 | Breast | Precancer | response to reactive oxygen species | 38/1080 | 222/18723 | 1.47e-09 | 1.23e-07 | 38 |
| GO:00345999 | Breast | Precancer | cellular response to oxidative stress | 42/1080 | 288/18723 | 2.78e-08 | 1.79e-06 | 42 |
| GO:00022629 | Breast | Precancer | myeloid cell homeostasis | 27/1080 | 157/18723 | 3.10e-07 | 1.49e-05 | 27 |
| GO:00988698 | Breast | Precancer | cellular oxidant detoxification | 20/1080 | 101/18723 | 1.07e-06 | 4.18e-05 | 20 |
| GO:00341019 | Breast | Precancer | erythrocyte homeostasis | 23/1080 | 129/18723 | 1.20e-06 | 4.60e-05 | 23 |
| GO:00454548 | Breast | Precancer | cell redox homeostasis | 11/1080 | 35/18723 | 2.59e-06 | 8.65e-05 | 11 |
| GO:19907488 | Breast | Precancer | cellular detoxification | 21/1080 | 116/18723 | 2.67e-06 | 8.89e-05 | 21 |
| GO:00987548 | Breast | Precancer | detoxification | 24/1080 | 152/18723 | 6.49e-06 | 1.81e-04 | 24 |
| GO:00972378 | Breast | Precancer | cellular response to toxic substance | 21/1080 | 124/18723 | 7.98e-06 | 2.17e-04 | 21 |
| GO:00346149 | Breast | Precancer | cellular response to reactive oxygen species | 23/1080 | 155/18723 | 2.82e-05 | 6.31e-04 | 23 |
| GO:00725938 | Breast | Precancer | reactive oxygen species metabolic process | 30/1080 | 239/18723 | 5.13e-05 | 1.07e-03 | 30 |
| GO:00488729 | Breast | Precancer | homeostasis of number of cells | 32/1080 | 272/18723 | 1.03e-04 | 1.89e-03 | 32 |
| GO:00096368 | Breast | Precancer | response to toxic substance | 31/1080 | 262/18723 | 1.18e-04 | 2.12e-03 | 31 |
| GO:00427437 | Breast | Precancer | hydrogen peroxide metabolic process | 11/1080 | 58/18723 | 4.17e-04 | 5.56e-03 | 11 |
| GO:00018956 | Breast | Precancer | retina homeostasis | 12/1080 | 79/18723 | 1.82e-03 | 1.79e-02 | 12 |
| GO:00018948 | Breast | Precancer | tissue homeostasis | 27/1080 | 268/18723 | 3.49e-03 | 2.90e-02 | 27 |
| GO:00003031 | Breast | Precancer | response to superoxide | 6/1080 | 28/18723 | 4.58e-03 | 3.53e-02 | 6 |
| GO:00003051 | Breast | Precancer | response to oxygen radical | 6/1080 | 29/18723 | 5.49e-03 | 4.01e-02 | 6 |
| Page: 1 2 3 4 5 6 7 8 9 10 11 12 13 14 15 16 17 18 19 20 21 22 23 24 25 26 27 28 29 30 31 |
| Pathway ID | Tissue | Disease Stage | Description | Gene Ratio | Bg Ratio | pvalue | p.adjust | qvalue | Count |
| hsa051465 | Cervix | CC | Amoebiasis | 29/1267 | 102/8465 | 3.31e-04 | 1.70e-03 | 1.01e-03 | 29 |
| hsa0514612 | Cervix | CC | Amoebiasis | 29/1267 | 102/8465 | 3.31e-04 | 1.70e-03 | 1.01e-03 | 29 |
| hsa051466 | Endometrium | AEH | Amoebiasis | 29/1197 | 102/8465 | 1.22e-04 | 1.10e-03 | 8.06e-04 | 29 |
| hsa0514613 | Endometrium | AEH | Amoebiasis | 29/1197 | 102/8465 | 1.22e-04 | 1.10e-03 | 8.06e-04 | 29 |
| hsa0514622 | Endometrium | EEC | Amoebiasis | 28/1237 | 102/8465 | 5.23e-04 | 3.83e-03 | 2.85e-03 | 28 |
| hsa0514632 | Endometrium | EEC | Amoebiasis | 28/1237 | 102/8465 | 5.23e-04 | 3.83e-03 | 2.85e-03 | 28 |
| hsa041467 | Esophagus | ESCC | Peroxisome | 55/4205 | 82/8465 | 1.04e-03 | 3.27e-03 | 1.68e-03 | 55 |
| hsa0414612 | Esophagus | ESCC | Peroxisome | 55/4205 | 82/8465 | 1.04e-03 | 3.27e-03 | 1.68e-03 | 55 |
| hsa041462 | Liver | Cirrhotic | Peroxisome | 36/2530 | 82/8465 | 4.79e-03 | 1.74e-02 | 1.07e-02 | 36 |
| hsa041463 | Liver | Cirrhotic | Peroxisome | 36/2530 | 82/8465 | 4.79e-03 | 1.74e-02 | 1.07e-02 | 36 |
| hsa051468 | Oral cavity | OSCC | Amoebiasis | 59/3704 | 102/8465 | 2.78e-03 | 7.17e-03 | 3.65e-03 | 59 |
| hsa041466 | Oral cavity | OSCC | Peroxisome | 47/3704 | 82/8465 | 9.01e-03 | 2.01e-02 | 1.03e-02 | 47 |
| hsa0514615 | Oral cavity | OSCC | Amoebiasis | 59/3704 | 102/8465 | 2.78e-03 | 7.17e-03 | 3.65e-03 | 59 |
| hsa0414611 | Oral cavity | OSCC | Peroxisome | 47/3704 | 82/8465 | 9.01e-03 | 2.01e-02 | 1.03e-02 | 47 |
| hsa0414621 | Oral cavity | LP | Peroxisome | 33/2418 | 82/8465 | 1.48e-02 | 4.69e-02 | 3.03e-02 | 33 |
| hsa0414631 | Oral cavity | LP | Peroxisome | 33/2418 | 82/8465 | 1.48e-02 | 4.69e-02 | 3.03e-02 | 33 |
| hsa0514623 | Oral cavity | EOLP | Amoebiasis | 26/1218 | 102/8465 | 2.09e-03 | 7.03e-03 | 4.15e-03 | 26 |
| hsa0514633 | Oral cavity | EOLP | Amoebiasis | 26/1218 | 102/8465 | 2.09e-03 | 7.03e-03 | 4.15e-03 | 26 |
| hsa0514641 | Oral cavity | NEOLP | Amoebiasis | 26/1112 | 102/8465 | 5.36e-04 | 3.05e-03 | 1.92e-03 | 26 |
| hsa0514651 | Oral cavity | NEOLP | Amoebiasis | 26/1112 | 102/8465 | 5.36e-04 | 3.05e-03 | 1.92e-03 | 26 |
| Page: 1 2 |
Top |
Cell-cell communication analysis |
| Identification of potential cell-cell interactions between two cell types and their ligand-receptor pairs for different disease states |
| Ligand | Receptor | LRpair | Pathway | Tissue | Disease Stage |
| Page: 1 |
Top |
Single-cell gene regulatory network inference analysis |
| Find out the significant the regulons (TFs) and the target genes of each regulon across cell types for different disease states |
| TF | Cell Type | Tissue | Disease Stage | Target Gene | RSS | Regulon Activity |
| ∗The dot plots of a searched regulon are shown for all cell subpopulations in each disease state of each tissue based on the regulon specific score inferred using pySCENIC and by calculating the average expression. |
| Page: 1 |
Top |
Somatic mutation of malignant transformation related genes |
| Annotation of somatic variants for genes involved in malignant transformation |
| Hugo Symbol | Variant Class | Variant Classification | dbSNP RS | HGVSc | HGVSp | HGVSp Short | SWISSPROT | BIOTYPE | SIFT | PolyPhen | Tumor Sample Barcode | Tissue | Histology | Sex | Age | Stage | Therapy Types | Drugs | Outcome |
| PRDX1 | SNV | Missense_Mutation | c.28N>T | p.His10Tyr | p.H10Y | Q06830 | protein_coding | deleterious(0.03) | benign(0.001) | TCGA-BH-A0HF-01 | Breast | breast invasive carcinoma | Female | >=65 | I/II | Hormone Therapy | arimidex | SD | |
| PRDX1 | SNV | Missense_Mutation | novel | c.62N>C | p.Met21Thr | p.M21T | Q06830 | protein_coding | deleterious(0) | benign(0.271) | TCGA-C8-A3M8-01 | Breast | breast invasive carcinoma | Female | >=65 | I/II | Hormone Therapy | tamoxiphen | CR |
| PRDX1 | insertion | Frame_Shift_Ins | novel | c.356dupT | p.Leu119PhefsTer4 | p.L119Ffs*4 | Q06830 | protein_coding | TCGA-A8-A09N-01 | Breast | breast invasive carcinoma | Female | <65 | III/IV | Unknown | Unknown | SD | ||
| PRDX1 | SNV | Missense_Mutation | novel | c.55G>A | p.Ala19Thr | p.A19T | Q06830 | protein_coding | deleterious(0.02) | possibly_damaging(0.888) | TCGA-2W-A8YY-01 | Cervix | cervical & endocervical cancer | Female | <65 | I/II | Chemotherapy | cisplatin | CR |
| PRDX1 | SNV | Missense_Mutation | rs765714807 | c.552C>G | p.Ile184Met | p.I184M | Q06830 | protein_coding | tolerated(0.24) | benign(0.345) | TCGA-IR-A3LK-01 | Cervix | cervical & endocervical cancer | Female | >=65 | I/II | Chemotherapy | cisplatin | PD |
| PRDX1 | SNV | Missense_Mutation | c.187G>A | p.Ala63Thr | p.A63T | Q06830 | protein_coding | tolerated(0.11) | benign(0.094) | TCGA-A6-5661-01 | Colorectum | colon adenocarcinoma | Female | >=65 | I/II | Unknown | Unknown | SD | |
| PRDX1 | SNV | Missense_Mutation | c.580T>C | p.Tyr194His | p.Y194H | Q06830 | protein_coding | deleterious(0) | probably_damaging(0.991) | TCGA-DM-A1HB-01 | Colorectum | colon adenocarcinoma | Male | >=65 | III/IV | Unknown | Unknown | SD | |
| PRDX1 | SNV | Missense_Mutation | novel | c.212N>A | p.Cys71Tyr | p.C71Y | Q06830 | protein_coding | deleterious(0) | possibly_damaging(0.905) | TCGA-A5-A0G2-01 | Endometrium | uterine corpus endometrioid carcinoma | Female | <65 | III/IV | Unknown | Unknown | SD |
| PRDX1 | SNV | Missense_Mutation | novel | c.34N>A | p.Ala12Thr | p.A12T | Q06830 | protein_coding | deleterious(0) | benign(0.185) | TCGA-AX-A0IZ-01 | Endometrium | uterine corpus endometrioid carcinoma | Female | <65 | I/II | Unknown | Unknown | SD |
| PRDX1 | SNV | Missense_Mutation | c.167N>C | p.Ile56Thr | p.I56T | Q06830 | protein_coding | deleterious(0) | possibly_damaging(0.63) | TCGA-DI-A1BU-01 | Endometrium | uterine corpus endometrioid carcinoma | Female | <65 | I/II | Chemotherapy | paclitaxel | SD |
| Page: 1 2 |
Top |
Related drugs of malignant transformation related genes |
| Identification of chemicals and drugs interact with genes involved in malignant transfromation |
| (DGIdb 4.0) |
| Entrez ID | Symbol | Category | Interaction Types | Drug Claim Name | Drug Name | PMIDs |
| 5052 | PRDX1 | ENZYME | ANTIOXIDANT | 9388242 | ||
| 5052 | PRDX1 | ENZYME | HYDROGEN PEROXIDE | 14765133 |
| Page: 1 |

Copyright 2023-Present -The University of Texas Health Science Center at Houston |