
|
|||||
|
 | |
| |
| |
| |
| |
| |
|
Gene: PRCP |
Gene summary for PRCP |
| Gene information | Species | Human | Gene symbol | PRCP | Gene ID | 5547 |
| Gene name | prolylcarboxypeptidase | |
| Gene Alias | HUMPCP | |
| Cytomap | 11q14.1 | |
| Gene Type | protein-coding | GO ID | GO:0001525 | UniProtAcc | B7Z7Q6 |
Top |
Malignant transformation analysis |
| Identification of the aberrant gene expression in precancerous and cancerous lesions by comparing the gene expression of stem-like cells in diseased tissues with normal stem cells |
| Entrez ID | Symbol | Replicates | Species | Organ | Tissue | Adj P-value | Log2FC | Malignancy |
| 5547 | PRCP | LZE4T | Human | Esophagus | ESCC | 5.62e-05 | 1.20e-01 | 0.0811 |
| 5547 | PRCP | LZE8T | Human | Esophagus | ESCC | 7.35e-06 | 3.10e-01 | 0.067 |
| 5547 | PRCP | LZE20T | Human | Esophagus | ESCC | 5.66e-04 | 2.76e-01 | 0.0662 |
| 5547 | PRCP | LZE24T | Human | Esophagus | ESCC | 2.62e-22 | 7.49e-01 | 0.0596 |
| 5547 | PRCP | P2T-E | Human | Esophagus | ESCC | 6.15e-28 | 4.70e-01 | 0.1177 |
| 5547 | PRCP | P4T-E | Human | Esophagus | ESCC | 2.26e-50 | 1.34e+00 | 0.1323 |
| 5547 | PRCP | P8T-E | Human | Esophagus | ESCC | 3.94e-11 | 3.03e-01 | 0.0889 |
| 5547 | PRCP | P9T-E | Human | Esophagus | ESCC | 1.42e-15 | 6.30e-01 | 0.1131 |
| 5547 | PRCP | P10T-E | Human | Esophagus | ESCC | 4.89e-30 | 5.51e-01 | 0.116 |
| 5547 | PRCP | P11T-E | Human | Esophagus | ESCC | 6.26e-26 | 1.05e+00 | 0.1426 |
| 5547 | PRCP | P12T-E | Human | Esophagus | ESCC | 3.77e-58 | 1.27e+00 | 0.1122 |
| 5547 | PRCP | P15T-E | Human | Esophagus | ESCC | 2.84e-13 | 2.88e-01 | 0.1149 |
| 5547 | PRCP | P16T-E | Human | Esophagus | ESCC | 5.68e-54 | 1.27e+00 | 0.1153 |
| 5547 | PRCP | P17T-E | Human | Esophagus | ESCC | 1.26e-08 | 5.34e-01 | 0.1278 |
| 5547 | PRCP | P19T-E | Human | Esophagus | ESCC | 9.14e-06 | 7.08e-01 | 0.1662 |
| 5547 | PRCP | P20T-E | Human | Esophagus | ESCC | 4.16e-14 | 4.57e-01 | 0.1124 |
| 5547 | PRCP | P21T-E | Human | Esophagus | ESCC | 4.15e-44 | 6.99e-01 | 0.1617 |
| 5547 | PRCP | P22T-E | Human | Esophagus | ESCC | 6.28e-29 | 3.89e-01 | 0.1236 |
| 5547 | PRCP | P23T-E | Human | Esophagus | ESCC | 5.64e-30 | 9.53e-01 | 0.108 |
| 5547 | PRCP | P24T-E | Human | Esophagus | ESCC | 4.61e-06 | 3.32e-01 | 0.1287 |
| Page: 1 2 3 4 5 6 |
| Tissue | Expression Dynamics | Abbreviation |
| Esophagus | 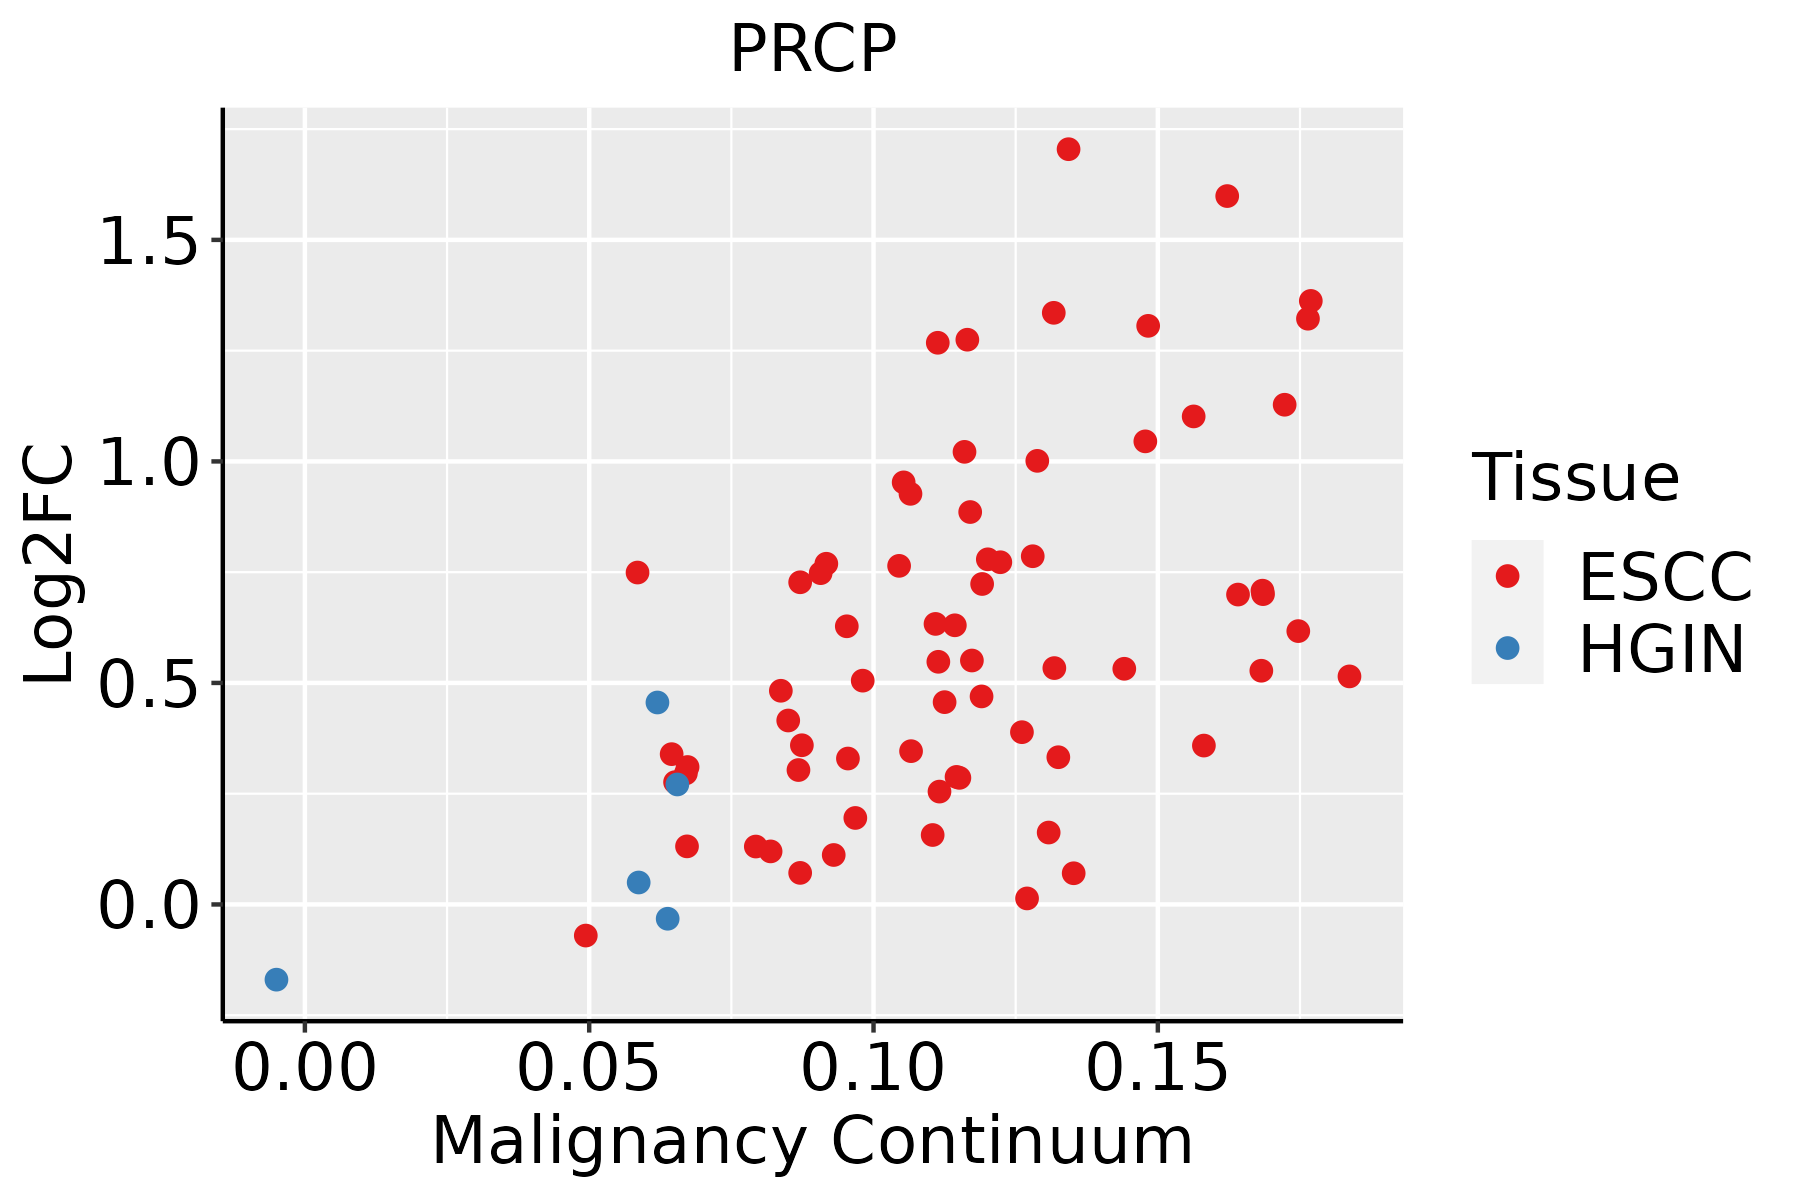 | ESCC: Esophageal squamous cell carcinoma |
| HGIN: High-grade intraepithelial neoplasias | ||
| LGIN: Low-grade intraepithelial neoplasias | ||
| Liver | 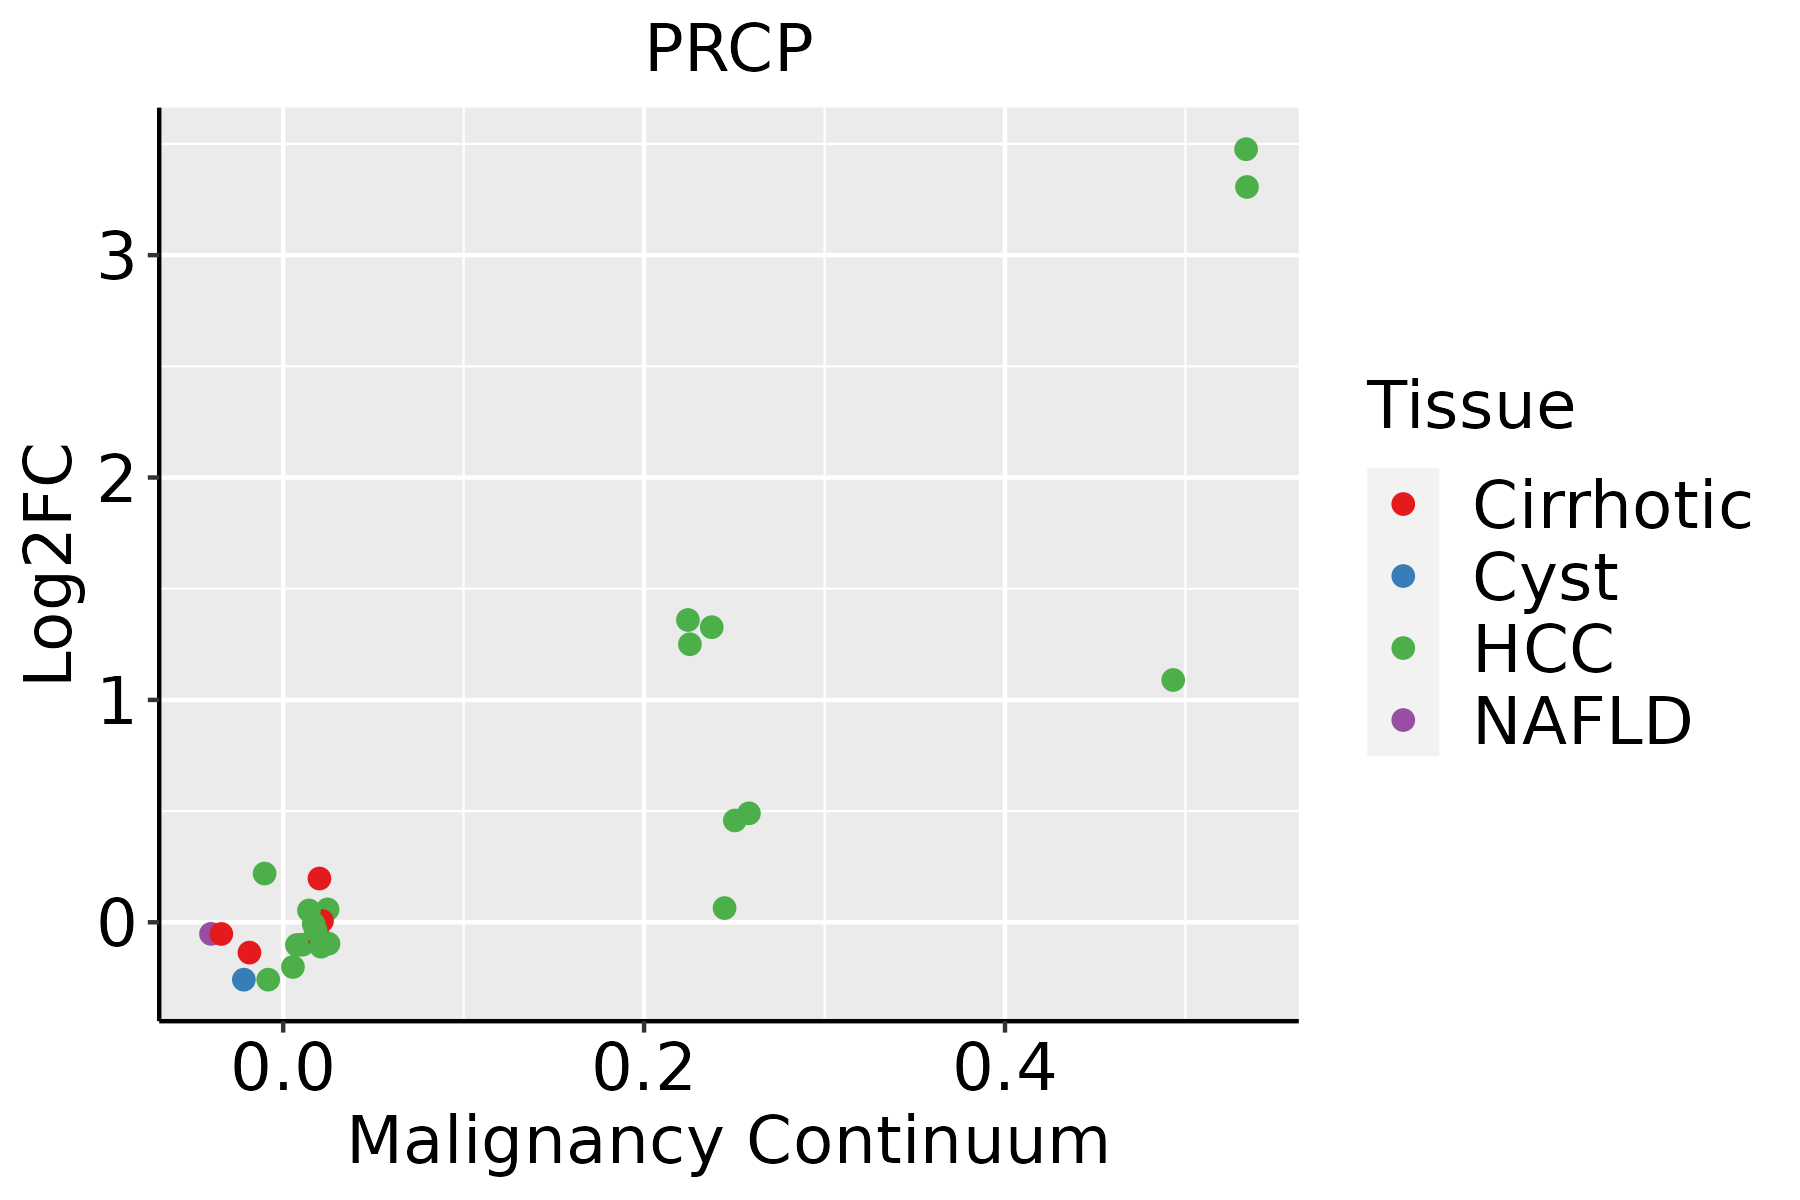 | HCC: Hepatocellular carcinoma |
| NAFLD: Non-alcoholic fatty liver disease | ||
| Oral Cavity | 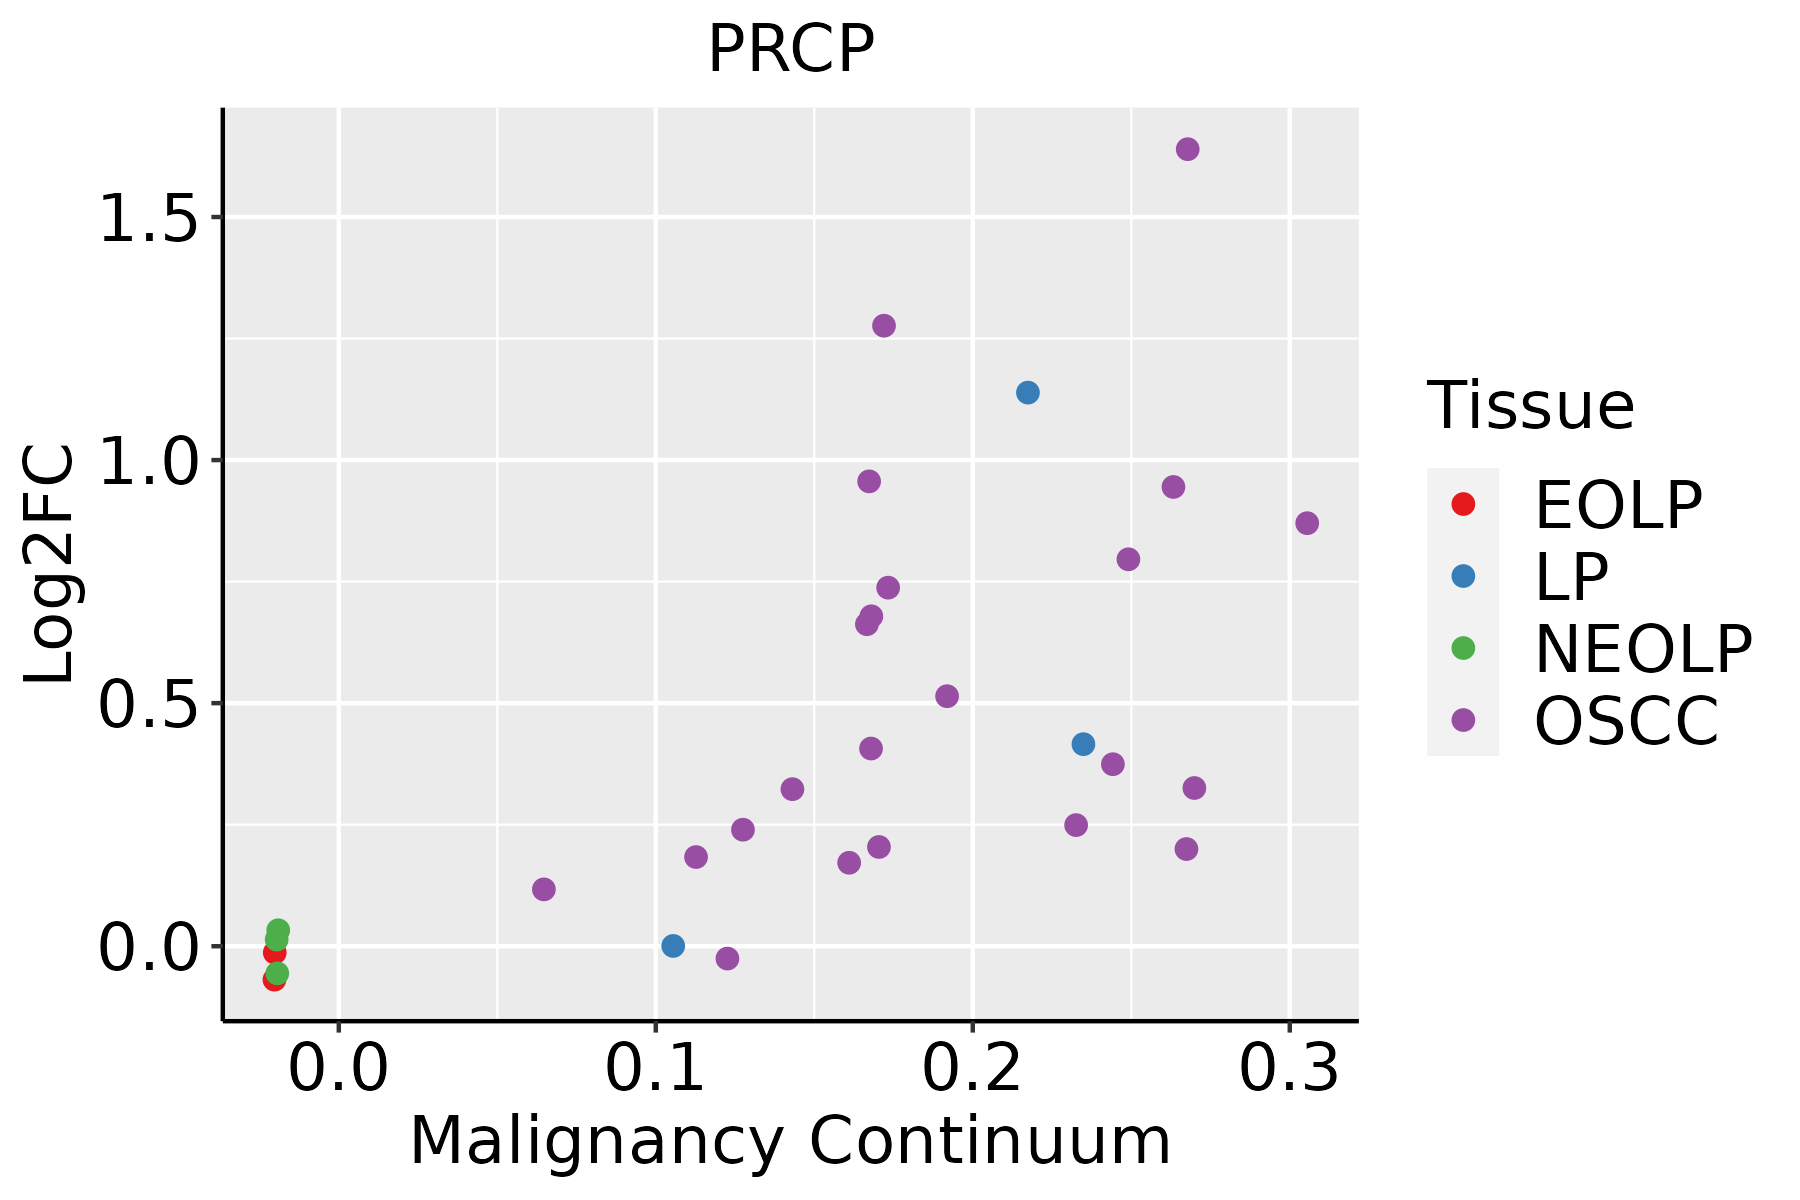 | EOLP: Erosive Oral lichen planus |
| LP: leukoplakia | ||
| NEOLP: Non-erosive oral lichen planus | ||
| OSCC: Oral squamous cell carcinoma | ||
| Skin | 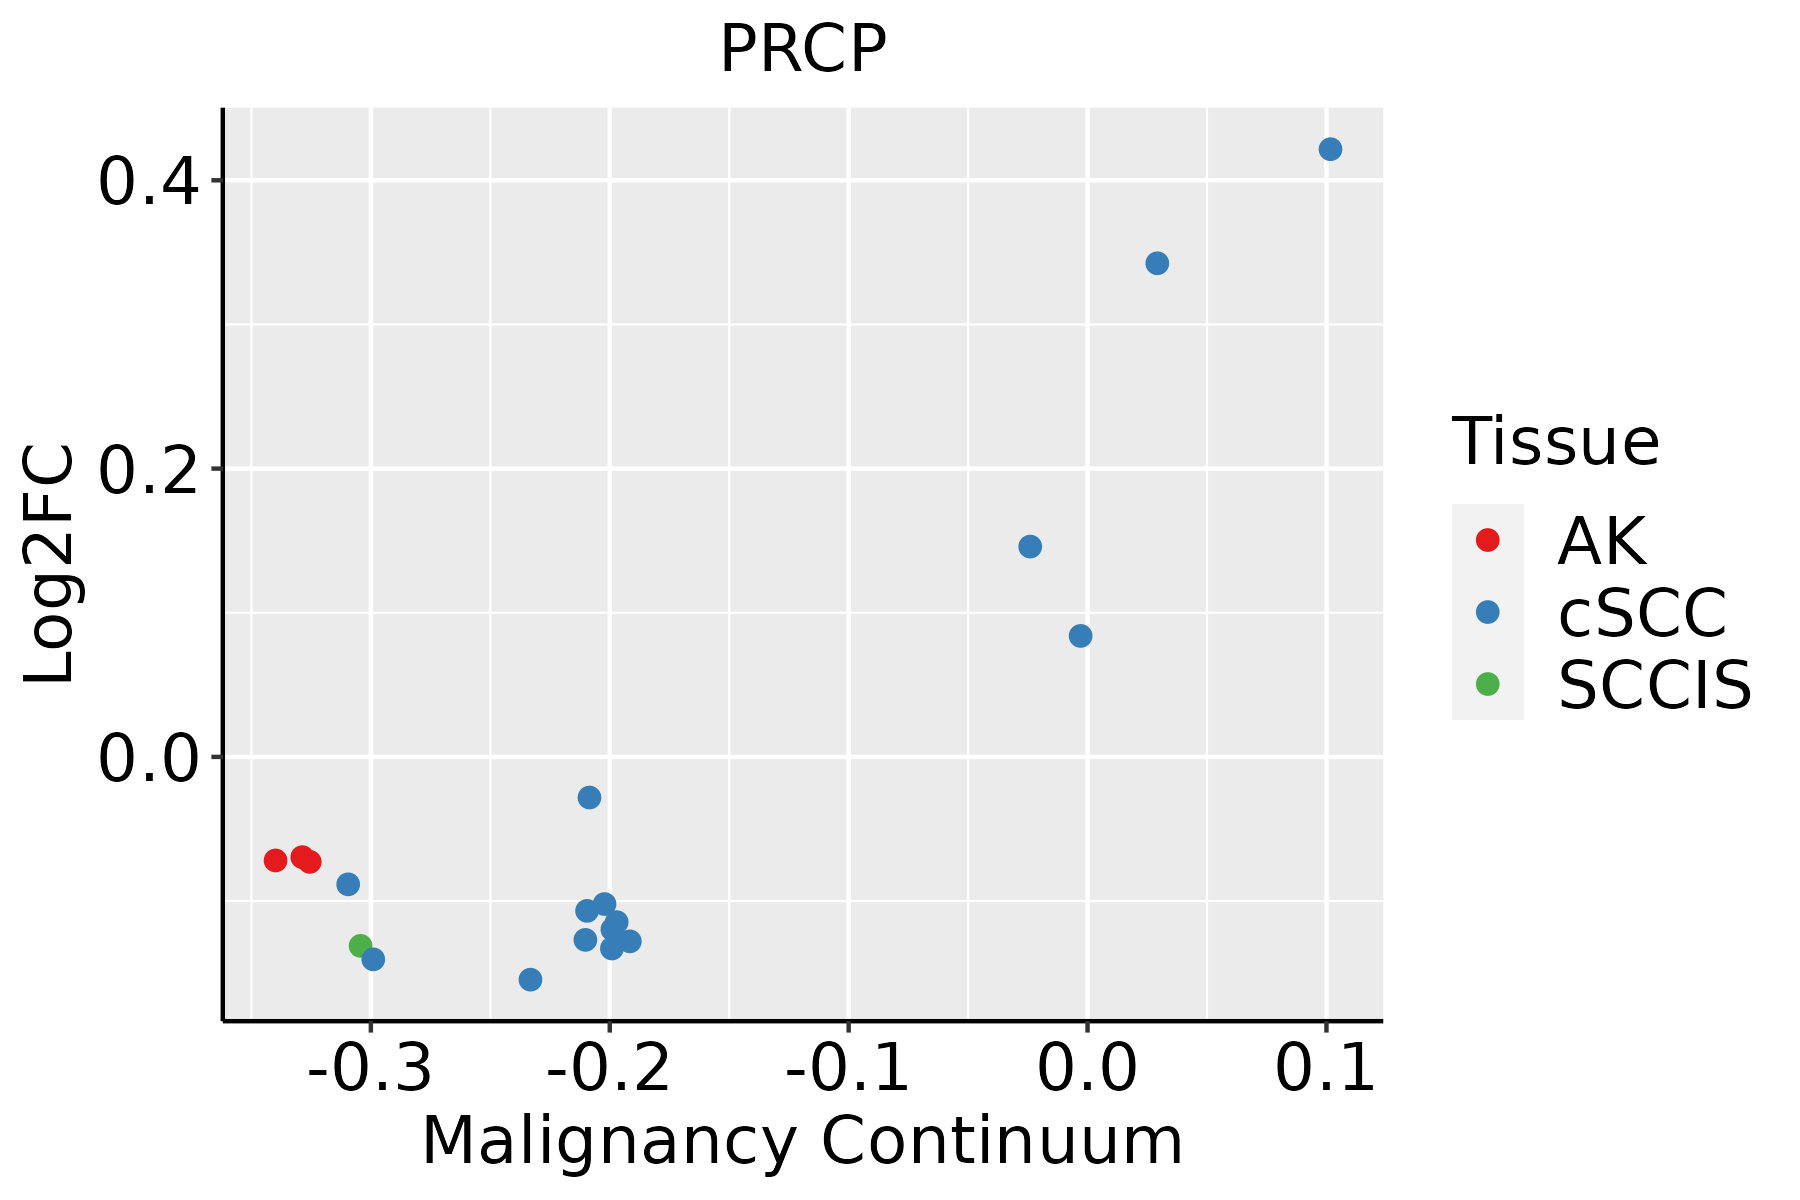 | AK: Actinic keratosis |
| cSCC: Cutaneous squamous cell carcinoma | ||
| SCCIS:squamous cell carcinoma in situ | ||
| Thyroid | 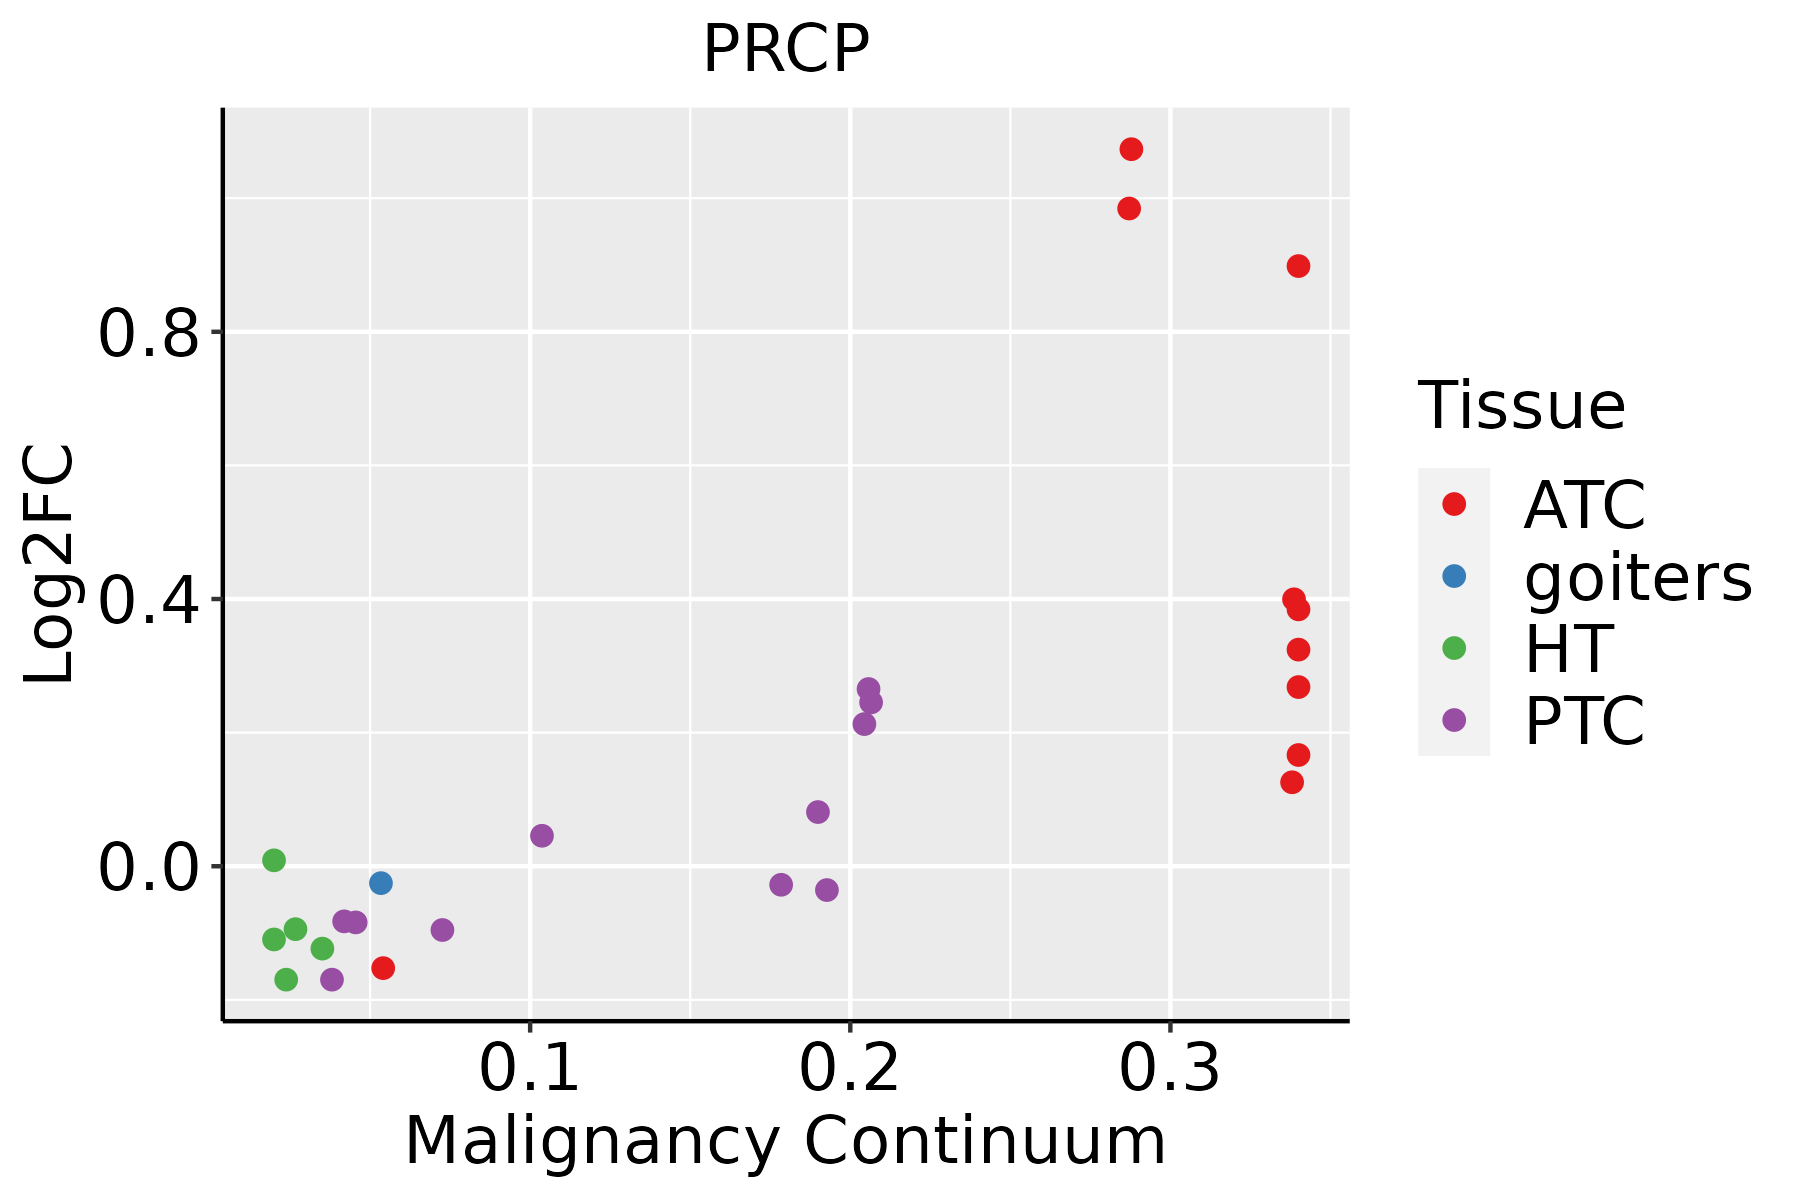 | ATC: Anaplastic thyroid cancer |
| HT: Hashimoto's thyroiditis | ||
| PTC: Papillary thyroid cancer |
| ∗log2FC in expression of this searched gene in stem-like cells from each diseased tissue sample relative to stem-like cells in normal samples in each tissue plotted against the malignancy continuum. Samples are colored based on if they are from different disease stage. |
Top |
Malignant transformation related pathway analysis |
| Find out the enriched GO biological processes and KEGG pathways involved in transition from healthy to precancer to cancer |
| Tissue | Disease Stage | Enriched GO biological Processes |
| Colorectum | AD |  |
| Colorectum | SER |  |
| Colorectum | MSS |  |
| Colorectum | MSI-H |  |
| Colorectum | FAP |  |
| ∗Top 15 enriched GO BP terms are showed in the bar plot of each disease state in each tissue. Each row represents a significant GO biological process which is colored according to the -log10(p.adjust). |
| Page: 1 2 3 4 5 6 7 8 9 |
| GO ID | Tissue | Disease Stage | Description | Gene Ratio | Bg Ratio | pvalue | p.adjust | Count |
| GO:0030522110 | Esophagus | ESCC | intracellular receptor signaling pathway | 170/8552 | 265/18723 | 8.58e-10 | 2.09e-08 | 170 |
| GO:004206027 | Esophagus | ESCC | wound healing | 243/8552 | 422/18723 | 4.62e-07 | 6.25e-06 | 243 |
| GO:200037718 | Esophagus | ESCC | regulation of reactive oxygen species metabolic process | 100/8552 | 157/18723 | 3.87e-06 | 4.17e-05 | 100 |
| GO:007259318 | Esophagus | ESCC | reactive oxygen species metabolic process | 137/8552 | 239/18723 | 1.82e-04 | 1.16e-03 | 137 |
| GO:000166720 | Esophagus | ESCC | ameboidal-type cell migration | 250/8552 | 475/18723 | 1.22e-03 | 5.97e-03 | 250 |
| GO:000975516 | Esophagus | ESCC | hormone-mediated signaling pathway | 106/8552 | 190/18723 | 3.13e-03 | 1.30e-02 | 106 |
| GO:001063120 | Esophagus | ESCC | epithelial cell migration | 187/8552 | 357/18723 | 6.05e-03 | 2.23e-02 | 187 |
| GO:009013220 | Esophagus | ESCC | epithelium migration | 188/8552 | 360/18723 | 6.96e-03 | 2.54e-02 | 188 |
| GO:009013020 | Esophagus | ESCC | tissue migration | 190/8552 | 365/18723 | 7.91e-03 | 2.82e-02 | 190 |
| GO:004206012 | Liver | Cirrhotic | wound healing | 155/4634 | 422/18723 | 2.12e-08 | 7.56e-07 | 155 |
| GO:003052212 | Liver | Cirrhotic | intracellular receptor signaling pathway | 105/4634 | 265/18723 | 5.44e-08 | 1.69e-06 | 105 |
| GO:200037712 | Liver | Cirrhotic | regulation of reactive oxygen species metabolic process | 67/4634 | 157/18723 | 6.07e-07 | 1.32e-05 | 67 |
| GO:00725937 | Liver | Cirrhotic | reactive oxygen species metabolic process | 92/4634 | 239/18723 | 1.57e-06 | 3.03e-05 | 92 |
| GO:000975511 | Liver | Cirrhotic | hormone-mediated signaling pathway | 71/4634 | 190/18723 | 7.09e-05 | 7.98e-04 | 71 |
| GO:00723761 | Liver | Cirrhotic | protein activation cascade | 9/4634 | 12/18723 | 3.59e-04 | 3.03e-03 | 9 |
| GO:004259312 | Liver | Cirrhotic | glucose homeostasis | 86/4634 | 258/18723 | 1.12e-03 | 7.73e-03 | 86 |
| GO:003350012 | Liver | Cirrhotic | carbohydrate homeostasis | 86/4634 | 259/18723 | 1.28e-03 | 8.61e-03 | 86 |
| GO:000166712 | Liver | Cirrhotic | ameboidal-type cell migration | 145/4634 | 475/18723 | 2.23e-03 | 1.36e-02 | 145 |
| GO:00106327 | Liver | Cirrhotic | regulation of epithelial cell migration | 93/4634 | 292/18723 | 3.46e-03 | 1.92e-02 | 93 |
| GO:00106317 | Liver | Cirrhotic | epithelial cell migration | 110/4634 | 357/18723 | 5.14e-03 | 2.65e-02 | 110 |
| Page: 1 2 3 4 5 |
| Pathway ID | Tissue | Disease Stage | Description | Gene Ratio | Bg Ratio | pvalue | p.adjust | qvalue | Count |
| Page: 1 |
Top |
Cell-cell communication analysis |
| Identification of potential cell-cell interactions between two cell types and their ligand-receptor pairs for different disease states |
| Ligand | Receptor | LRpair | Pathway | Tissue | Disease Stage |
| Page: 1 |
Top |
Single-cell gene regulatory network inference analysis |
| Find out the significant the regulons (TFs) and the target genes of each regulon across cell types for different disease states |
| TF | Cell Type | Tissue | Disease Stage | Target Gene | RSS | Regulon Activity |
| ∗The dot plots of a searched regulon are shown for all cell subpopulations in each disease state of each tissue based on the regulon specific score inferred using pySCENIC and by calculating the average expression. |
| Page: 1 |
Top |
Somatic mutation of malignant transformation related genes |
| Annotation of somatic variants for genes involved in malignant transformation |
| Hugo Symbol | Variant Class | Variant Classification | dbSNP RS | HGVSc | HGVSp | HGVSp Short | SWISSPROT | BIOTYPE | SIFT | PolyPhen | Tumor Sample Barcode | Tissue | Histology | Sex | Age | Stage | Therapy Types | Drugs | Outcome |
| PRCP | SNV | Missense_Mutation | c.757N>T | p.His253Tyr | p.H253Y | P42785 | protein_coding | deleterious(0.03) | benign(0.001) | TCGA-AR-A1AN-01 | Breast | breast invasive carcinoma | Female | <65 | I/II | Chemotherapy | cytoxan | SD | |
| PRCP | SNV | Missense_Mutation | c.1454N>T | p.Ala485Val | p.A485V | P42785 | protein_coding | deleterious(0.04) | benign(0.14) | TCGA-BH-A18H-01 | Breast | breast invasive carcinoma | Female | <65 | I/II | Chemotherapy | adriamycin | CR | |
| PRCP | insertion | Nonsense_Mutation | novel | c.54_55insTAACCCTCTAGATCTCATTG | p.Thr19Ter | p.T19* | P42785 | protein_coding | TCGA-A8-A08H-01 | Breast | breast invasive carcinoma | Female | >=65 | I/II | Unknown | Unknown | SD | ||
| PRCP | SNV | Missense_Mutation | rs771964202 | c.1538N>T | p.Ala513Val | p.A513V | P42785 | protein_coding | tolerated(0.56) | benign(0) | TCGA-DG-A2KK-01 | Cervix | cervical & endocervical cancer | Female | <65 | III/IV | Chemotherapy | cisplatin | SD |
| PRCP | SNV | Missense_Mutation | rs372175092 | c.1441N>T | p.Arg481Cys | p.R481C | P42785 | protein_coding | deleterious(0) | probably_damaging(0.999) | TCGA-A6-6780-01 | Colorectum | colon adenocarcinoma | Male | >=65 | I/II | Unknown | Unknown | SD |
| PRCP | SNV | Missense_Mutation | rs756438952 | c.431G>A | p.Arg144Gln | p.R144Q | P42785 | protein_coding | deleterious(0) | probably_damaging(1) | TCGA-AZ-4315-01 | Colorectum | colon adenocarcinoma | Male | <65 | I/II | Unknown | Unknown | SD |
| PRCP | SNV | Missense_Mutation | novel | c.1106N>G | p.Glu369Gly | p.E369G | P42785 | protein_coding | tolerated(0.12) | benign(0.021) | TCGA-CA-6717-01 | Colorectum | colon adenocarcinoma | Male | <65 | I/II | Chemotherapy | oxaliplatin | CR |
| PRCP | insertion | Frame_Shift_Ins | novel | c.27_28insAC | p.Leu10ThrfsTer12 | p.L10Tfs*12 | P42785 | protein_coding | TCGA-AM-5820-01 | Colorectum | colon adenocarcinoma | Female | <65 | I/II | Unknown | Unknown | SD | ||
| PRCP | SNV | Missense_Mutation | rs765570331 | c.854N>A | p.Cys285Tyr | p.C285Y | P42785 | protein_coding | deleterious(0) | probably_damaging(0.999) | TCGA-A5-A0VQ-01 | Endometrium | uterine corpus endometrioid carcinoma | Female | <65 | I/II | Chemotherapy | carboplatin | SD |
| PRCP | SNV | Missense_Mutation | novel | c.1300N>A | p.Gly434Ser | p.G434S | P42785 | protein_coding | deleterious(0.03) | probably_damaging(0.934) | TCGA-A5-A1OF-01 | Endometrium | uterine corpus endometrioid carcinoma | Female | <65 | I/II | Unknown | Unknown | SD |
| Page: 1 2 3 4 5 6 |
Top |
Related drugs of malignant transformation related genes |
| Identification of chemicals and drugs interact with genes involved in malignant transfromation |
| (DGIdb 4.0) |
| Entrez ID | Symbol | Category | Interaction Types | Drug Claim Name | Drug Name | PMIDs |
| 5547 | PRCP | ENZYME, DRUGGABLE GENOME, PROTEASE | Piperidinyl pyrazole derivative 3 | |||
| 5547 | PRCP | ENZYME, DRUGGABLE GENOME, PROTEASE | benazepril | BENAZEPRIL | 20079160 | |
| 5547 | PRCP | ENZYME, DRUGGABLE GENOME, PROTEASE | Piperidinyl triazole derivative 3 | |||
| 5547 | PRCP | ENZYME, DRUGGABLE GENOME, PROTEASE | Benzodihydroisofuran derivative 2 | |||
| 5547 | PRCP | ENZYME, DRUGGABLE GENOME, PROTEASE | Cyclohexane carboxamide derivative 3 | |||
| 5547 | PRCP | ENZYME, DRUGGABLE GENOME, PROTEASE | Benzodihydroisofuran derivative 3 | |||
| 5547 | PRCP | ENZYME, DRUGGABLE GENOME, PROTEASE | Benzodihydroisofuran derivative 4 | |||
| 5547 | PRCP | ENZYME, DRUGGABLE GENOME, PROTEASE | Benzodihydroisofuran derivative 1 | |||
| 5547 | PRCP | ENZYME, DRUGGABLE GENOME, PROTEASE | Imidazole derivative 8 | |||
| 5547 | PRCP | ENZYME, DRUGGABLE GENOME, PROTEASE | Proline amide derivative 1 |
| Page: 1 2 3 |

Copyright 2023-Present -The University of Texas Health Science Center at Houston |