Schematic overview of the cellular and molecular mechanisms involved in the cancer progression, including the proposed cellular and molecular mechanisms in cancer cells trajectory. AT1: alveolar type 1 cells; AT2: alveolar type 2 cells; AAH: atypical adenomatous hyperplasia; AIS: adenocarcinoma in situ; MIA: minimally invasive adenocarcinoma; IA: invasive adenocarcinoma; EMT: epithelial-mesenchymal transition

Home

Download

Statistics

Help

Contact

Center for Computational Systems Medicine
leaf

Gene summary

leaf

Malignant transformation analysis

leaf

Malignant transformation related pathway analysis

leaf

Cell-cell communication analysis

leaf

Single-cell gene regulatory network inference analysis

leaf

Somatic mutation of malignant transformation related genes

leaf

Related drugs of malignant transformation related genes

Gene: PRC1

Gene summary for PRC1

check button Gene summary.

Gene informationSpeciesHuman
Gene symbol

PRC1

Gene ID

9055

Gene nameprotein regulator of cytokinesis 1
Gene AliasASE1
Cytomap15q26.1
Gene Typeprotein-coding
GO ID

GO:0000022

UniProtAcc

O43663


Top

Malignant transformation analysis

check button Identification of the aberrant gene expression in precancerous and cancerous lesions by comparing the gene expression of stem-like cells in diseased tissues with normal stem cells
check button Malignant transformation involving gene list.
Entrez IDSymbolReplicatesSpeciesOrganTissueAdj P-valueLog2FCMalignancy
9055PRC1LZE2THumanEsophagusESCC3.37e-059.45e-010.082
9055PRC1LZE4THumanEsophagusESCC9.84e-052.88e-010.0811
9055PRC1LZE7THumanEsophagusESCC8.44e-053.95e-010.0667
9055PRC1LZE21THumanEsophagusESCC7.59e-034.89e-010.0655
9055PRC1LZE6THumanEsophagusESCC1.01e-022.76e-010.0845
9055PRC1P1T-EHumanEsophagusESCC2.21e-046.22e-010.0875
9055PRC1P2T-EHumanEsophagusESCC1.35e-236.49e-010.1177
9055PRC1P4T-EHumanEsophagusESCC2.99e-197.03e-010.1323
9055PRC1P5T-EHumanEsophagusESCC3.58e-286.76e-010.1327
9055PRC1P8T-EHumanEsophagusESCC8.40e-041.97e-010.0889
9055PRC1P9T-EHumanEsophagusESCC1.78e-125.27e-010.1131
9055PRC1P10T-EHumanEsophagusESCC2.27e-219.93e-010.116
9055PRC1P12T-EHumanEsophagusESCC4.41e-071.80e-010.1122
9055PRC1P15T-EHumanEsophagusESCC7.50e-084.18e-010.1149
9055PRC1P16T-EHumanEsophagusESCC8.56e-123.49e-010.1153
9055PRC1P17T-EHumanEsophagusESCC1.57e-035.77e-010.1278
9055PRC1P19T-EHumanEsophagusESCC3.31e-027.24e-010.1662
9055PRC1P20T-EHumanEsophagusESCC4.65e-093.21e-010.1124
9055PRC1P21T-EHumanEsophagusESCC7.37e-114.29e-010.1617
9055PRC1P22T-EHumanEsophagusESCC1.76e-123.97e-010.1236
Page: 1 2 3 4 5 

check button Transcriptomic changes along malignancy continuum.
TissueExpression DynamicsAbbreviation
EsophagusThe image shows the transcriptomic changes along malignancy continuum.log2FC in expression of this searched gene in stem-like cells from each diseased tissue sample relative to stem-like cells in normal samples in each tissue plotted against the malignancy continuum. Samples are colored based on if they are from different disease stage.
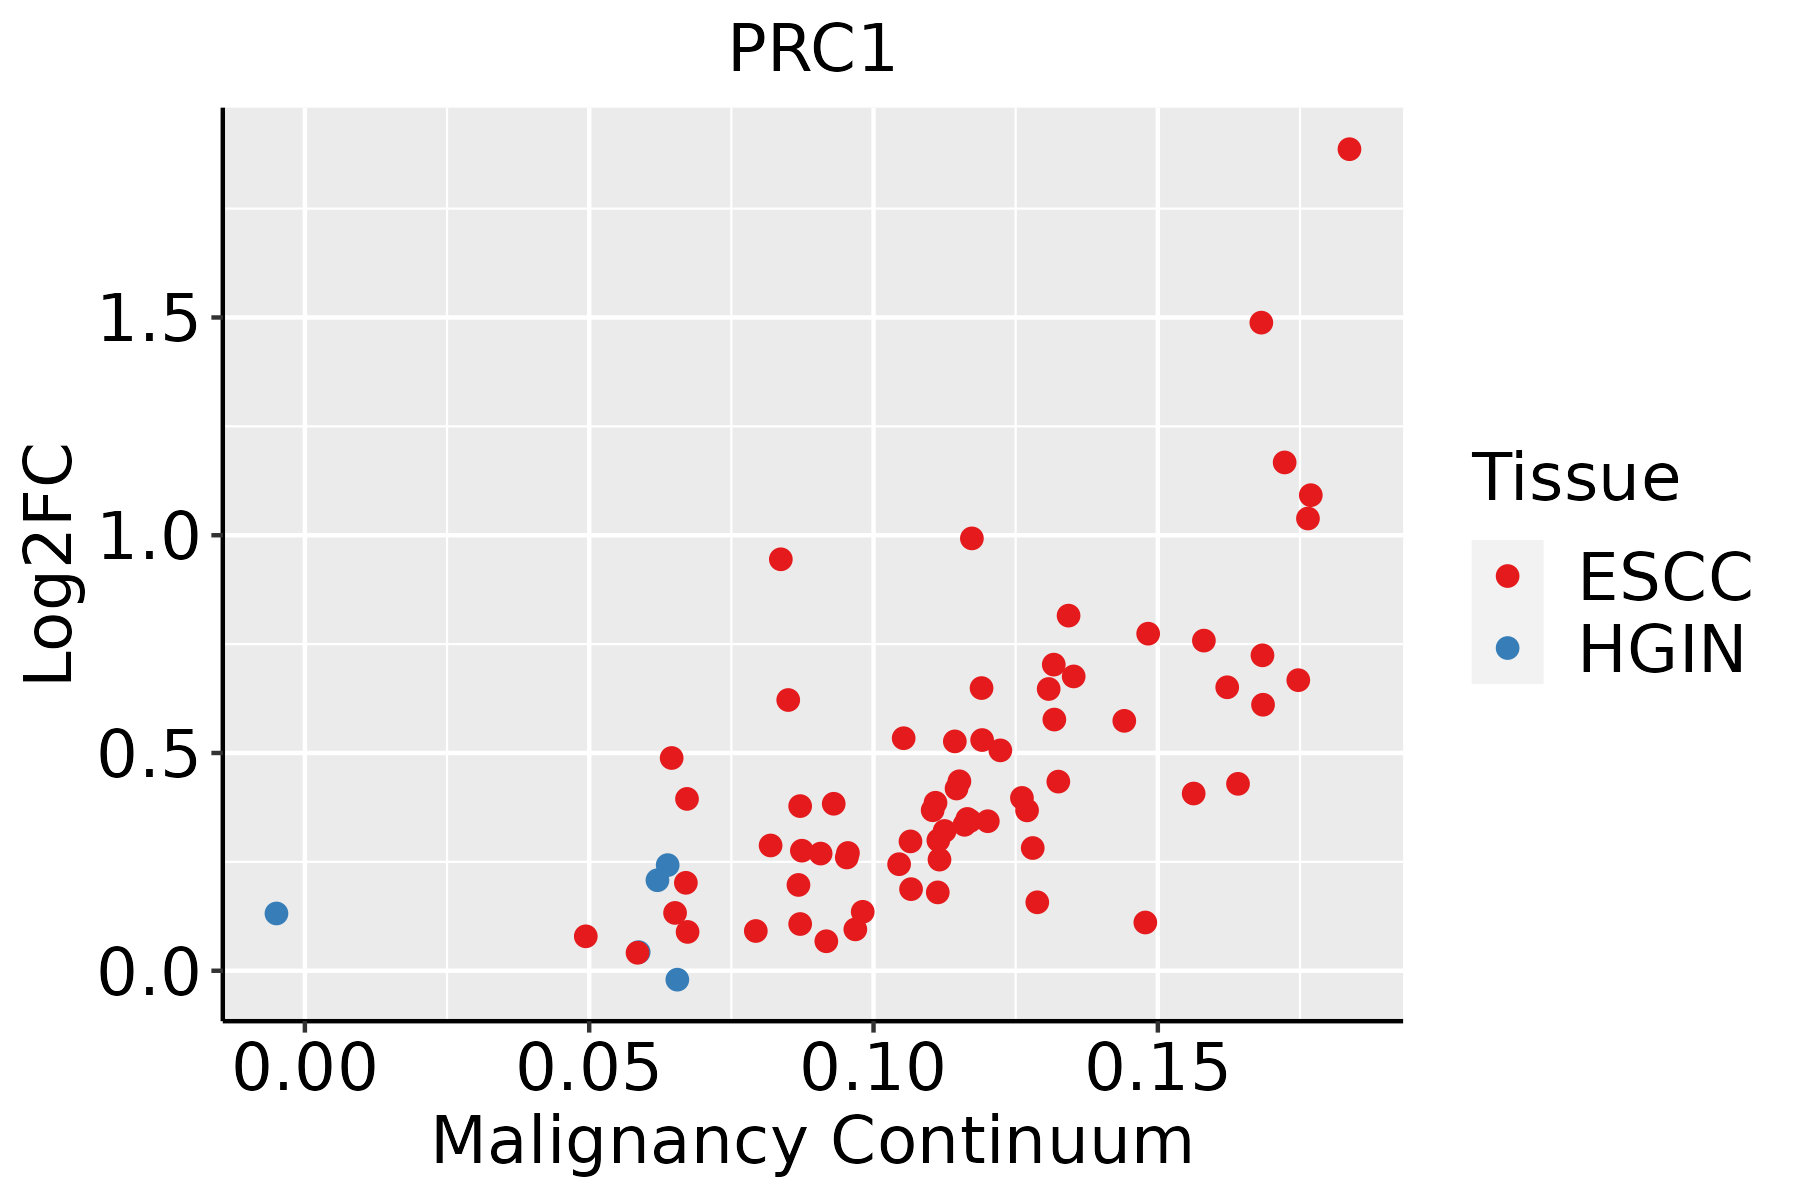
ESCC: Esophageal squamous cell carcinoma
HGIN: High-grade intraepithelial neoplasias
LGIN: Low-grade intraepithelial neoplasias
LiverThe image shows the transcriptomic changes along malignancy continuum.log2FC in expression of this searched gene in stem-like cells from each diseased tissue sample relative to stem-like cells in normal samples in each tissue plotted against the malignancy continuum. Samples are colored based on if they are from different disease stage.
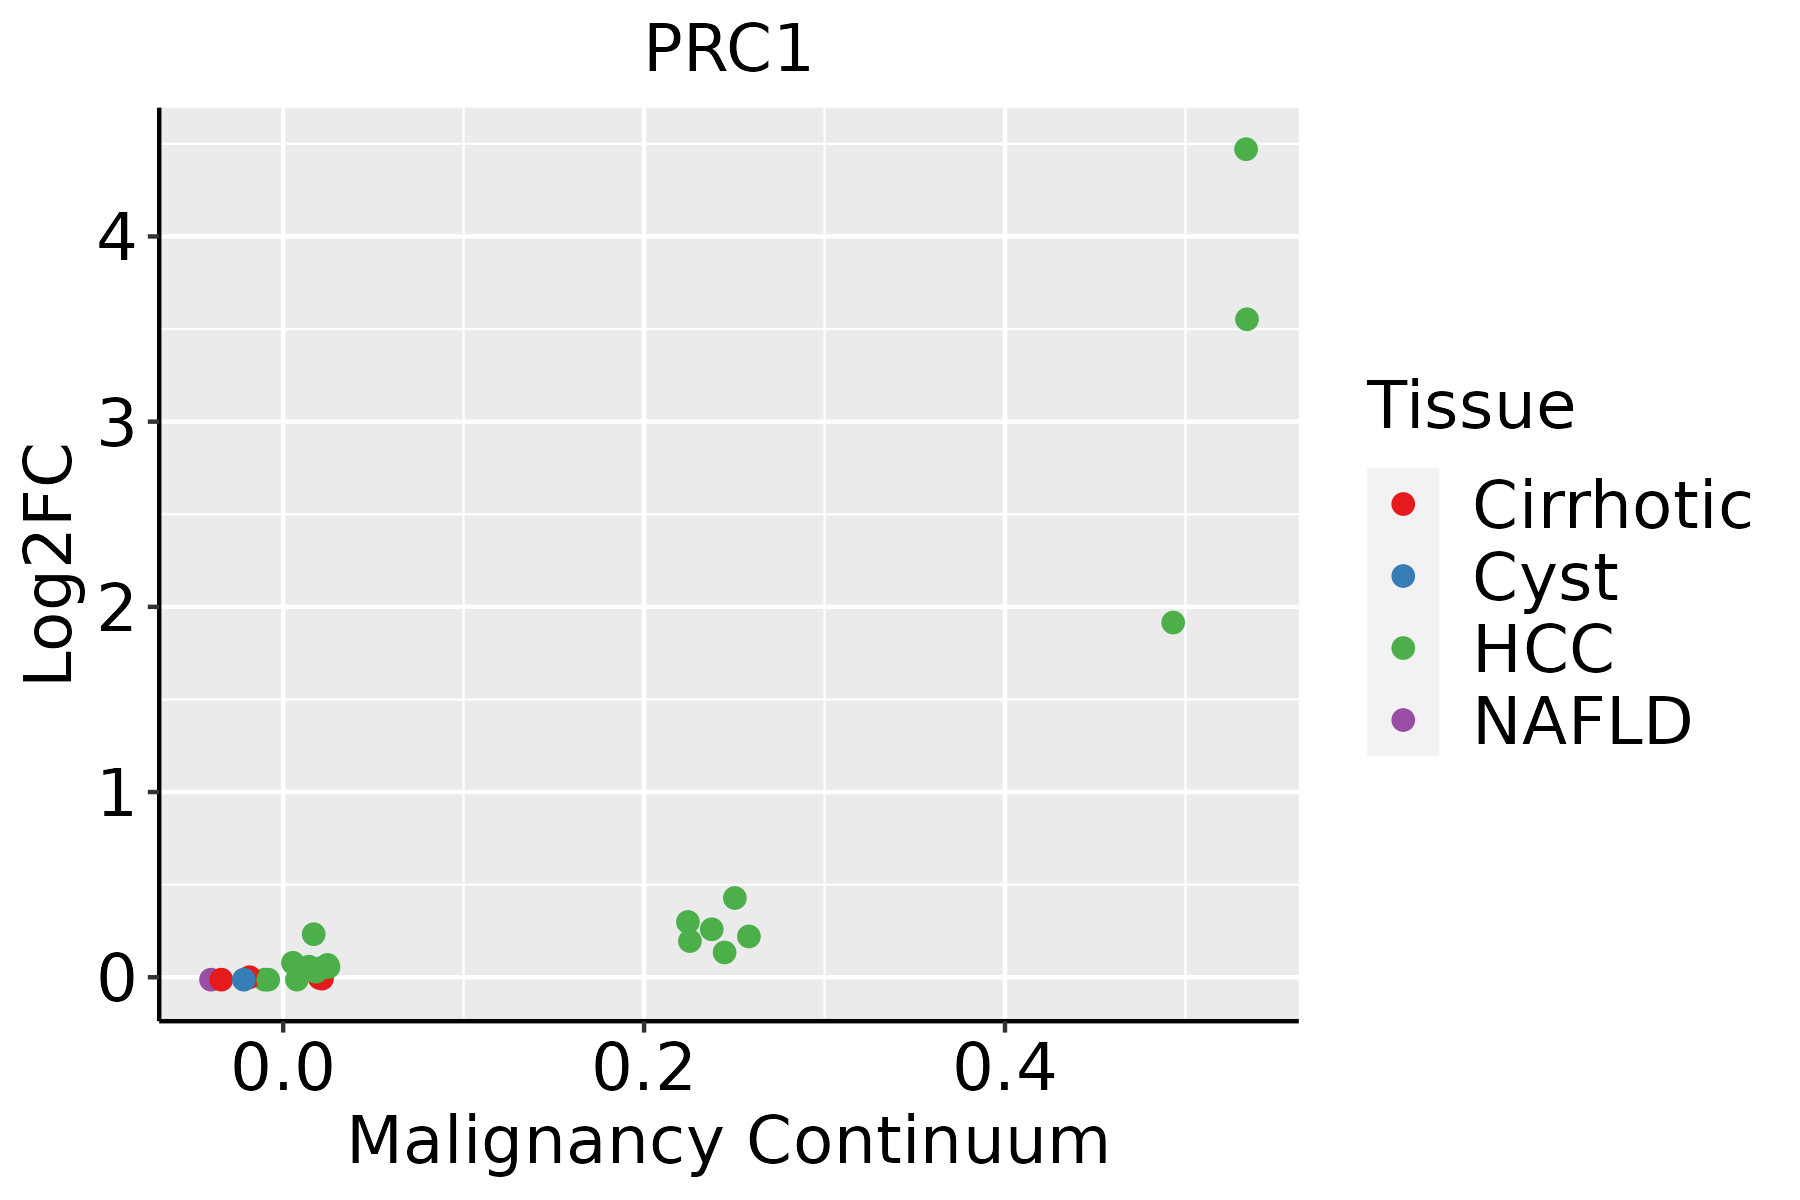
HCC: Hepatocellular carcinoma
NAFLD: Non-alcoholic fatty liver disease
Oral CavityThe image shows the transcriptomic changes along malignancy continuum.log2FC in expression of this searched gene in stem-like cells from each diseased tissue sample relative to stem-like cells in normal samples in each tissue plotted against the malignancy continuum. Samples are colored based on if they are from different disease stage.
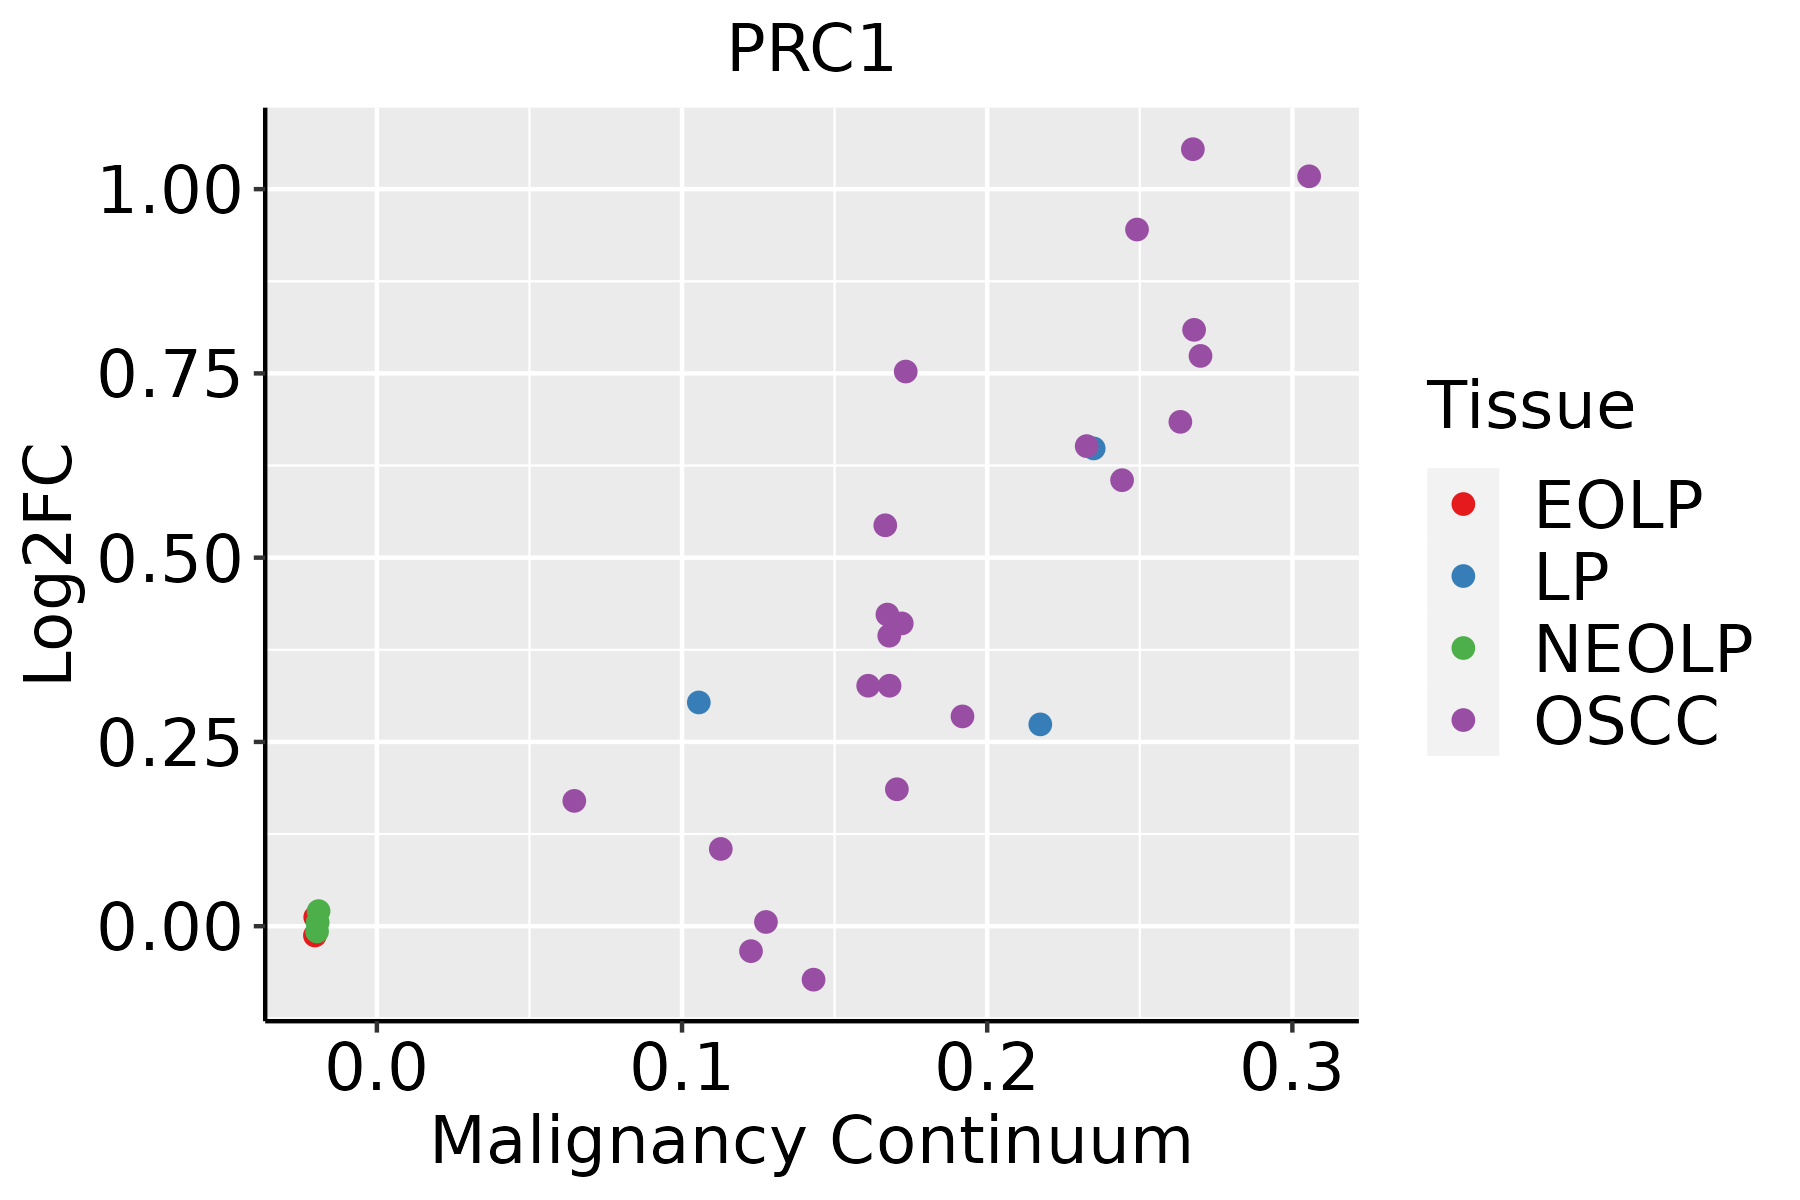
EOLP: Erosive Oral lichen planus
LP: leukoplakia
NEOLP: Non-erosive oral lichen planus
OSCC: Oral squamous cell carcinoma
SkinThe image shows the transcriptomic changes along malignancy continuum.log2FC in expression of this searched gene in stem-like cells from each diseased tissue sample relative to stem-like cells in normal samples in each tissue plotted against the malignancy continuum. Samples are colored based on if they are from different disease stage.
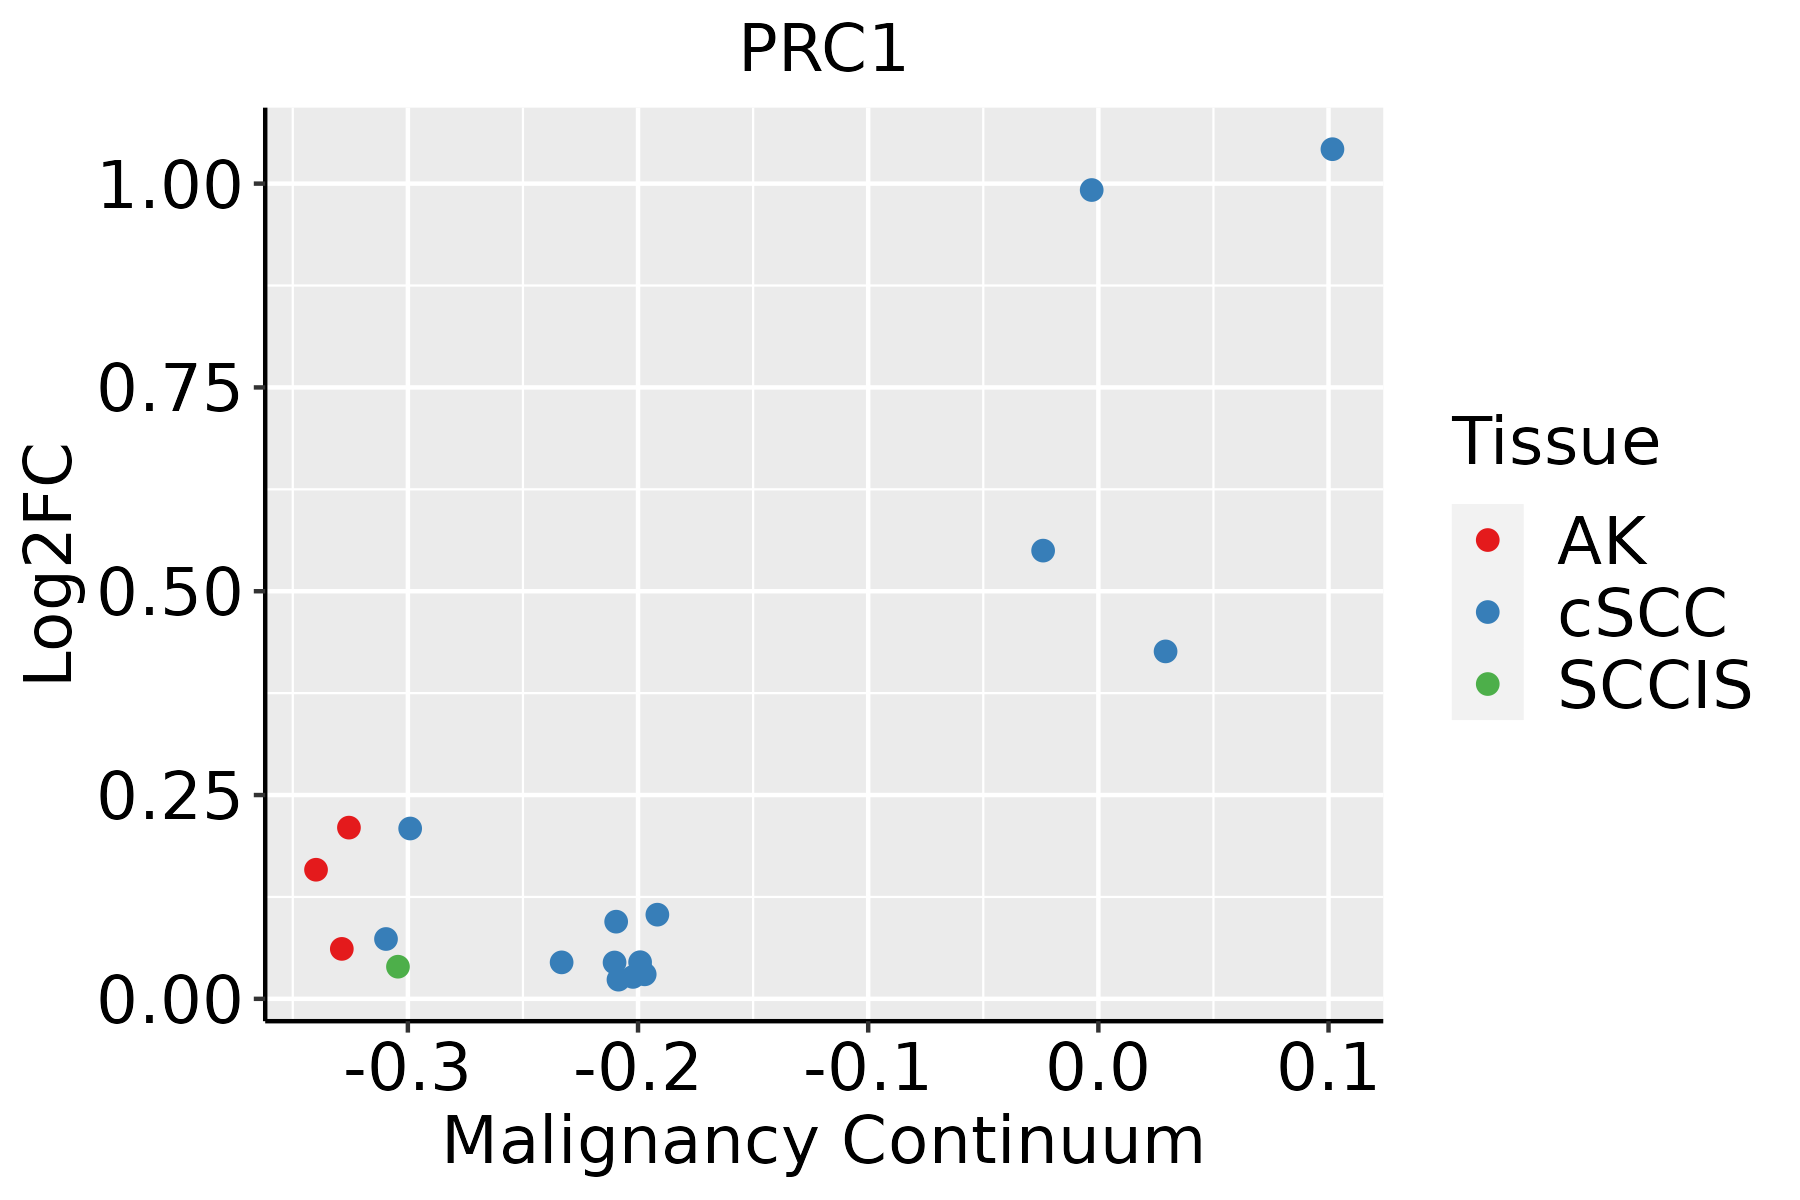
AK: Actinic keratosis
cSCC: Cutaneous squamous cell carcinoma
SCCIS:squamous cell carcinoma in situ
ThyroidThe image shows the transcriptomic changes along malignancy continuum.log2FC in expression of this searched gene in stem-like cells from each diseased tissue sample relative to stem-like cells in normal samples in each tissue plotted against the malignancy continuum. Samples are colored based on if they are from different disease stage.ATC: Anaplastic thyroid cancer
HT: Hashimoto's thyroiditis
PTC: Papillary thyroid cancer
∗log2FC in expression of this searched gene in stem-like cells from each diseased tissue sample relative to stem-like cells in normal samples in each tissue plotted against the malignancy continuum. Samples are colored based on if they are from different disease stage.

Top

Malignant transformation related pathway analysis

check buttonFind out the enriched GO biological processes and KEGG pathways involved in transition from healthy to precancer to cancer
check button Figure of enriched GO biological processes.
TissueDisease StageEnriched GO biological Processes
ColorectumADGO analysis - Figure of enriched GO biological processes: Top 15 enriched GO BP terms are showed in the bar plot of each disease state in each tissue. Each row represents a significant GO biological process which is colored according to the -log10(p.adjust).
ColorectumSERGO analysis - Figure of enriched GO biological processes: Top 15 enriched GO BP terms are showed in the bar plot of each disease state in each tissue. Each row represents a significant GO biological process which is colored according to the -log10(p.adjust).
ColorectumMSSGO analysis - Figure of enriched GO biological processes: Top 15 enriched GO BP terms are showed in the bar plot of each disease state in each tissue. Each row represents a significant GO biological process which is colored according to the -log10(p.adjust).
ColorectumMSI-HGO analysis - Figure of enriched GO biological processes: Top 15 enriched GO BP terms are showed in the bar plot of each disease state in each tissue. Each row represents a significant GO biological process which is colored according to the -log10(p.adjust).
ColorectumFAPGO analysis - Figure of enriched GO biological processes: Top 15 enriched GO BP terms are showed in the bar plot of each disease state in each tissue. Each row represents a significant GO biological process which is colored according to the -log10(p.adjust).
∗Top 15 enriched GO BP terms are showed in the bar plot of each disease state in each tissue. Each row represents a significant GO biological process which is colored according to the -log10(p.adjust).
Page: 1 2 3 4 5 6 7 8 9 

check button Enriched GO biological processes.
GO IDTissueDisease StageDescriptionGene RatioBg Ratiopvaluep.adjustCount
GO:014001414EsophagusESCCmitotic nuclear division218/8552287/187236.17e-261.78e-23218
GO:000007011EsophagusESCCmitotic sister chromatid segregation138/8552168/187231.37e-222.63e-20138
GO:00008194EsophagusESCCsister chromatid segregation157/8552202/187238.41e-211.33e-18157
GO:000705911EsophagusESCCchromosome segregation238/8552346/187231.72e-181.82e-16238
GO:190285015EsophagusESCCmicrotubule cytoskeleton organization involved in mitosis116/8552147/187231.25e-169.91e-15116
GO:000705214EsophagusESCCmitotic spindle organization97/8552120/187232.17e-151.33e-1397
GO:000705114EsophagusESCCspindle organization134/8552184/187235.70e-142.87e-12134
GO:00482853EsophagusESCCorganelle fission301/8552488/187234.64e-132.12e-11301
GO:00988133EsophagusESCCnuclear chromosome segregation187/8552281/187231.00e-124.36e-11187
GO:00002802EsophagusESCCnuclear division270/8552439/187231.17e-114.24e-10270
GO:00512256EsophagusESCCspindle assembly85/8552117/187232.72e-095.98e-0885
GO:009030715EsophagusESCCmitotic spindle assembly52/855265/187231.41e-082.77e-0752
GO:000091016EsophagusESCCcytokinesis115/8552173/187232.48e-084.68e-07115
GO:00510908EsophagusESCCregulation of DNA-binding transcription factor activity252/8552440/187235.22e-076.97e-06252
GO:00510918EsophagusESCCpositive regulation of DNA-binding transcription factor activity155/8552260/187233.83e-064.14e-05155
GO:00324653EsophagusESCCregulation of cytokinesis57/855292/187231.20e-035.88e-0357
GO:00513025EsophagusESCCregulation of cell division97/8552177/187238.93e-033.12e-0297
GO:014001411LiverHCCmitotic nuclear division174/7958287/187233.74e-101.23e-08174
GO:0000070LiverHCCmitotic sister chromatid segregation110/7958168/187231.42e-094.25e-08110
GO:00008191LiverHCCsister chromatid segregation128/7958202/187231.59e-094.73e-08128
Page: 1 2 3 4 5 

check button Enriched KEGG pathways.
Pathway IDTissueDisease StageDescriptionGene RatioBg Ratiopvaluep.adjustqvalueCount
Page: 1 

Top

Cell-cell communication analysis

check buttonIdentification of potential cell-cell interactions between two cell types and their ligand-receptor pairs for different disease states
LigandReceptorLRpairPathwayTissueDisease Stage
Page: 1 

Top

Single-cell gene regulatory network inference analysis

check buttonFind out the significant the regulons (TFs) and the target genes of each regulon across cell types for different disease states
TFCell TypeTissueDisease StageTarget GeneRSSRegulon Activity
∗The dot plots of a searched regulon are shown for all cell subpopulations in each disease state of each tissue based on the regulon specific score inferred using pySCENIC and by calculating the average expression.
Page: 1 

Top

Somatic mutation of malignant transformation related genes

check buttonAnnotation of somatic variants for genes involved in malignant transformation
Hugo SymbolVariant ClassVariant ClassificationdbSNP RSHGVScHGVSpHGVSp ShortSWISSPROTBIOTYPESIFTPolyPhenTumor Sample BarcodeTissueHistologySexAgeStageTherapy TypesDrugsOutcome
PRC1SNVMissense_Mutationc.589N>Ap.Glu197Lysp.E197KO43663protein_codingdeleterious(0)probably_damaging(0.996)TCGA-A2-A0CR-01Breastbreast invasive carcinomaFemale<65I/IIChemotherapyadriamycinCR
PRC1SNVMissense_Mutationc.1300N>Cp.Glu434Glnp.E434QO43663protein_codingtolerated(0.21)benign(0.095)TCGA-A8-A0A7-01Breastbreast invasive carcinomaFemale<65I/IIUnknownUnknownSD
PRC1SNVMissense_Mutationc.607N>Ap.Glu203Lysp.E203KO43663protein_codingdeleterious(0.02)probably_damaging(0.988)TCGA-D8-A1JA-01Breastbreast invasive carcinomaFemale<65III/IVChemotherapyadriamycinPD
PRC1SNVMissense_Mutationc.404N>Cp.Leu135Prop.L135PO43663protein_codingdeleterious(0)probably_damaging(0.999)TCGA-E9-A1R4-01Breastbreast invasive carcinomaFemale>=65I/IIChemotherapy5-fluorouracilSD
PRC1insertionFrame_Shift_Insnovelc.58_59insCACTCTGTGCAGCGAGTTACp.Asn20ThrfsTer16p.N20Tfs*16O43663protein_codingTCGA-A8-A09T-01Breastbreast invasive carcinomaFemale>=65I/IIHormone TherapyanastrozoleSD
PRC1insertionFrame_Shift_Insnovelc.59_60insGTCTCGCTGTGTTGTCCAGGCAGGAGTGCAATGGTGTGGTCTCp.Asn20LysfsTer36p.N20Kfs*36O43663protein_codingTCGA-BH-A0B8-01Breastbreast invasive carcinomaFemale<65I/IIHormone TherapyarimidexSD
PRC1deletionFrame_Shift_Delnovelc.1155delNp.Leu386Terp.L386*O43663protein_codingTCGA-D8-A27V-01Breastbreast invasive carcinomaFemale<65I/IIHormone TherapytamoxiphenSD
PRC1SNVMissense_Mutationc.1068G>Cp.Gln356Hisp.Q356HO43663protein_codingtolerated(0.29)benign(0.021)TCGA-C5-A1BQ-01Cervixcervical & endocervical cancerFemale>=65III/IVChemotherapycisplatinCR
PRC1SNVMissense_Mutationc.94N>Tp.Pro32Serp.P32SO43663protein_codingdeleterious(0.02)possibly_damaging(0.574)TCGA-AA-A00N-01Colorectumcolon adenocarcinomaMale>=65I/IIUnknownUnknownPD
PRC1SNVMissense_Mutationrs573547983c.511C>Tp.Arg171Cysp.R171CO43663protein_codingdeleterious(0.01)possibly_damaging(0.601)TCGA-G4-6628-01Colorectumcolon adenocarcinomaMale>=65I/IIUnknownUnknownSD
Page: 1 2 3 4 5 6 

Top

Related drugs of malignant transformation related genes

check buttonIdentification of chemicals and drugs interact with genes involved in malignant transfromation
(DGIdb 4.0)
Entrez IDSymbolCategoryInteraction TypesDrug Claim NameDrug NamePMIDs
Page: 1