
|
|||||
|
 | |
| |
| |
| |
| |
| |
|
Gene: PRAME |
Gene summary for PRAME |
| Gene information | Species | Human | Gene symbol | PRAME | Gene ID | 23532 |
| Gene name | PRAME nuclear receptor transcriptional regulator | |
| Gene Alias | CT130 | |
| Cytomap | 22q11.22 | |
| Gene Type | protein-coding | GO ID | GO:0000209 | UniProtAcc | A0A024R1E6 |
Top |
Malignant transformation analysis |
| Identification of the aberrant gene expression in precancerous and cancerous lesions by comparing the gene expression of stem-like cells in diseased tissues with normal stem cells |
| Entrez ID | Symbol | Replicates | Species | Organ | Tissue | Adj P-value | Log2FC | Malignancy |
| 23532 | PRAME | AEH-subject1 | Human | Endometrium | AEH | 9.76e-06 | 2.72e-01 | -0.3059 |
| 23532 | PRAME | AEH-subject2 | Human | Endometrium | AEH | 6.18e-08 | 3.37e-01 | -0.2525 |
| 23532 | PRAME | AEH-subject3 | Human | Endometrium | AEH | 2.39e-09 | 4.06e-01 | -0.2576 |
| 23532 | PRAME | AEH-subject4 | Human | Endometrium | AEH | 4.70e-07 | 3.31e-01 | -0.2657 |
| 23532 | PRAME | EEC-subject1 | Human | Endometrium | EEC | 4.84e-06 | 3.89e-01 | -0.2682 |
| 23532 | PRAME | EEC-subject2 | Human | Endometrium | EEC | 1.25e-14 | 4.95e-01 | -0.2607 |
| 23532 | PRAME | EEC-subject5 | Human | Endometrium | EEC | 3.99e-10 | 3.88e-01 | -0.249 |
| 23532 | PRAME | GSM5276935 | Human | Endometrium | EEC | 1.14e-74 | 1.02e+00 | -0.123 |
| 23532 | PRAME | GSM6177620_NYU_UCEC1_lib1_lib1 | Human | Endometrium | EEC | 2.89e-11 | 5.51e-01 | -0.1869 |
| 23532 | PRAME | GSM6177620_NYU_UCEC1_lib2_lib2 | Human | Endometrium | EEC | 2.31e-10 | 6.04e-01 | -0.1875 |
| 23532 | PRAME | GSM6177620_NYU_UCEC1_lib3_lib3 | Human | Endometrium | EEC | 1.85e-11 | 5.94e-01 | -0.1883 |
| 23532 | PRAME | GSM6177621_NYU_UCEC2_lib1_lib1 | Human | Endometrium | EEC | 4.91e-10 | 5.21e-01 | -0.1934 |
| 23532 | PRAME | GSM6177622_NYU_UCEC3_lib1_lib1 | Human | Endometrium | EEC | 3.14e-21 | 7.02e-01 | -0.1917 |
| 23532 | PRAME | GSM6177622_NYU_UCEC3_lib2_lib2 | Human | Endometrium | EEC | 1.26e-11 | 5.30e-01 | -0.1916 |
| 23532 | PRAME | GSM6177623_NYU_UCEC3_Vis | Human | Endometrium | EEC | 5.82e-36 | 9.13e-01 | -0.1269 |
| 23532 | PRAME | LZE2T | Human | Esophagus | ESCC | 1.52e-08 | 5.62e-01 | 0.082 |
| 23532 | PRAME | LZE4T | Human | Esophagus | ESCC | 9.56e-12 | 3.17e-01 | 0.0811 |
| 23532 | PRAME | LZE7T | Human | Esophagus | ESCC | 6.33e-03 | 1.77e-01 | 0.0667 |
| 23532 | PRAME | LZE24T | Human | Esophagus | ESCC | 4.15e-02 | 1.06e-01 | 0.0596 |
| 23532 | PRAME | P2T-E | Human | Esophagus | ESCC | 1.77e-86 | 1.42e+00 | 0.1177 |
| Page: 1 2 3 4 |
| Tissue | Expression Dynamics | Abbreviation |
| Endometrium |  | AEH: Atypical endometrial hyperplasia |
| EEC: Endometrioid Cancer | ||
| Esophagus |  | ESCC: Esophageal squamous cell carcinoma |
| HGIN: High-grade intraepithelial neoplasias | ||
| LGIN: Low-grade intraepithelial neoplasias | ||
| Liver | 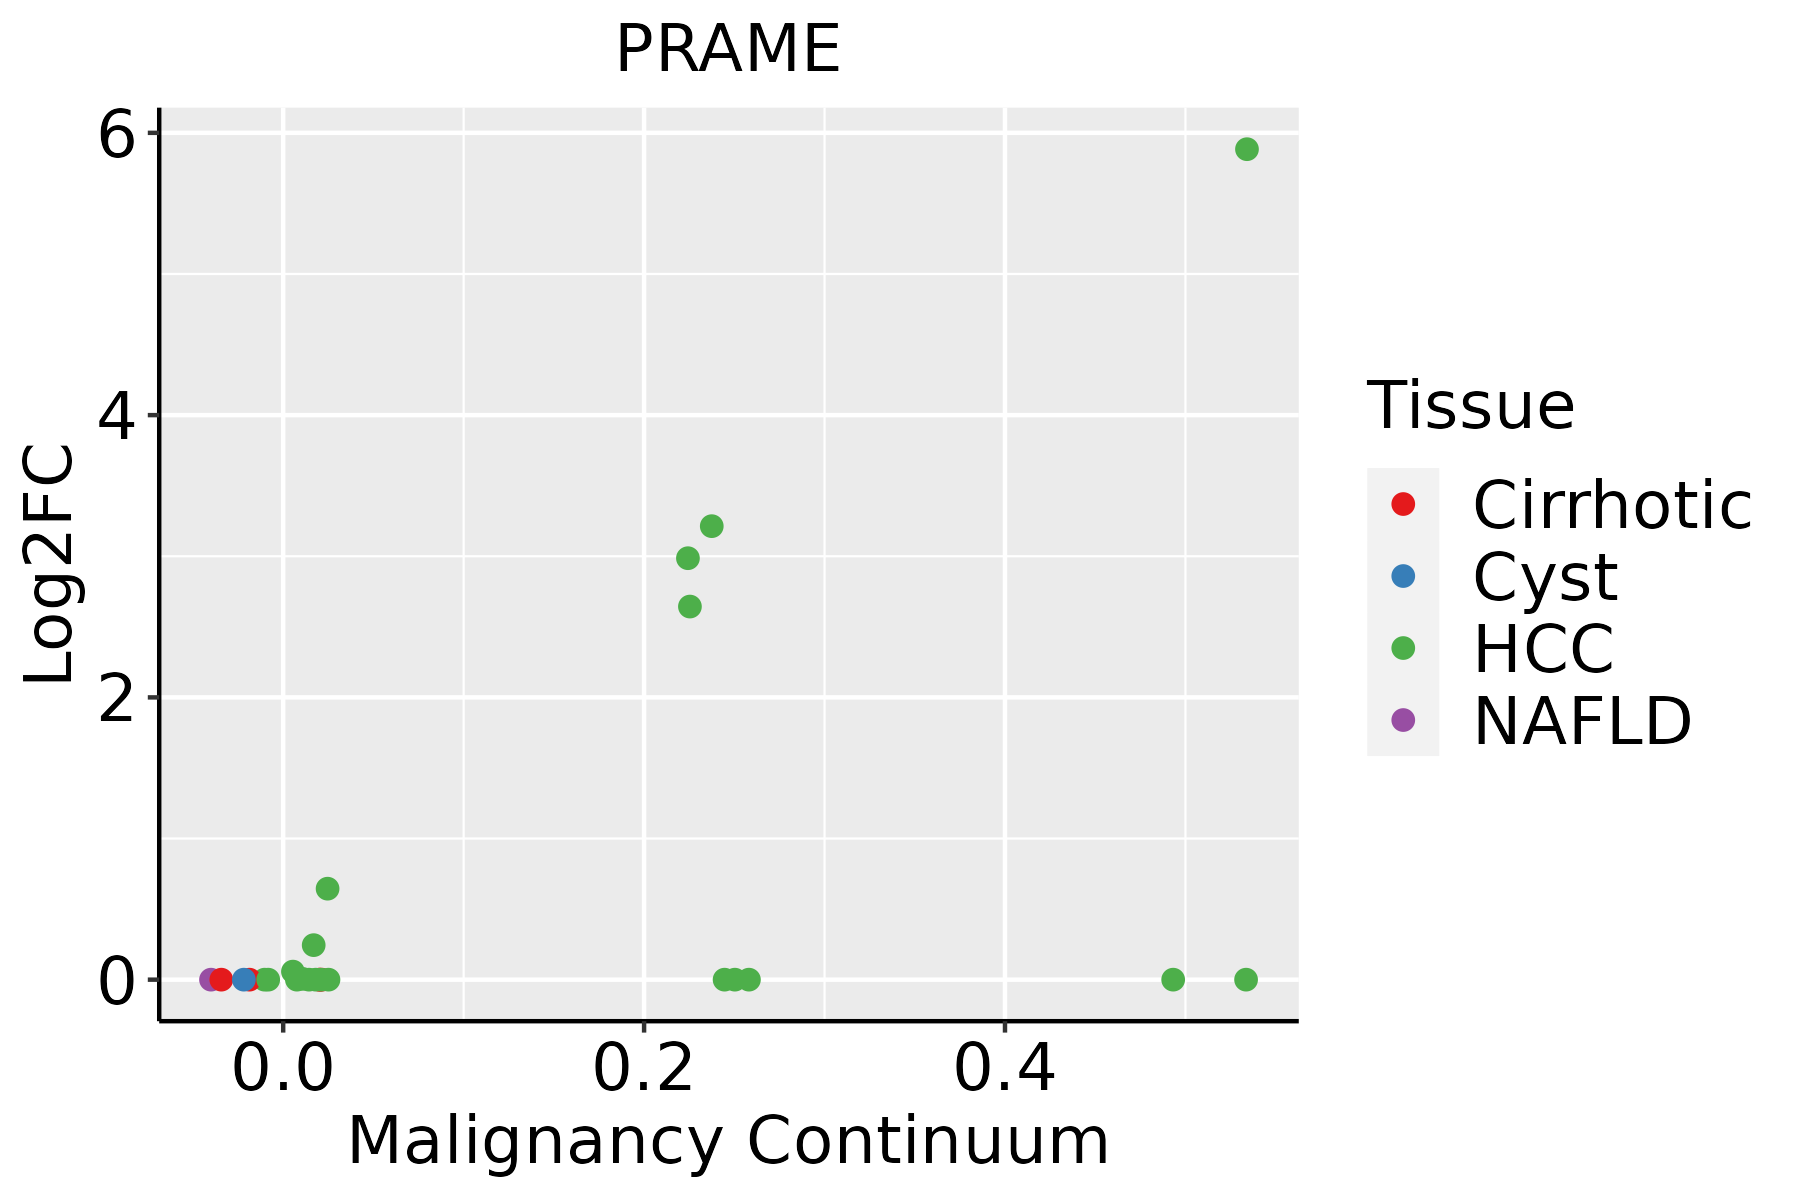 | HCC: Hepatocellular carcinoma |
| NAFLD: Non-alcoholic fatty liver disease | ||
| Oral Cavity | 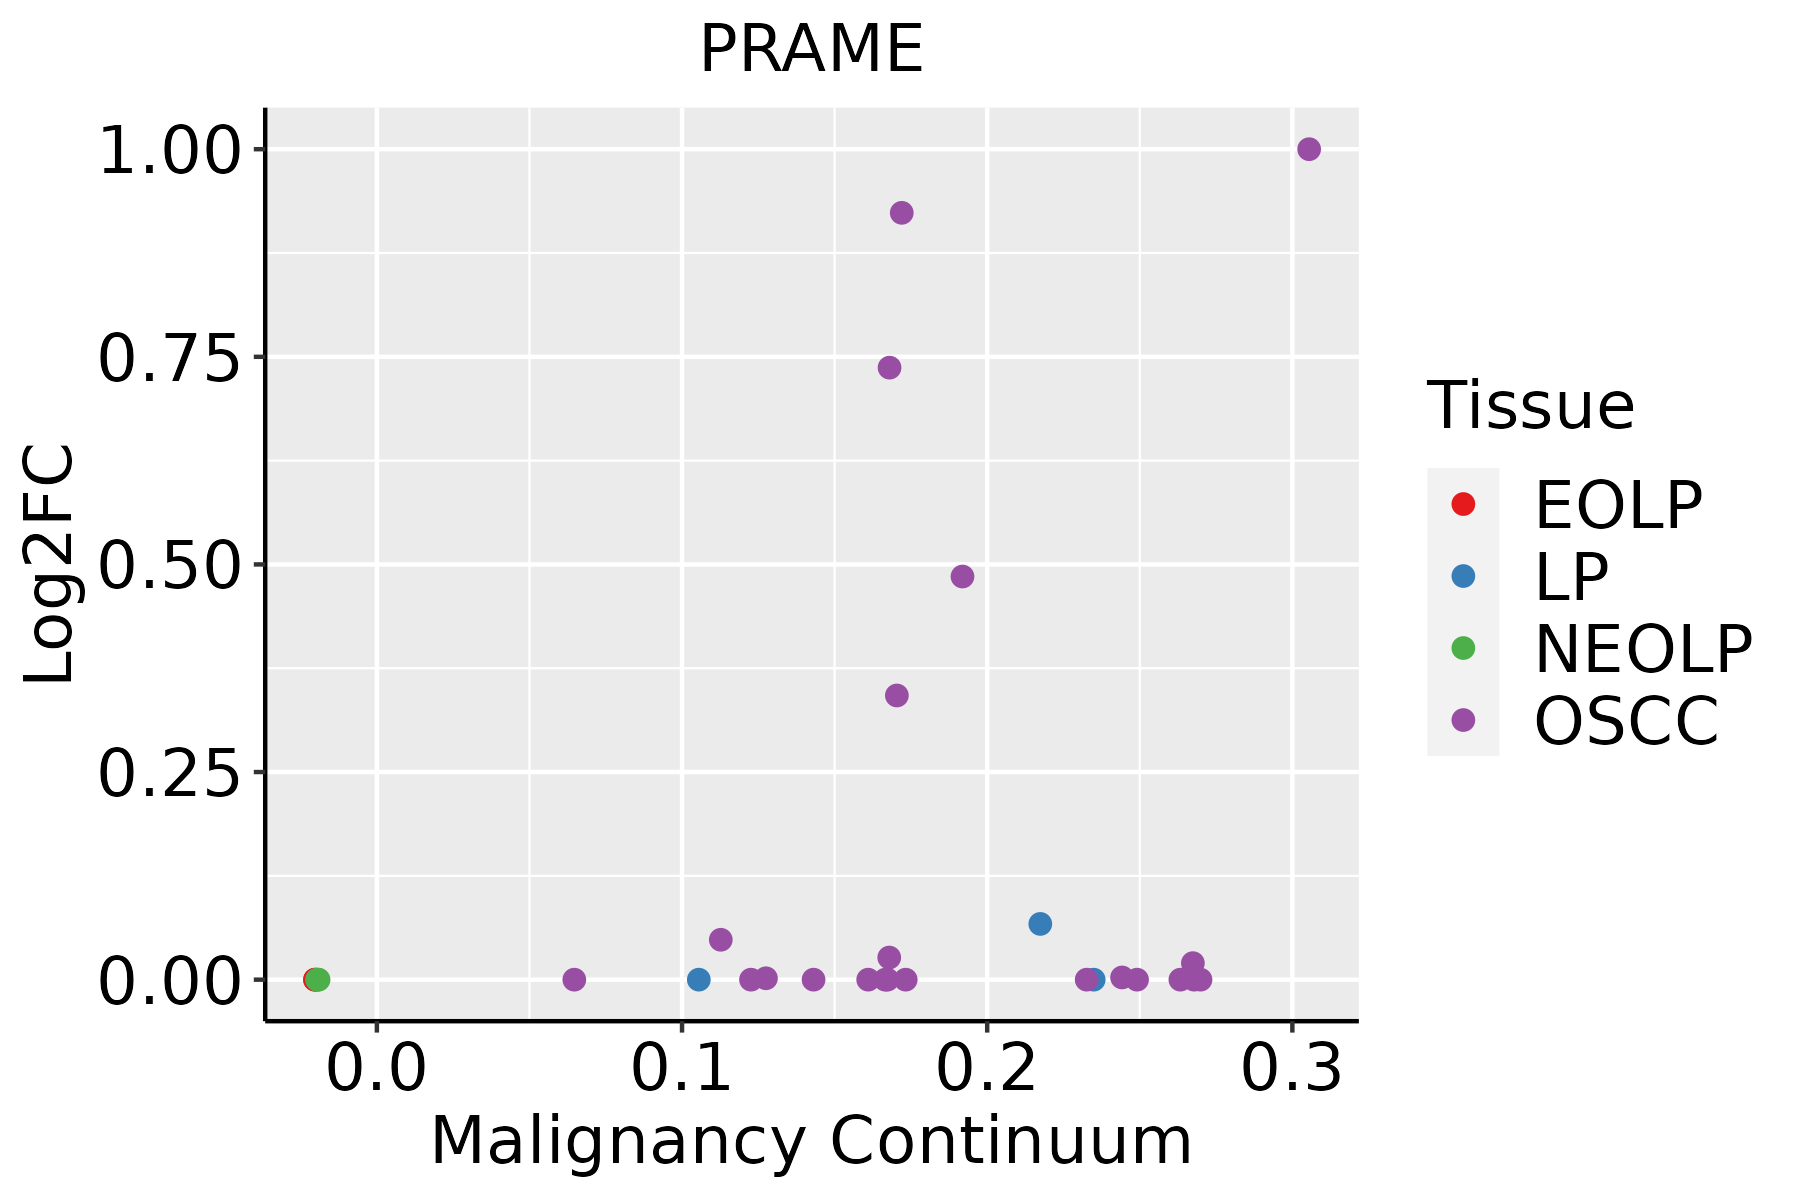 | EOLP: Erosive Oral lichen planus |
| LP: leukoplakia | ||
| NEOLP: Non-erosive oral lichen planus | ||
| OSCC: Oral squamous cell carcinoma | ||
| Thyroid | 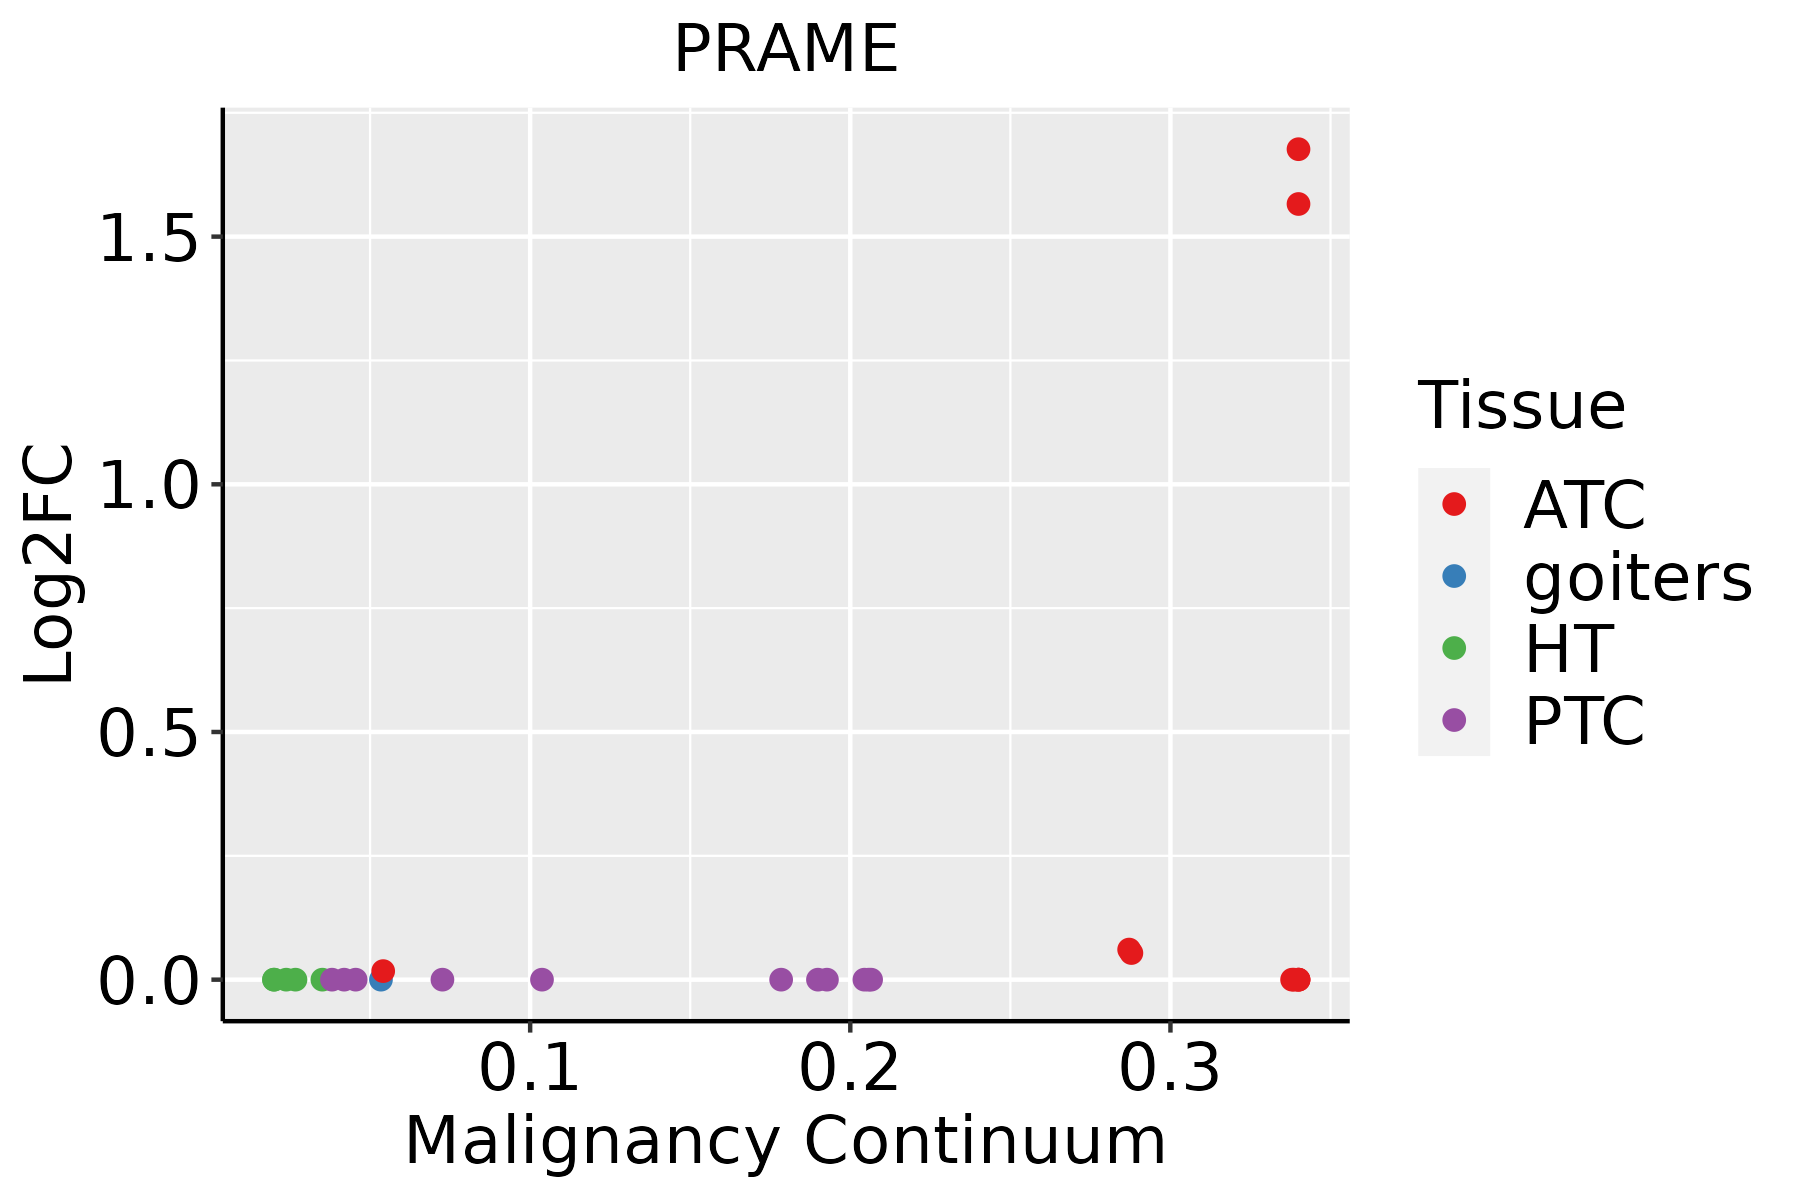 | ATC: Anaplastic thyroid cancer |
| HT: Hashimoto's thyroiditis | ||
| PTC: Papillary thyroid cancer |
| ∗log2FC in expression of this searched gene in stem-like cells from each diseased tissue sample relative to stem-like cells in normal samples in each tissue plotted against the malignancy continuum. Samples are colored based on if they are from different disease stage. |
Top |
Malignant transformation related pathway analysis |
| Find out the enriched GO biological processes and KEGG pathways involved in transition from healthy to precancer to cancer |
| Tissue | Disease Stage | Enriched GO biological Processes |
| Colorectum | AD |  |
| Colorectum | SER |  |
| Colorectum | MSS |  |
| Colorectum | MSI-H |  |
| Colorectum | FAP |  |
| ∗Top 15 enriched GO BP terms are showed in the bar plot of each disease state in each tissue. Each row represents a significant GO biological process which is colored according to the -log10(p.adjust). |
| Page: 1 2 3 4 5 6 7 8 9 |
| GO ID | Tissue | Disease Stage | Description | Gene Ratio | Bg Ratio | pvalue | p.adjust | Count |
| GO:001049816 | Endometrium | AEH | proteasomal protein catabolic process | 108/2100 | 490/18723 | 2.73e-12 | 4.67e-10 | 108 |
| GO:004316116 | Endometrium | AEH | proteasome-mediated ubiquitin-dependent protein catabolic process | 88/2100 | 412/18723 | 1.54e-09 | 1.36e-07 | 88 |
| GO:003052210 | Endometrium | AEH | intracellular receptor signaling pathway | 60/2100 | 265/18723 | 7.16e-08 | 3.77e-06 | 60 |
| GO:00002098 | Endometrium | AEH | protein polyubiquitination | 44/2100 | 236/18723 | 4.83e-04 | 4.97e-03 | 44 |
| GO:00483842 | Endometrium | AEH | retinoic acid receptor signaling pathway | 10/2100 | 31/18723 | 1.48e-03 | 1.23e-02 | 10 |
| GO:00483852 | Endometrium | AEH | regulation of retinoic acid receptor signaling pathway | 6/2100 | 16/18723 | 5.84e-03 | 3.55e-02 | 6 |
| GO:001049817 | Endometrium | EEC | proteasomal protein catabolic process | 112/2168 | 490/18723 | 6.99e-13 | 1.40e-10 | 112 |
| GO:004316117 | Endometrium | EEC | proteasome-mediated ubiquitin-dependent protein catabolic process | 92/2168 | 412/18723 | 3.01e-10 | 3.23e-08 | 92 |
| GO:003052215 | Endometrium | EEC | intracellular receptor signaling pathway | 65/2168 | 265/18723 | 2.52e-09 | 1.96e-07 | 65 |
| GO:000020913 | Endometrium | EEC | protein polyubiquitination | 46/2168 | 236/18723 | 2.65e-04 | 3.04e-03 | 46 |
| GO:004838411 | Endometrium | EEC | retinoic acid receptor signaling pathway | 10/2168 | 31/18723 | 1.89e-03 | 1.45e-02 | 10 |
| GO:004838511 | Endometrium | EEC | regulation of retinoic acid receptor signaling pathway | 6/2168 | 16/18723 | 6.84e-03 | 3.96e-02 | 6 |
| GO:0010498111 | Esophagus | ESCC | proteasomal protein catabolic process | 369/8552 | 490/18723 | 1.13e-41 | 1.80e-38 | 369 |
| GO:0043161111 | Esophagus | ESCC | proteasome-mediated ubiquitin-dependent protein catabolic process | 312/8552 | 412/18723 | 3.53e-36 | 4.48e-33 | 312 |
| GO:000020917 | Esophagus | ESCC | protein polyubiquitination | 170/8552 | 236/18723 | 1.40e-16 | 1.09e-14 | 170 |
| GO:0030522110 | Esophagus | ESCC | intracellular receptor signaling pathway | 170/8552 | 265/18723 | 8.58e-10 | 2.09e-08 | 170 |
| GO:004838412 | Esophagus | ESCC | retinoic acid receptor signaling pathway | 22/8552 | 31/18723 | 3.90e-03 | 1.58e-02 | 22 |
| GO:001049822 | Liver | HCC | proteasomal protein catabolic process | 351/7958 | 490/18723 | 6.92e-40 | 1.46e-36 | 351 |
| GO:004316122 | Liver | HCC | proteasome-mediated ubiquitin-dependent protein catabolic process | 299/7958 | 412/18723 | 7.82e-36 | 8.27e-33 | 299 |
| GO:003052222 | Liver | HCC | intracellular receptor signaling pathway | 171/7958 | 265/18723 | 3.00e-13 | 1.61e-11 | 171 |
| Page: 1 2 |
| Pathway ID | Tissue | Disease Stage | Description | Gene Ratio | Bg Ratio | pvalue | p.adjust | qvalue | Count |
| Page: 1 |
Top |
Cell-cell communication analysis |
| Identification of potential cell-cell interactions between two cell types and their ligand-receptor pairs for different disease states |
| Ligand | Receptor | LRpair | Pathway | Tissue | Disease Stage |
| Page: 1 |
Top |
Single-cell gene regulatory network inference analysis |
| Find out the significant the regulons (TFs) and the target genes of each regulon across cell types for different disease states |
| TF | Cell Type | Tissue | Disease Stage | Target Gene | RSS | Regulon Activity |
| ∗The dot plots of a searched regulon are shown for all cell subpopulations in each disease state of each tissue based on the regulon specific score inferred using pySCENIC and by calculating the average expression. |
| Page: 1 |
Top |
Somatic mutation of malignant transformation related genes |
| Annotation of somatic variants for genes involved in malignant transformation |
| Hugo Symbol | Variant Class | Variant Classification | dbSNP RS | HGVSc | HGVSp | HGVSp Short | SWISSPROT | BIOTYPE | SIFT | PolyPhen | Tumor Sample Barcode | Tissue | Histology | Sex | Age | Stage | Therapy Types | Drugs | Outcome |
| PRAME | SNV | Missense_Mutation | c.1340N>A | p.Ser447Asn | p.S447N | P78395 | protein_coding | deleterious(0.03) | benign(0.26) | TCGA-AO-A0JD-01 | Breast | breast invasive carcinoma | Female | <65 | III/IV | Chemotherapy | cyclophosphamide | SD | |
| PRAME | SNV | Missense_Mutation | rs765231019 | c.476N>A | p.Arg159Gln | p.R159Q | P78395 | protein_coding | tolerated(0.54) | benign(0.007) | TCGA-C8-A12Q-01 | Breast | breast invasive carcinoma | Female | >=65 | III/IV | Unknown | Unknown | PD |
| PRAME | insertion | Frame_Shift_Ins | novel | c.252_253insAAGAAAAATGTACTACGCCT | p.Val85LysfsTer9 | p.V85Kfs*9 | P78395 | protein_coding | TCGA-A8-A08H-01 | Breast | breast invasive carcinoma | Female | >=65 | I/II | Unknown | Unknown | SD | ||
| PRAME | insertion | Nonsense_Mutation | novel | c.704_705insGGAGATGTGGGAGAAGGAACAACAGAGAAATTGCAAAAATTGA | p.Ile235MetfsTer15 | p.I235Mfs*15 | P78395 | protein_coding | TCGA-AQ-A04J-01 | Breast | breast invasive carcinoma | Female | <65 | I/II | Chemotherapy | cytoxan | SD | ||
| PRAME | SNV | Missense_Mutation | novel | c.122N>T | p.Ala41Val | p.A41V | P78395 | protein_coding | tolerated(0.06) | possibly_damaging(0.462) | TCGA-2W-A8YY-01 | Cervix | cervical & endocervical cancer | Female | <65 | I/II | Chemotherapy | cisplatin | CR |
| PRAME | SNV | Missense_Mutation | novel | c.712N>A | p.Leu238Met | p.L238M | P78395 | protein_coding | deleterious(0.02) | possibly_damaging(0.511) | TCGA-DS-A1OC-01 | Cervix | cervical & endocervical cancer | Female | <65 | I/II | Chemotherapy | gemcitabine | SD |
| PRAME | SNV | Missense_Mutation | novel | c.430N>C | p.Tyr144His | p.Y144H | P78395 | protein_coding | tolerated(0.49) | possibly_damaging(0.601) | TCGA-AA-3851-01 | Colorectum | colon adenocarcinoma | Male | >=65 | I/II | Unknown | Unknown | SD |
| PRAME | SNV | Missense_Mutation | novel | c.1505N>G | p.Leu502Arg | p.L502R | P78395 | protein_coding | tolerated(0.07) | possibly_damaging(0.898) | TCGA-AA-3877-01 | Colorectum | colon adenocarcinoma | Female | >=65 | I/II | Unknown | Unknown | SD |
| PRAME | SNV | Missense_Mutation | c.1285N>T | p.His429Tyr | p.H429Y | P78395 | protein_coding | deleterious(0.02) | possibly_damaging(0.797) | TCGA-CK-6747-01 | Colorectum | colon adenocarcinoma | Female | >=65 | I/II | Unknown | Unknown | SD | |
| PRAME | SNV | Missense_Mutation | rs116965324 | c.620N>A | p.Arg207His | p.R207H | P78395 | protein_coding | tolerated(1) | benign(0) | TCGA-CK-6751-01 | Colorectum | colon adenocarcinoma | Female | >=65 | I/II | Unknown | Unknown | SD |
| Page: 1 2 3 4 5 6 7 8 |
Top |
Related drugs of malignant transformation related genes |
| Identification of chemicals and drugs interact with genes involved in malignant transfromation |
| (DGIdb 4.0) |
| Entrez ID | Symbol | Category | Interaction Types | Drug Claim Name | Drug Name | PMIDs |
| Page: 1 |

Copyright 2023-Present -The University of Texas Health Science Center at Houston |