
|
|||||
|
 | |
| |
| |
| |
| |
| |
|
Gene: PRAC1 |
Gene summary for PRAC1 |
| Gene information | Species | Human | Gene symbol | PRAC1 | Gene ID | 84366 |
| Gene name | PRAC1 small nuclear protein | |
| Gene Alias | C17orf92 | |
| Cytomap | 17q21.32 | |
| Gene Type | protein-coding | GO ID | GO:0005575 | UniProtAcc | Q96KF2 |
Top |
Malignant transformation analysis |
| Identification of the aberrant gene expression in precancerous and cancerous lesions by comparing the gene expression of stem-like cells in diseased tissues with normal stem cells |
| Entrez ID | Symbol | Replicates | Species | Organ | Tissue | Adj P-value | Log2FC | Malignancy |
| 84366 | PRAC1 | HTA11_347_2000001011 | Human | Colorectum | AD | 1.96e-50 | 1.40e+00 | -0.1954 |
| 84366 | PRAC1 | HTA11_411_2000001011 | Human | Colorectum | SER | 8.90e-11 | 1.60e+00 | -0.2602 |
| 84366 | PRAC1 | HTA11_2112_2000001011 | Human | Colorectum | SER | 1.47e-02 | 8.18e-01 | -0.2196 |
| 84366 | PRAC1 | HTA11_696_2000001011 | Human | Colorectum | AD | 4.44e-41 | 1.17e+00 | -0.1464 |
| 84366 | PRAC1 | HTA11_2992_2000001011 | Human | Colorectum | SER | 1.68e-11 | 1.11e+00 | -0.1706 |
| 84366 | PRAC1 | HTA11_5212_2000001011 | Human | Colorectum | AD | 2.79e-19 | 1.02e+00 | -0.2061 |
| 84366 | PRAC1 | HTA11_5216_2000001011 | Human | Colorectum | SER | 2.33e-10 | 9.56e-01 | -0.1462 |
| 84366 | PRAC1 | HTA11_7862_2000001011 | Human | Colorectum | AD | 2.10e-22 | 1.28e+00 | -0.0179 |
| 84366 | PRAC1 | HTA11_866_3004761011 | Human | Colorectum | AD | 8.91e-21 | 6.70e-01 | 0.096 |
| 84366 | PRAC1 | HTA11_7696_3000711011 | Human | Colorectum | AD | 8.62e-04 | -1.43e-01 | 0.0674 |
| 84366 | PRAC1 | HTA11_6818_2000001011 | Human | Colorectum | AD | 2.10e-05 | 5.98e-01 | 0.0112 |
| 84366 | PRAC1 | HTA11_11156_2000001011 | Human | Colorectum | AD | 1.06e-07 | 9.99e-01 | 0.0397 |
| 84366 | PRAC1 | HTA11_6818_2000001021 | Human | Colorectum | AD | 1.15e-02 | 3.16e-01 | 0.0588 |
| 84366 | PRAC1 | HTA11_99999970781_79442 | Human | Colorectum | MSS | 2.00e-05 | -1.43e-01 | 0.294 |
| 84366 | PRAC1 | HTA11_99999965104_69814 | Human | Colorectum | MSS | 8.35e-19 | 8.70e-01 | 0.281 |
| 84366 | PRAC1 | HTA11_99999971662_82457 | Human | Colorectum | MSS | 2.10e-61 | 1.66e+00 | 0.3859 |
| 84366 | PRAC1 | HTA11_99999974143_84620 | Human | Colorectum | MSS | 4.25e-05 | -1.43e-01 | 0.3005 |
| 84366 | PRAC1 | A015-C-203 | Human | Colorectum | FAP | 4.07e-04 | -1.43e-01 | -0.1294 |
| 84366 | PRAC1 | A002-C-201 | Human | Colorectum | FAP | 1.71e-02 | -1.43e-01 | 0.0324 |
| 84366 | PRAC1 | A002-C-203 | Human | Colorectum | FAP | 1.92e-04 | -1.43e-01 | 0.2786 |
| Page: 1 2 3 |
| Tissue | Expression Dynamics | Abbreviation |
| Colorectum (GSE201348) |  | FAP: Familial adenomatous polyposis |
| CRC: Colorectal cancer | ||
| Colorectum (HTA11) |  | AD: Adenomas |
| SER: Sessile serrated lesions | ||
| MSI-H: Microsatellite-high colorectal cancer | ||
| MSS: Microsatellite stable colorectal cancer | ||
| Prostate | 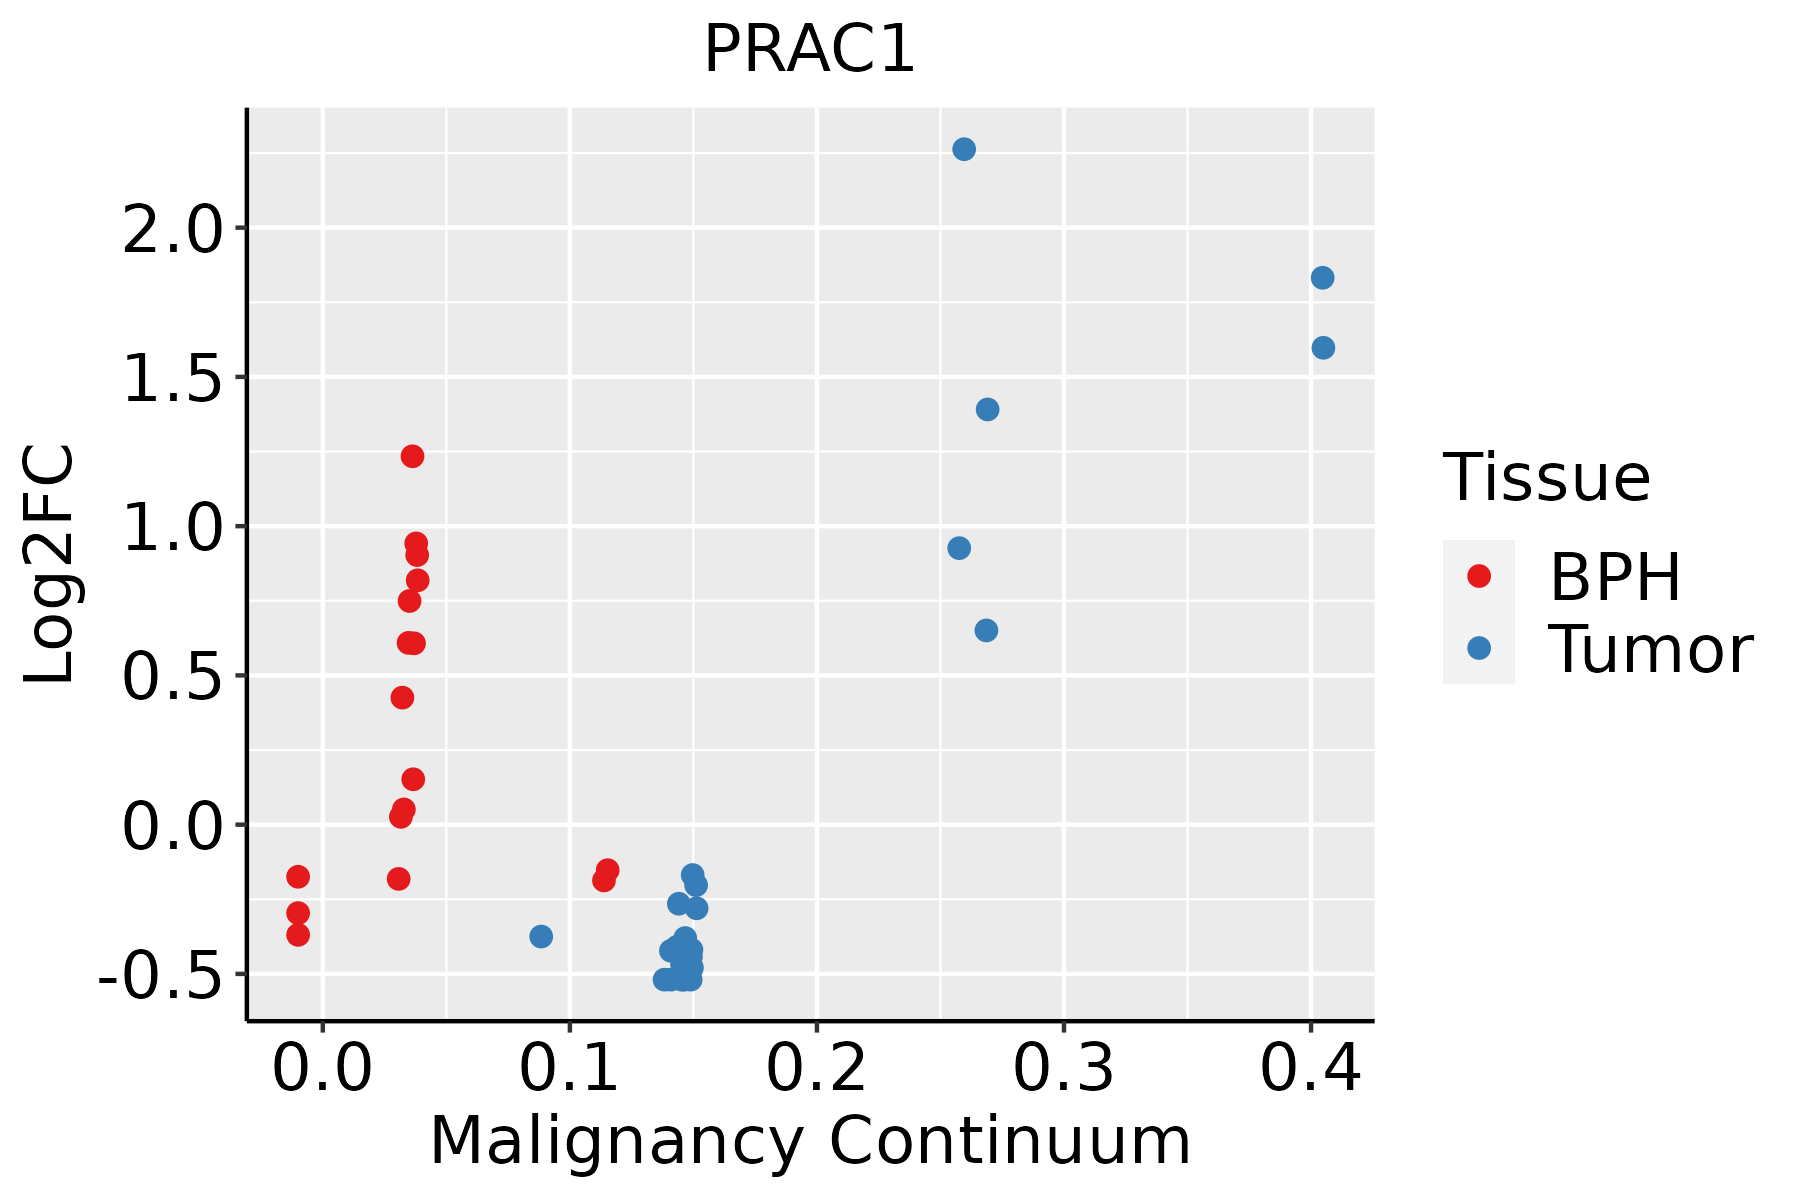 | BPH: Benign Prostatic Hyperplasia |
| ∗log2FC in expression of this searched gene in stem-like cells from each diseased tissue sample relative to stem-like cells in normal samples in each tissue plotted against the malignancy continuum. Samples are colored based on if they are from different disease stage. |
Top |
Malignant transformation related pathway analysis |
| Find out the enriched GO biological processes and KEGG pathways involved in transition from healthy to precancer to cancer |
| Tissue | Disease Stage | Enriched GO biological Processes |
| Colorectum | AD |  |
| Colorectum | SER |  |
| Colorectum | MSS |  |
| Colorectum | MSI-H |  |
| Colorectum | FAP |  |
| ∗Top 15 enriched GO BP terms are showed in the bar plot of each disease state in each tissue. Each row represents a significant GO biological process which is colored according to the -log10(p.adjust). |
| Page: 1 2 3 4 5 6 7 8 9 |
| GO ID | Tissue | Disease Stage | Description | Gene Ratio | Bg Ratio | pvalue | p.adjust | Count |
| Page: 1 |
| Pathway ID | Tissue | Disease Stage | Description | Gene Ratio | Bg Ratio | pvalue | p.adjust | qvalue | Count |
| Page: 1 |
Top |
Cell-cell communication analysis |
| Identification of potential cell-cell interactions between two cell types and their ligand-receptor pairs for different disease states |
| Ligand | Receptor | LRpair | Pathway | Tissue | Disease Stage |
| Page: 1 |
Top |
Single-cell gene regulatory network inference analysis |
| Find out the significant the regulons (TFs) and the target genes of each regulon across cell types for different disease states |
| TF | Cell Type | Tissue | Disease Stage | Target Gene | RSS | Regulon Activity |
| ∗The dot plots of a searched regulon are shown for all cell subpopulations in each disease state of each tissue based on the regulon specific score inferred using pySCENIC and by calculating the average expression. |
| Page: 1 |
Top |
Somatic mutation of malignant transformation related genes |
| Annotation of somatic variants for genes involved in malignant transformation |
| Hugo Symbol | Variant Class | Variant Classification | dbSNP RS | HGVSc | HGVSp | HGVSp Short | SWISSPROT | BIOTYPE | SIFT | PolyPhen | Tumor Sample Barcode | Tissue | Histology | Sex | Age | Stage | Therapy Types | Drugs | Outcome |
| PRAC1 | SNV | Missense_Mutation | c.56N>A | p.Ser19Asn | p.S19N | Q96KF2 | protein_coding | tolerated_low_confidence(0.11) | benign(0.003) | TCGA-A5-A0G2-01 | Endometrium | uterine corpus endometrioid carcinoma | Female | <65 | III/IV | Unknown | Unknown | SD | |
| PRAC1 | SNV | Missense_Mutation | novel | c.18C>A | p.Phe6Leu | p.F6L | Q96KF2 | protein_coding | deleterious_low_confidence(0) | benign(0.143) | TCGA-BK-A6W3-01 | Endometrium | uterine corpus endometrioid carcinoma | Female | <65 | I/II | Unknown | Unknown | SD |
| PRAC1 | SNV | Missense_Mutation | c.64C>T | p.Leu22Phe | p.L22F | Q96KF2 | protein_coding | deleterious_low_confidence(0) | probably_damaging(0.943) | TCGA-EO-A3AY-01 | Endometrium | uterine corpus endometrioid carcinoma | Female | <65 | I/II | Unknown | Unknown | PD | |
| PRAC1 | SNV | Missense_Mutation | novel | c.55N>G | p.Ser19Gly | p.S19G | Q96KF2 | protein_coding | deleterious_low_confidence(0.03) | benign(0.009) | TCGA-XR-A8TC-01 | Liver | liver hepatocellular carcinoma | Female | <65 | I/II | Unknown | Unknown | SD |
| PRAC1 | SNV | Missense_Mutation | c.64C>T | p.Leu22Phe | p.L22F | Q96KF2 | protein_coding | deleterious_low_confidence(0) | probably_damaging(0.943) | TCGA-18-3409-01 | Lung | lung squamous cell carcinoma | Male | >=65 | I/II | Unknown | Unknown | PD | |
| PRAC1 | SNV | Missense_Mutation | c.71N>G | p.Asn24Ser | p.N24S | Q96KF2 | protein_coding | tolerated_low_confidence(0.08) | benign(0.001) | TCGA-66-2754-01 | Lung | lung squamous cell carcinoma | Male | >=65 | III/IV | Unknown | Unknown | SD |
| Page: 1 |
Top |
Related drugs of malignant transformation related genes |
| Identification of chemicals and drugs interact with genes involved in malignant transfromation |
| (DGIdb 4.0) |
| Entrez ID | Symbol | Category | Interaction Types | Drug Claim Name | Drug Name | PMIDs |
| Page: 1 |

Copyright 2023-Present -The University of Texas Health Science Center at Houston |