
|
|||||
|
 | |
| |
| |
| |
| |
| |
|
Gene: PPWD1 |
Gene summary for PPWD1 |
| Gene information | Species | Human | Gene symbol | PPWD1 | Gene ID | 23398 |
| Gene name | peptidylprolyl isomerase domain and WD repeat containing 1 | |
| Gene Alias | PPWD1 | |
| Cytomap | 5q12.3 | |
| Gene Type | protein-coding | GO ID | GO:0000375 | UniProtAcc | B4DT22 |
Top |
Malignant transformation analysis |
| Identification of the aberrant gene expression in precancerous and cancerous lesions by comparing the gene expression of stem-like cells in diseased tissues with normal stem cells |
| Entrez ID | Symbol | Replicates | Species | Organ | Tissue | Adj P-value | Log2FC | Malignancy |
| 23398 | PPWD1 | LZE4T | Human | Esophagus | ESCC | 1.76e-07 | 1.23e-01 | 0.0811 |
| 23398 | PPWD1 | LZE7T | Human | Esophagus | ESCC | 8.39e-06 | 2.21e-01 | 0.0667 |
| 23398 | PPWD1 | LZE8T | Human | Esophagus | ESCC | 1.39e-03 | 1.31e-01 | 0.067 |
| 23398 | PPWD1 | LZE24T | Human | Esophagus | ESCC | 6.04e-14 | 3.05e-01 | 0.0596 |
| 23398 | PPWD1 | LZE6T | Human | Esophagus | ESCC | 2.74e-08 | 1.71e-01 | 0.0845 |
| 23398 | PPWD1 | P1T-E | Human | Esophagus | ESCC | 4.41e-09 | 2.85e-01 | 0.0875 |
| 23398 | PPWD1 | P2T-E | Human | Esophagus | ESCC | 3.59e-16 | 3.81e-01 | 0.1177 |
| 23398 | PPWD1 | P4T-E | Human | Esophagus | ESCC | 5.86e-19 | 2.54e-01 | 0.1323 |
| 23398 | PPWD1 | P5T-E | Human | Esophagus | ESCC | 1.38e-03 | 1.36e-01 | 0.1327 |
| 23398 | PPWD1 | P8T-E | Human | Esophagus | ESCC | 5.32e-17 | 2.11e-01 | 0.0889 |
| 23398 | PPWD1 | P9T-E | Human | Esophagus | ESCC | 1.83e-13 | 1.85e-01 | 0.1131 |
| 23398 | PPWD1 | P10T-E | Human | Esophagus | ESCC | 9.24e-13 | 1.69e-01 | 0.116 |
| 23398 | PPWD1 | P11T-E | Human | Esophagus | ESCC | 5.47e-22 | 4.58e-01 | 0.1426 |
| 23398 | PPWD1 | P12T-E | Human | Esophagus | ESCC | 2.85e-19 | 3.18e-01 | 0.1122 |
| 23398 | PPWD1 | P15T-E | Human | Esophagus | ESCC | 1.13e-11 | 1.88e-01 | 0.1149 |
| 23398 | PPWD1 | P16T-E | Human | Esophagus | ESCC | 2.92e-13 | 2.02e-01 | 0.1153 |
| 23398 | PPWD1 | P17T-E | Human | Esophagus | ESCC | 1.79e-06 | 1.74e-01 | 0.1278 |
| 23398 | PPWD1 | P19T-E | Human | Esophagus | ESCC | 3.06e-09 | 3.83e-01 | 0.1662 |
| 23398 | PPWD1 | P20T-E | Human | Esophagus | ESCC | 1.16e-17 | 2.61e-01 | 0.1124 |
| 23398 | PPWD1 | P21T-E | Human | Esophagus | ESCC | 4.33e-19 | 2.41e-01 | 0.1617 |
| Page: 1 2 3 4 |
| Tissue | Expression Dynamics | Abbreviation |
| Esophagus |  | ESCC: Esophageal squamous cell carcinoma |
| HGIN: High-grade intraepithelial neoplasias | ||
| LGIN: Low-grade intraepithelial neoplasias | ||
| Skin | 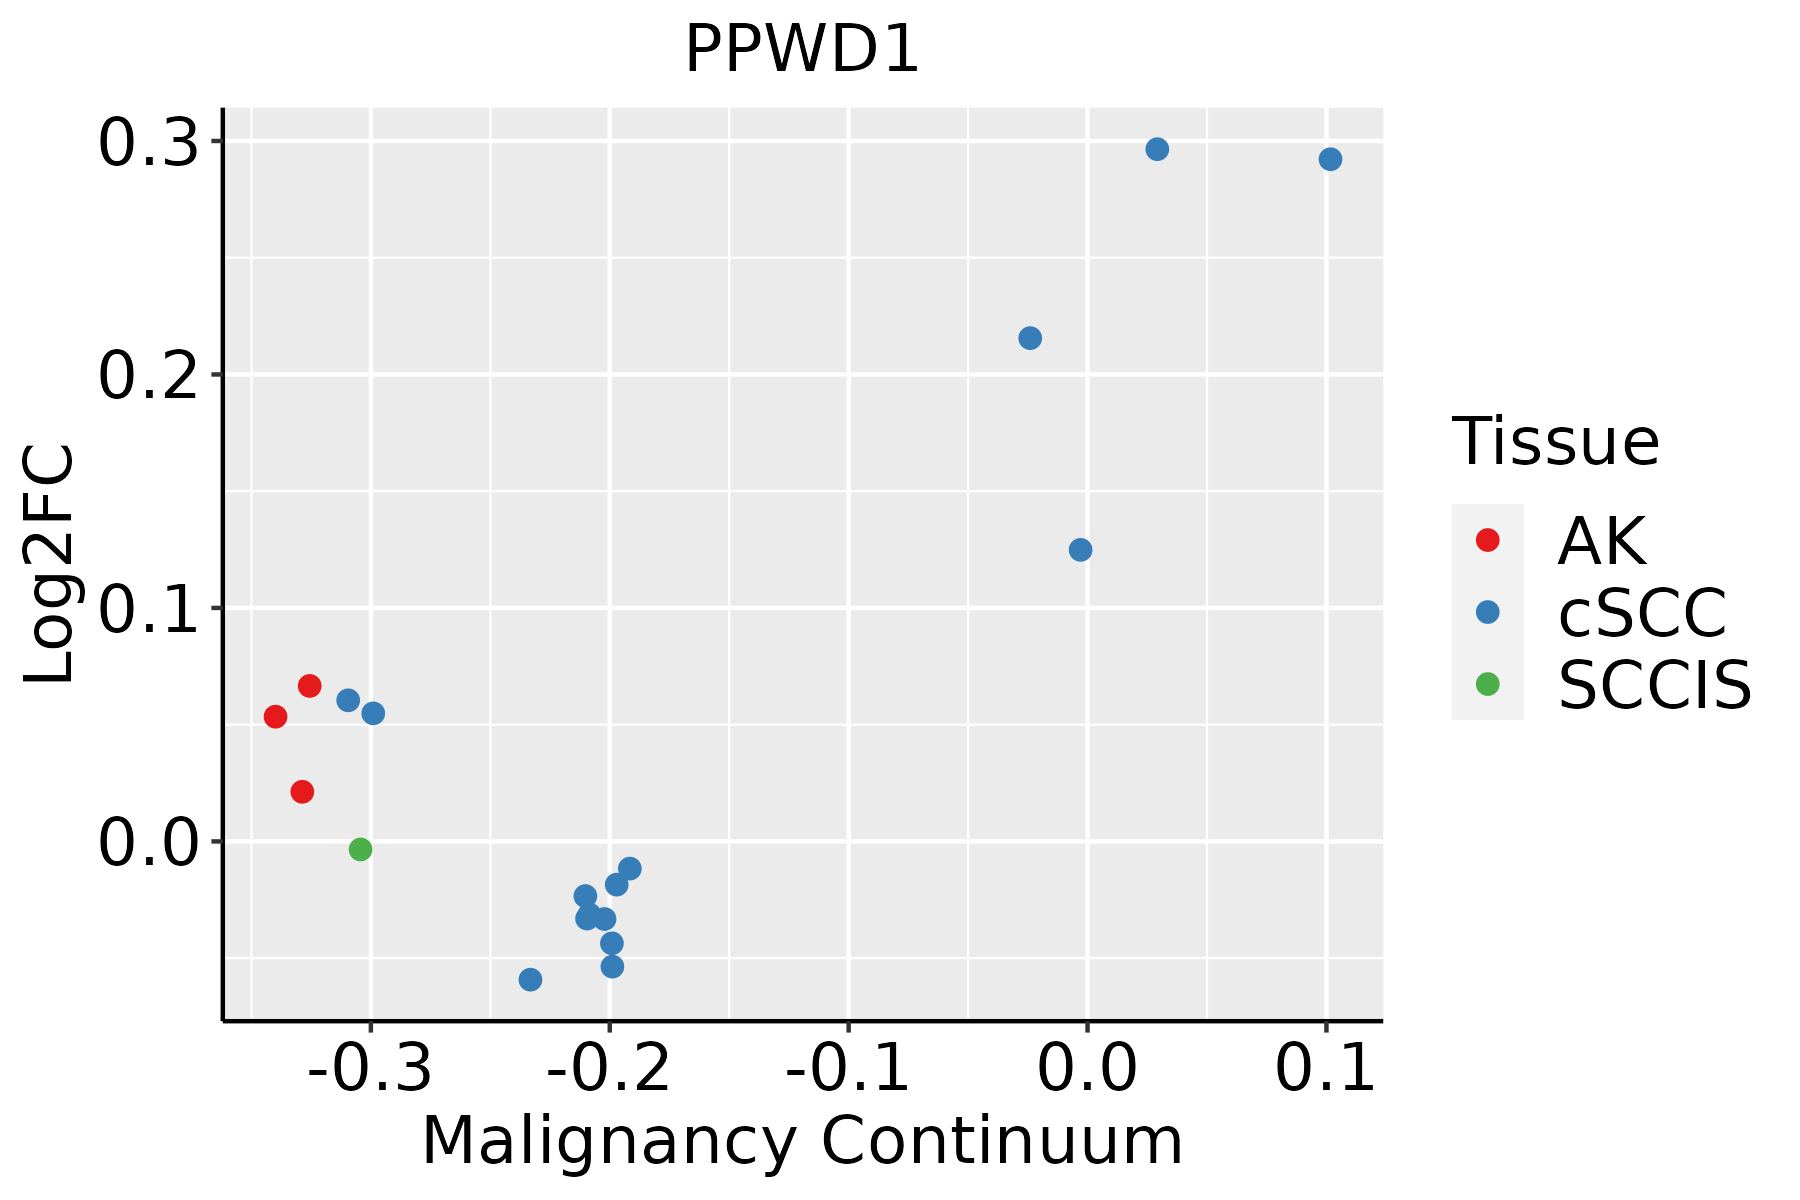 | AK: Actinic keratosis |
| cSCC: Cutaneous squamous cell carcinoma | ||
| SCCIS:squamous cell carcinoma in situ | ||
| Thyroid | 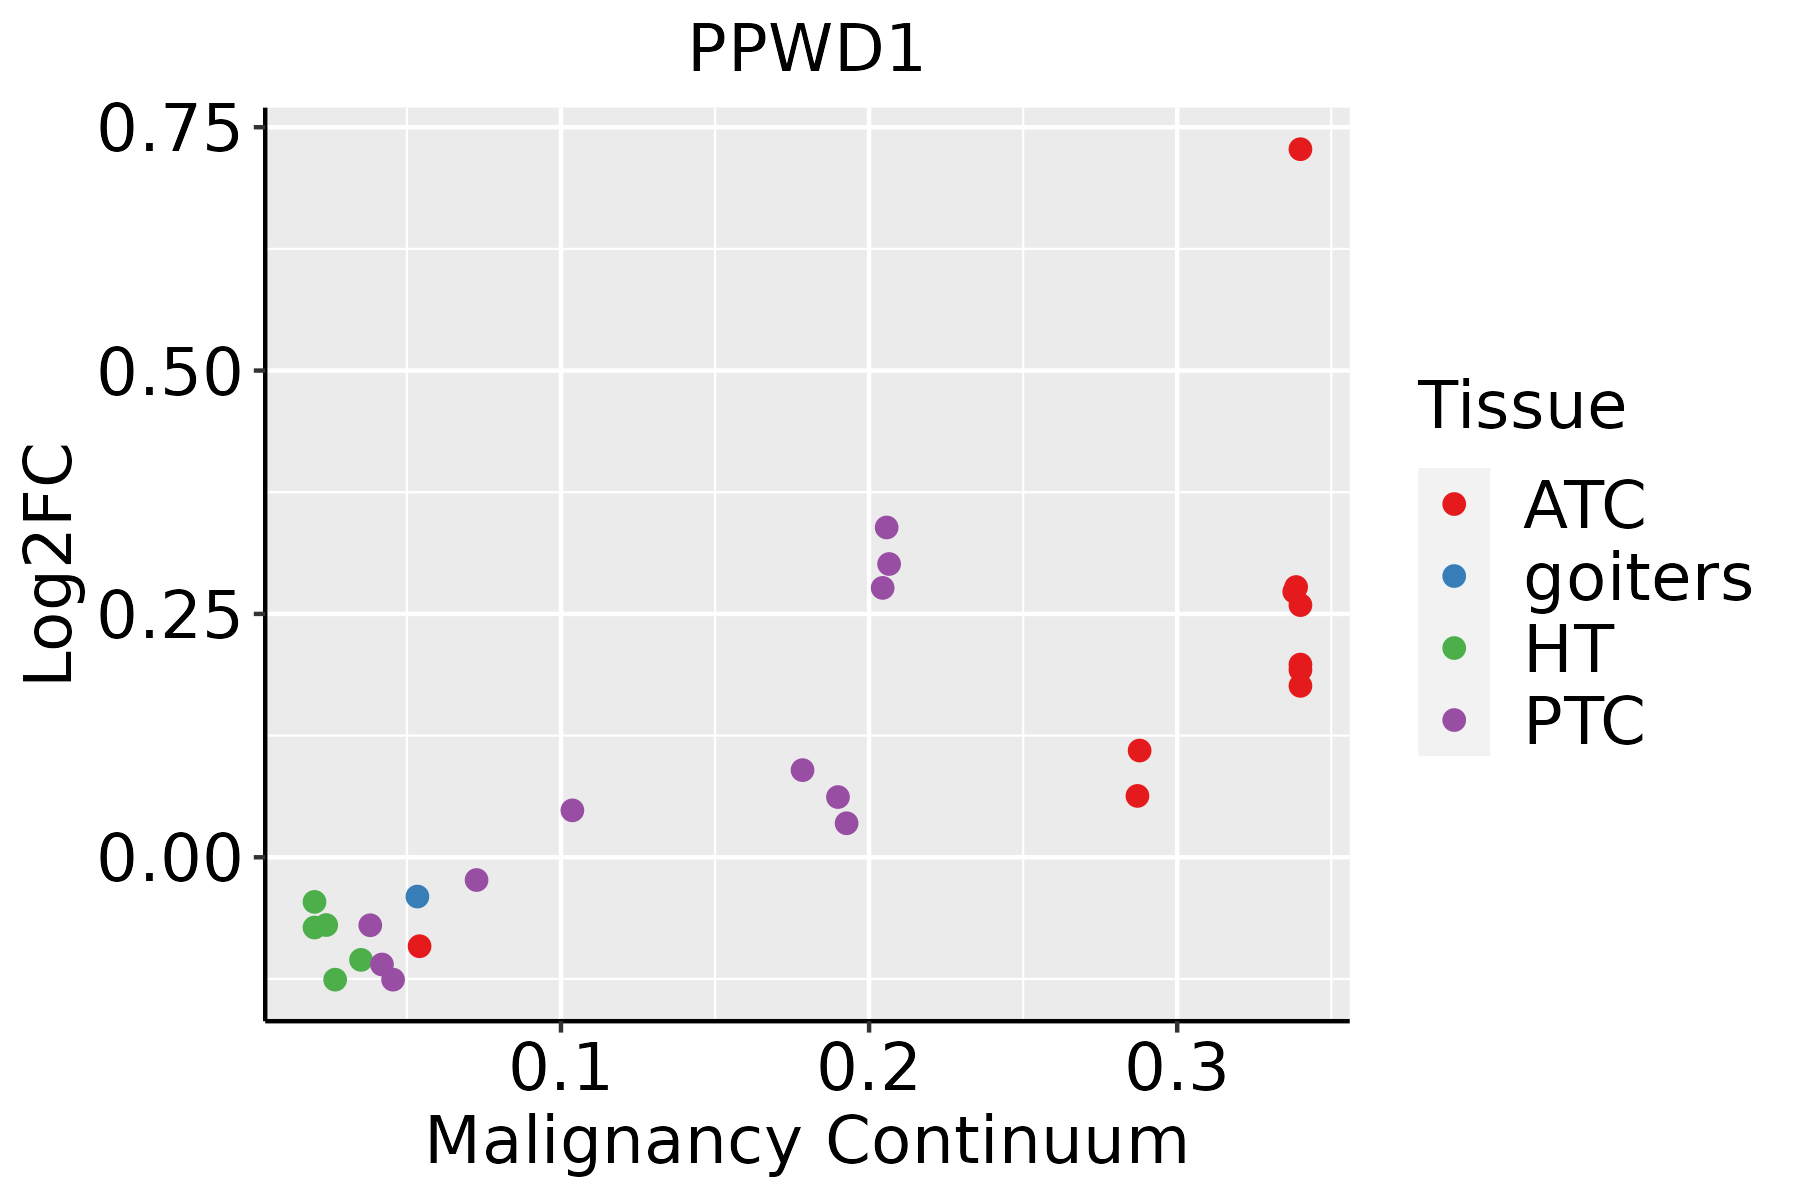 | ATC: Anaplastic thyroid cancer |
| HT: Hashimoto's thyroiditis | ||
| PTC: Papillary thyroid cancer |
| ∗log2FC in expression of this searched gene in stem-like cells from each diseased tissue sample relative to stem-like cells in normal samples in each tissue plotted against the malignancy continuum. Samples are colored based on if they are from different disease stage. |
Top |
Malignant transformation related pathway analysis |
| Find out the enriched GO biological processes and KEGG pathways involved in transition from healthy to precancer to cancer |
| Tissue | Disease Stage | Enriched GO biological Processes |
| Colorectum | AD |  |
| Colorectum | SER |  |
| Colorectum | MSS |  |
| Colorectum | MSI-H |  |
| Colorectum | FAP |  |
| ∗Top 15 enriched GO BP terms are showed in the bar plot of each disease state in each tissue. Each row represents a significant GO biological process which is colored according to the -log10(p.adjust). |
| Page: 1 2 3 4 5 6 7 8 9 |
| GO ID | Tissue | Disease Stage | Description | Gene Ratio | Bg Ratio | pvalue | p.adjust | Count |
| GO:0008380111 | Esophagus | ESCC | RNA splicing | 336/8552 | 434/18723 | 1.74e-42 | 3.67e-39 | 336 |
| GO:0000375111 | Esophagus | ESCC | RNA splicing, via transesterification reactions | 248/8552 | 324/18723 | 3.05e-30 | 1.49e-27 | 248 |
| GO:0000377111 | Esophagus | ESCC | RNA splicing, via transesterification reactions with bulged adenosine as nucleophile | 244/8552 | 320/18723 | 2.52e-29 | 1.07e-26 | 244 |
| GO:0000398111 | Esophagus | ESCC | mRNA splicing, via spliceosome | 244/8552 | 320/18723 | 2.52e-29 | 1.07e-26 | 244 |
| GO:001820816 | Esophagus | ESCC | peptidyl-proline modification | 46/8552 | 58/18723 | 1.59e-07 | 2.51e-06 | 46 |
| GO:000041313 | Esophagus | ESCC | protein peptidyl-prolyl isomerization | 32/8552 | 42/18723 | 5.52e-05 | 4.27e-04 | 32 |
| GO:0008380112 | Skin | cSCC | RNA splicing | 263/4864 | 434/18723 | 2.45e-53 | 5.13e-50 | 263 |
| GO:0000375112 | Skin | cSCC | RNA splicing, via transesterification reactions | 201/4864 | 324/18723 | 4.07e-43 | 5.10e-40 | 201 |
| GO:0000377112 | Skin | cSCC | RNA splicing, via transesterification reactions with bulged adenosine as nucleophile | 197/4864 | 320/18723 | 1.45e-41 | 1.14e-38 | 197 |
| GO:0000398112 | Skin | cSCC | mRNA splicing, via spliceosome | 197/4864 | 320/18723 | 1.45e-41 | 1.14e-38 | 197 |
| GO:001820810 | Skin | cSCC | peptidyl-proline modification | 37/4864 | 58/18723 | 1.53e-09 | 5.82e-08 | 37 |
| GO:00004136 | Skin | cSCC | protein peptidyl-prolyl isomerization | 26/4864 | 42/18723 | 9.92e-07 | 1.78e-05 | 26 |
| GO:0008380113 | Thyroid | PTC | RNA splicing | 273/5968 | 434/18723 | 4.44e-41 | 1.40e-37 | 273 |
| GO:0000375113 | Thyroid | PTC | RNA splicing, via transesterification reactions | 202/5968 | 324/18723 | 6.81e-30 | 3.91e-27 | 202 |
| GO:0000377113 | Thyroid | PTC | RNA splicing, via transesterification reactions with bulged adenosine as nucleophile | 199/5968 | 320/18723 | 2.96e-29 | 1.44e-26 | 199 |
| GO:0000398113 | Thyroid | PTC | mRNA splicing, via spliceosome | 199/5968 | 320/18723 | 2.96e-29 | 1.44e-26 | 199 |
| GO:001820817 | Thyroid | PTC | peptidyl-proline modification | 42/5968 | 58/18723 | 2.71e-10 | 8.91e-09 | 42 |
| GO:00004137 | Thyroid | PTC | protein peptidyl-prolyl isomerization | 30/5968 | 42/18723 | 1.65e-07 | 3.13e-06 | 30 |
| GO:000838034 | Thyroid | ATC | RNA splicing | 270/6293 | 434/18723 | 7.50e-35 | 1.19e-31 | 270 |
| GO:000037534 | Thyroid | ATC | RNA splicing, via transesterification reactions | 200/6293 | 324/18723 | 1.75e-25 | 7.39e-23 | 200 |
| Page: 1 2 |
| Pathway ID | Tissue | Disease Stage | Description | Gene Ratio | Bg Ratio | pvalue | p.adjust | qvalue | Count |
| Page: 1 |
Top |
Cell-cell communication analysis |
| Identification of potential cell-cell interactions between two cell types and their ligand-receptor pairs for different disease states |
| Ligand | Receptor | LRpair | Pathway | Tissue | Disease Stage |
| Page: 1 |
Top |
Single-cell gene regulatory network inference analysis |
| Find out the significant the regulons (TFs) and the target genes of each regulon across cell types for different disease states |
| TF | Cell Type | Tissue | Disease Stage | Target Gene | RSS | Regulon Activity |
| ∗The dot plots of a searched regulon are shown for all cell subpopulations in each disease state of each tissue based on the regulon specific score inferred using pySCENIC and by calculating the average expression. |
| Page: 1 |
Top |
Somatic mutation of malignant transformation related genes |
| Annotation of somatic variants for genes involved in malignant transformation |
| Hugo Symbol | Variant Class | Variant Classification | dbSNP RS | HGVSc | HGVSp | HGVSp Short | SWISSPROT | BIOTYPE | SIFT | PolyPhen | Tumor Sample Barcode | Tissue | Histology | Sex | Age | Stage | Therapy Types | Drugs | Outcome |
| PPWD1 | SNV | Missense_Mutation | c.389N>A | p.Arg130His | p.R130H | Q96BP3 | protein_coding | deleterious(0.01) | probably_damaging(0.994) | TCGA-A2-A0YG-01 | Breast | breast invasive carcinoma | Female | <65 | III/IV | Chemotherapy | cytoxan | SD | |
| PPWD1 | SNV | Missense_Mutation | novel | c.269N>T | p.Arg90Ile | p.R90I | Q96BP3 | protein_coding | deleterious(0) | probably_damaging(1) | TCGA-S3-AA11-01 | Breast | breast invasive carcinoma | Female | >=65 | I/II | Hormone Therapy | letrozole | CR |
| PPWD1 | insertion | Frame_Shift_Ins | novel | c.348_349insA | p.Ile119AsnfsTer6 | p.I119Nfs*6 | Q96BP3 | protein_coding | TCGA-A8-A07W-01 | Breast | breast invasive carcinoma | Female | >=65 | III/IV | Hormone Therapy | exemestane | SD | ||
| PPWD1 | SNV | Missense_Mutation | novel | c.814N>C | p.Asp272His | p.D272H | Q96BP3 | protein_coding | deleterious(0) | probably_damaging(0.945) | TCGA-C5-A1MH-01 | Cervix | cervical & endocervical cancer | Female | >=65 | III/IV | Chemotherapy | cisplatin | PD |
| PPWD1 | SNV | Missense_Mutation | c.626N>C | p.Arg209Pro | p.R209P | Q96BP3 | protein_coding | deleterious(0.01) | possibly_damaging(0.798) | TCGA-DR-A0ZM-01 | Cervix | cervical & endocervical cancer | Female | <65 | III/IV | Unspecific | Cisplatin | SD | |
| PPWD1 | SNV | Missense_Mutation | novel | c.118C>G | p.Gln40Glu | p.Q40E | Q96BP3 | protein_coding | tolerated(1) | benign(0) | TCGA-DS-A1OD-01 | Cervix | cervical & endocervical cancer | Female | <65 | I/II | Chemotherapy | cisplatin | SD |
| PPWD1 | insertion | Frame_Shift_Ins | novel | c.120_121insC | p.Glu41ArgfsTer4 | p.E41Rfs*4 | Q96BP3 | protein_coding | TCGA-DS-A1OD-01 | Cervix | cervical & endocervical cancer | Female | <65 | I/II | Chemotherapy | cisplatin | SD | ||
| PPWD1 | SNV | Missense_Mutation | c.742G>C | p.Glu248Gln | p.E248Q | Q96BP3 | protein_coding | deleterious(0) | probably_damaging(0.969) | TCGA-AA-3509-01 | Colorectum | colon adenocarcinoma | Female | <65 | I/II | Unknown | Unknown | SD | |
| PPWD1 | SNV | Missense_Mutation | rs763955094 | c.388N>T | p.Arg130Cys | p.R130C | Q96BP3 | protein_coding | deleterious(0) | probably_damaging(0.994) | TCGA-AA-A010-01 | Colorectum | colon adenocarcinoma | Female | <65 | I/II | Chemotherapy | folinic | CR |
| PPWD1 | SNV | Missense_Mutation | c.773N>G | p.Lys258Arg | p.K258R | Q96BP3 | protein_coding | tolerated(0.12) | benign(0.003) | TCGA-AD-6964-01 | Colorectum | colon adenocarcinoma | Male | <65 | III/IV | Chemotherapy | folfox | PD |
| Page: 1 2 3 4 5 6 |
Top |
Related drugs of malignant transformation related genes |
| Identification of chemicals and drugs interact with genes involved in malignant transfromation |
| (DGIdb 4.0) |
| Entrez ID | Symbol | Category | Interaction Types | Drug Claim Name | Drug Name | PMIDs |
| Page: 1 |

Copyright 2023-Present -The University of Texas Health Science Center at Houston |